SOLUSDC.P HL [1D] SHORTSOLANAUSDC.P | It appears that Point of Control is still 88--94, it marks the start of the move up and each subsequent daily candle has extended from and drawn back to $94. imo the first sign of weakness occurred on Tues 25/08 .. the first daily red candle on the extension up..
A few different techniques I use are in play.
1. the liquidation range for HTF I use to gauge a probable extent of an expansion or decrease. In this respect it is 17 & 26%. (3-5x lev)
2. A hand drawn trend line (bright green) marking higher lows, finally broken with Sunday 30/08 two fold move; both a retest of the highs for clarity and also printing a lower low on the D close.
3. Marking the Saturday 29/08 3min -4hr POC for both the short side and the long side, where they gained, and where they validated a sell. That's where we are rn as of writing.
4. Lastly, If we do retrace lower, and we retest the open of Friday 21/08 .. I like to ask where are both shorts exiting and also longs fully stopping out/invalidating at the same time? The former follows the latter .. (this may be getting in the weeds a bit here but::: a good trade (in this case a short) ends where the market is driving users (bulls) to participate (unwind) due to the invalidation of the bias inherent in the (bullish) assumption; in this case where does long invalidate for 99% of the move,)
In that event always expect some slippage at those zones.. and as to not induce bias ensure you are both ready for a move from $84 --> $94 high (bearish), but anticipating that it may too have marked a local low; invalidating HTF bearishness, and begin showing HTF signs of bullishness and gaining..
note: if we look at solbtc with the same lens.. the range there is approx. 0.00115--0.00124. With solusdc at $84 and solbtc 0.00115--0.00124.. btc would be between $67200-75806, wholly in the range we should be anticipating with a move lower on BTCUSDT.
tl;dr spot exited 80% +, in September 2026, I am anticipating a move lower on sol to between $81-95, with btc expected to be around $67-74k at the same time. In this event I will need to facilitate a long scalp in the event it tests and then eventually gains $95--99. lets see how this plays out. ty for reading. gg
#solusdc.p #hyperliquid #hl #btcusdt #bear #solbtc
In-depth trading ideas
Long trade
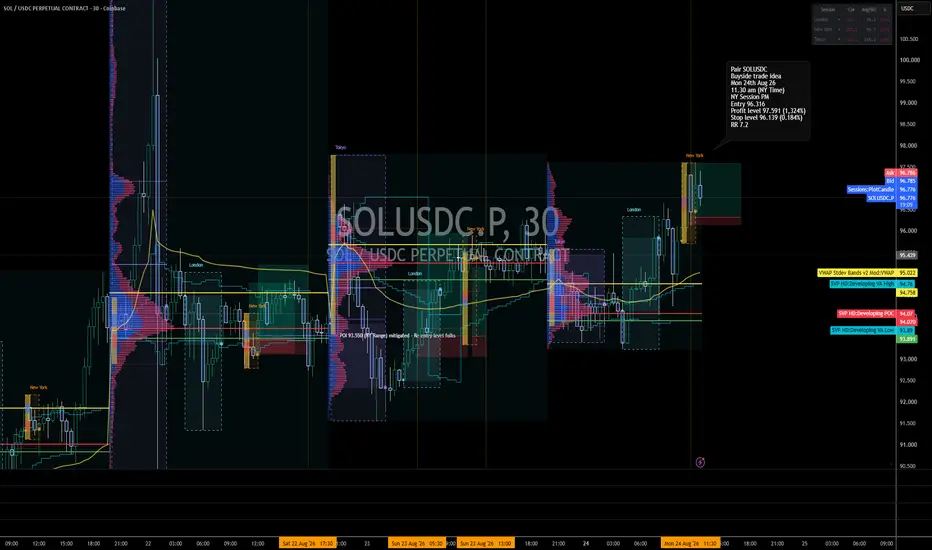
📊 SOLUSDC — POC / VALUE-AREA READ
Monday 24 August 2026
Entry Time: 11:30 AM NY Time
Session: NY Session PM
Direction: 🟢 Buyside
Entry: 96.316
Target: 97.591 (+1.324%)
Stop: 96.139 (0.184%)
RR: 7.2R
POC / Value Map
From the chart:
Developing VA Low: ~93.89
Developing POC: ~94.07
Developing VA High: ~94.76
Modified VWAP: ~95.02
Entry: 96.316
Current price: ~96.91–96.92
Target: 97.591
POC Narrative
This is a continuation-above-value trade.
SOL has already completed the lower-value recovery and is now trading materially above:
VAL → POC → VAH → VWAP
That tells us the auction has moved from balance into higher-value discovery. The entry at 96.316 is not trying to catch a bottom. It is participating after value has already migrated higher.
The clean path is:
93.89 VAL → 94.07 POC → 94.76 VAH → 95.02 VWAP → 96.316 Entry → 97.591 PAY
What POC Is Telling Us Now
The most important observation is that the whole developing value structure is now beneath price. That supports continuation as long as SOL continues to hold above the 96.1–96.3 entry/breakout region.
The next likely draw is the 97.5–97.6 upper liquidity area, which aligns well with the planned target. If price loses 96.139 and starts accepting back below the breakout structure, the continuation thesis weakens and rotation back toward VWAP becomes more likely.
SNAP POC Read
MAP → price above developing value
RAID → lower liquidity already worked
RECLAIM → POC / VAH / VWAP all recovered
SHIFT → bullish value migration confirmed
EXECUTE → 96.316
CONFIRM → sustained acceptance above 96.3
PAY → 🎯 97.591
Final Read
✅ POC reclaimed
✅ VAH reclaimed
✅ VWAP reclaimed
✅ Entry above value
✅ Value migration remains bullish
✅ Clear external liquidity overhead
✅ Strong 7.2R planned asymmetry
POC roadmap:
93.89 VAL → 94.07 POC → 94.76 VAH → 95.02 VWAP → 96.316 Entry → 97.591 PAY
@SNAPTradingFramework
Long trade
📊 SOLUSDC — POC / VALUE-AREA READ
Saturday 22 August 2026
Entry Time: 12:10 PM NY Time
Session: NY Session PM
Direction: 🟢 Buyside
Entry: 93.443
Target: 95.205 (+1.886%)
Stop: 93.118 (0.348%)
RR: 5.42R
POC / Value Map
From the chart:
Developing VA Low: ~93.19
Developing POC: ~94.06
Developing VA High: ~94.49
Modified VWAP: ~95.05
Current Price: ~94.23
Target: 95.205
POC Narrative
The entry at 93.443 came from below the developing POC and close to the lower side of value, which gave the trade a relatively efficient location.
The value path is:
93.443 entry
→ hold above VA Low ~93.19
→ reclaim POC ~94.06
→ accept above VA High ~94.49
→ test Mod VWAP ~95.05
→ 🎯 95.205 target
That is a clean lower-value to upper-value rotation.
What the POC is telling us now
Price has already reclaimed the developing POC around 94.06 and is trading above it.
That is constructive for the long.
The next real test is the 94.49 VA High.
If SOL accepts above that level, the path toward 95.05 VWAP and then the 95.205 target becomes much cleaner.
If price loses 94.06 POC again, the market could rotate back toward 93.73 previous session close and then the 93.19 VA Low.
SNAP POC Read
MAP → entry near lower value
RECLAIM → POC recovered
SHIFT → value migrating higher
EXECUTE → 93.443
CONFIRM → hold above 94.06 POC
PAY 1 → 94.49 VAH
PAY 2 → 95.05 VWAP
FINAL PAY → 🎯 95.205
Final Read
✅ Entry near lower value
✅ POC reclaimed
✅ Price now above developing POC
✅ VA High is the next confirmation zone
✅ VWAP sits just beneath the target
✅ Target aligns with higher-value delivery
POC roadmap:
93.19 VAL → 93.443 Entry → 94.06 POC → 94.49 VAH → 95.05 VWAP → 95.205 PAY
@SNAPTradingFramework
Solana fake out and confirmation bearishThis is not a financial advice!
Let me share with you a the fake out and continuous market bearish movement . As you can see we need confirmation on the 80 usd if it breaks down which m sure of price will decline to test HMA and SMA levels and the price is going to decline -50 usd through this year.
To be continued…
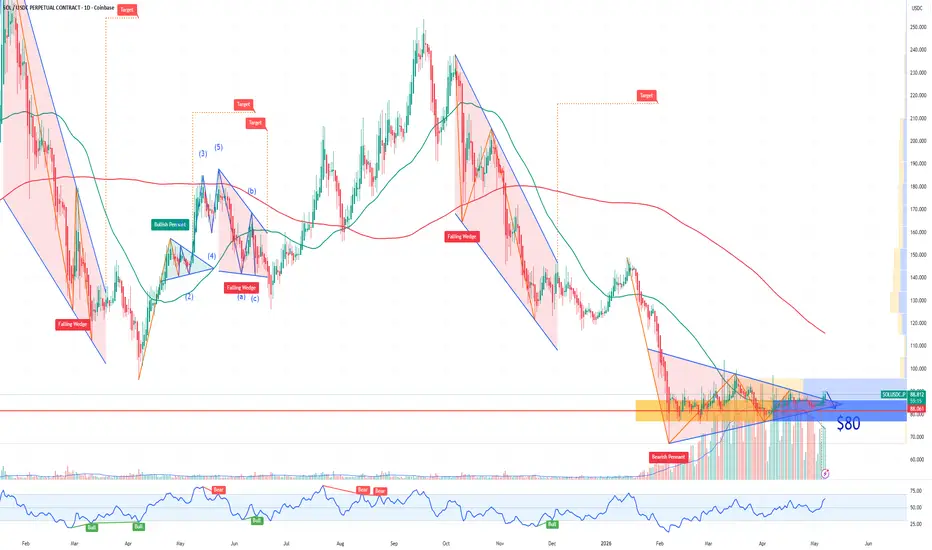
SOL SOlana Potentail Price TargetIf you haven`t bough the dip on Solana:
$80 is a major psychological and technical support zone, remains a realistic near-term scenario for SOL Solana .
Bear case:
Critical technical support at risk: $80 has acted as a strong floor multiple times in 2026 (February–April). SOL is forming a short-term descending pattern; failure to hold above $88–$90 and reclaim the 100-day EMA (~$98) would likely trigger a pullback straight to the $80 zone.
Macro headwinds for high-beta assets: Persistent sticky inflation and the Fed’s cautious stance on rate cuts continue to weigh on risk-on assets. Solana, being highly correlated with Bitcoin and broader risk sentiment, suffers first in any risk-off move or equity correction.
On-chain and sentiment fatigue: While ecosystem activity is solid, retail participation has cooled and ETF inflows have slowed after six straight months of declines in some periods. Whale distribution on rallies and lack of fresh catalysts.
What serious analysts & outlets are saying:
CryptoRank / CoinJournal: $80 is the make-or-break level — a daily close below it could accelerate selling.
Bitpanda & CoinCodex: Conservative 2026 scenarios see SOL grinding back toward $80–$90 if macro pressure persists and upgrades (Firedancer/Alpenglow) don’t deliver immediate hype.
InvestingHaven & multiple technicians: $75–$80 range is the lower bound of the 2026 working range in a base-to-bear case; a 10–15% correction from current levels is “very plausible” without strong BTC momentum.
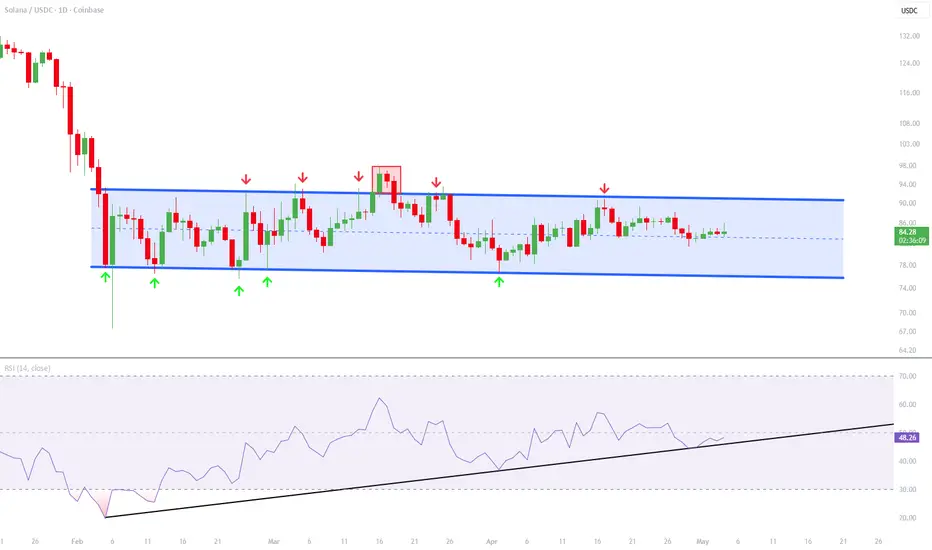
SOL - Trading Within Parallel Channel With the recent price action, Solana has remained highly correlated between the lows and highs of its channel, creating a very strong parallel structure.
The lows are around $76 with the primary daily candle body closes sitting around $78. This can be clearly seen on the daily line chart I posted a while ago. Even the most recent low on April 1st held that solid green trendline on the line chart:
The upper range is a little harder to identify precisely, but the main highs have been established around $91 to $92 with the key daily candle closes primarily coming in around $88. This can be seen to a certain extent on the line chart outlined here:
$SOL/USDT is holding a critical moment here. Price is moving in$SOL/USDT is holding a critical moment here.
Price is moving inside a clear descending channel and is now retesting the key support zone around 80–82. This level is acting as the decision point.
As long as this support holds, the structure favors a bullish breakout. A push above the channel resistance could open the path toward 88, then 92, and potentially 96.
If support fails, the entire bullish setup weakens.
For now, the bias remains bullish while price stays above support. 🚀
SOL/USD – Possible Double Bottom FormingSeeing a potential double bottom forming around the $100 support zone. Both sell-offs were met with strong buying pressure, creating similar lows and suggesting demand at this level.
If price can break and hold above the $103–104 resistance (neckline), this could confirm the pattern and open the door for a move toward $110+.
Still watching for confirmation ... not financial advice.
How to Identify Potential Direction BiasDirection Bias is critical to understanding the flow of the market current (Price action)
This guide explains how to use STIC Algo (Strategy 1 and Strategy 2). Both strategies work in a very similar way and rely on candle color, Change of Character (CHoCH), sentiment signals, and Fibonacci retracements. And can be used for either hedge trading or one-way trading mode
1. Understanding STIC Algo plots on Your Chart
When you add STIC to your chart, it automatically changes the candle colors:
Blue Candle → Bullish market condition
Yellow Candle → Bearish market condition
> Candle color is the first and most important filter. Strategy 1 mode trades in alignment with the candle color.
2. Key Signals You Must Watch
STIC uses three core signals:
1. Candle Color (Macro direction Bias) – Blue or Yellow
2. Change of Character (CHoCH) – Arrow signal
Green Arrow → Bullish CHoCH and Bearish CHoCH (opposite direction)
Sentiment Signals – Buy or Sell sentiment
3. How to Enter Trades (Core Logic)
A. Trading with Change of Character (CHoCH)
A Change of Character usually means the market is changing direction bias on the medium timeframe and it will likely retrace to grab liquidity as the order blocks before continuing.
Rule: Never enter immediately on CHoCH. Always wait for a retracement to any level of a fib retracement.
Bullish Example:
Candle color is Blue (bullish)
You get a Bullish CHoCH (green arrow)
Use Fibonacci retracement (manual or the FIB tool already plotted on TICK)
Wait for price to retrace to:
50%, or
Golden Ratio (61.8%)
Enter from the retracement level
Stop loss: Below the previous lowest low
Bearish Example:
Candle color is Yellow (bearish)
You get a Bearish CHoCH
Wait for price to retrace upward to your Fibonacci level
Enter from the retracement
Stop loss: Above the previous highest high
4. Trading with Sentiment Signals
Strategy 1 – Sentiment Aligned with Candle Direction, therefore Entry sentiment will only plot in the candle direction. Buy sentiment appears only on Blue candles and Sell sentiment appears only on Yellow candles
Sentiment gives E1 (Entry One)
You should always use multiple entries
E1: Immediate entry on sentiment
E2 (and above): Taken on retracement to improve average entry price and risk–reward
After E1, wait for a Fibonacci retracement (38.2%–75%) to take additional entries
Strategy 2 – Flexible Sentiment - hedge mode trading (Retracement Required)
Entry sentiment may plot on either side of the candle direction. This makes waiting for retracement mandatory
You may enter immediately on sentiment for E1 (Entry One) but, allow price to retrace into key Fibonacci levels before execution. This applies to both buy and sell setups
5. Important Notes & Best Practices
Statregy 1 Entry sentiment plot on plots when the Candle color always align with your trade direction.
False Change of Character setups can often occour during Consolidative market hase,Ensure to wait for confirmation and retracement before you use them.
Do not enter without waiting for a retracement espcially if the Candle color has not idicated the direction bias on a Macro level.
Fibonacci is mandatory, not optional
STIC works best with patience and discipline
6. Summary
To use STIC effectively:
1. Check candle color (Blue = Buy bias, Yellow = Sell bias)
2. Watch for CHoCH or Sentiment signal
3. Wait for Fibonacci retracement
4. Enter from key levels (50% / 61.8% / 75%)
5. Place stop loss beyond structure
If you have any questions or need further clarification, feel free to ask.
Don't forget to #Tradesmartly.
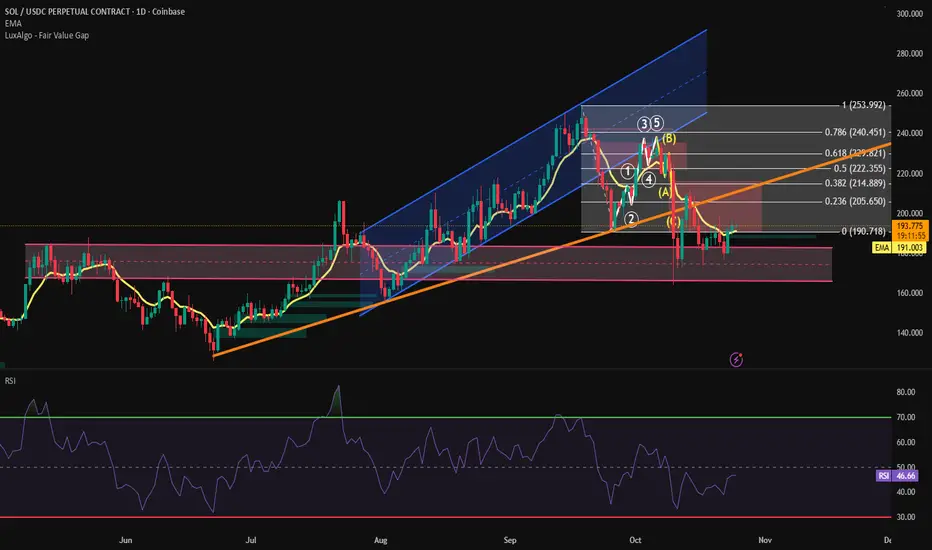
Waiting for FOMCSOL tried to break out yesterday reaching $198 at the .618 trend-based fib level but failed to break higher and has since fallen to $183.
I think we'll need a new Wave 1 impulse to the .786 @ $202 which displays a fair value gap from Oct 15th, followed by a Wave 2 correction and of course Wave 3 impulse in order to say a recovery from the 9/17 rate cut dump is occurring.
According to Polymarket we're expecting a 96% chance for another 25 Bps cut on 10/29. If we get it I expect a surge upward similar to the downward action after the previous FOMC announcement. I think it'll be bullish this time unlike the last announcement which saw SOL overbought moving into it. I'm actually hoping the price stays stagnant until the rate cut to provide more momentum that day of the announcement.
C Wave completeIt appears we're starting to recover to the .5 level from an extended corrective C wave early this morning (on the 15 minute interval). I think we're in for more sideways price action over the next 10 days until the next FOMC meeting / rate announcement though. It'd be nice to see an additional .5 cut to kick off alt season. I'm still on-board with the 4 yr cycle and expect alt season this quarter or early Q1 2026. I think the time frame is simply pushed out a few weeks/months due to the tariff sentiment in Q1.
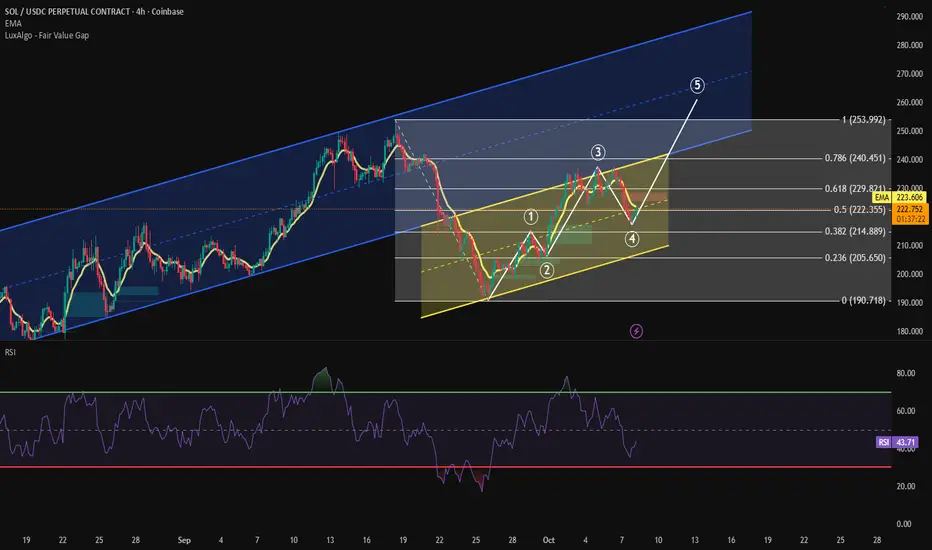
Boring for bit longerNo clue what's going on since the rate cut announcement. Big dump then sideways the last 5 days. The green 5 wave move is my best guess at what's next. I can't see a long term bearish scenario with all the bullish news & sentiment. The sideways action is hella boring and makes ppl what to exit. Sideways boring action is most often bullish from my experience. It might be a couple more weeks of sideways boredom until the next Fed rate cut expected the end of October. Anything between 190 and 240 "feels" sideways. It's a wide range but we were at 240 Oct 6th just 10 days ago and currently 194. Remember SOL was at just $95 April 7th. $129 June 23rd. It'd take a major event, black swan even, to dump that hard. I think we're at the quarterly low. I'm expecting a bull but 60/40 chance is my feeling near term ( next 2 weeks). I don't expect a big move until the next Fed rate announcement. Hurry up and wait!
Long squeeze!A long squeeze currently in place this afternoon after Trump threated 100% tariffs on China. It's a BS reason to be down this hard. It's an excuse for the bears to bring the pain! It's a Friday afternoon as well when the weekend market is docile adding more fuel to the squeeze. Long's know this will be short-lived it's just a matter of when continuation will occur. If you have the dry powder this weekend is a fantastic time to buy. This is the first of a handful of 10% BTC dumps. I'm still bullish on Q4. 👊
Still bullishSolana still trying to recover from the Fed rate cut dump flipping the blue ascending channel to resistance. It's actually recovered very quickly from $190 and trying to break back up into the blue channel. Overall Bullish in my view. A break back into the blue channel then a brief retest will signal a strong move to the upper end of the blue channel. If it dips below the midway point of the yellow channel I suspect it will be brief unless we fall below $200. A dip below $200 will signal a larger dip. But, I expect a second Fed rate cut in late October to result in an equally bullish pump similar to the recent dip pushing towards $300 SOL.
Is there a Sol left in the fridge?Hi,
I've been following Solana for weeks now and it seems ready to pop. I bought the last dip around $200 and now I'm waiting for $300 . Will it stop there? Not sure. If ETFs are approved, if companies keep piling in, and with the latest release giving lightning-fast confirmation, we’ve got the perfect setup for a big run.
Right now, Solana is number 6, but I’m sure it’s aiming for number 3. Of course, that means a big increase in market cap, but with two more rate cuts on the way, there’s reason to stay optimistic.
From a technical perspective, everything looks good on the daily and weekly. The momentum is strong and consistent, and it’s moving inside the parallel channel as expected. Could it break above $300 before the end of the year? The Fib 1.618 points to around $420 , which would be a great Christmas present.
For now, I’m aiming for $275 , which matches the upper side of the channel, and I’ll be looking for a rebound on the EMA50 or the lower side of the daily channel. Exciting times for Solana. Now it’s just about waiting, which is always the hardest part of trading. Stay sharp, traders!
New ascending channel?Looking at the recent pullback after the FOMC meeting it appears SOL is forming a new ascending channel, hopefully similar to the recent ascending channel leading up to the announcement. The price (thankfully) reversed upward and found resistance at the .786 fib level then continued to a similar thing at the .618 pulling back down and flipping the .786 to support. It's looking like a healthy recovery so far to me. I'm expecting SOL to follow the new smaller ascending channel leading into October. If we see another rate cut in late October hopefully we'll see a breakout higher rather than a breakdown this time. I'm new at this game so please let me know if I'm way off!
FMOC announcement tomorrowSolana price action! We're in a strong ascending channel. Over the past 2 days it's retracted to the midway point of the channel basically in a holding pattern awaiting tomorrow's FOMC interest rate announcement. If there's no rate cut I expect the price to fall to the bottom of the blue channel, but if a rate cut is announce (like almost all analyst expect), we'll likely see a breakout upwards towards $300 maybe by the end of the day tomorrow and further gains into the weekend. I personally plan to have a long position already open in anticipation of the rate cut which is heavily favored. If no cut is announced I have my stop loss in place to limit losses. 👊
SOL PERP Breakout & Scalping Zones (Coinbase)This chart tracks real-time SOL-PERP on Coinbase with key breakout, bounce, and rejection levels for scalping and trend continuation.
Indicators: EMA 9/21, VWAP, RSI (short-term overextension), volume-based support zones.
Key levels:
Bounce zone: $195–$196
Reclaim breakout: $202.5–$205.5
Final TP target: $209+
Setup focused on short-term trading (1m–5m) with momentum confirmation.
Monitored live for real-time decision support, alert integration, and automated trade journaling.
Price tapped the origin. Now we wait for the rest to catch up.Most of the market is reacting. I’m just tracking delivery.
SOLUSDC just printed a clean raid into the 1D OB — perfectly aligned with a HVN on the volume profile. It’s not a coincidence. It’s Smart Money reloading before the next distribution cycle.
The sell-side sweep into 150.7 tagged the 0.786 retracement and the top edge of a stacked STB/OB zone. That’s where I’m already building long exposure.
Price isn’t reversing because of “support.”
It’s reversing because the inefficiency from the rally has now been filled — the FVG is complete, and the reaction confirms it.
From here, my first draw is 171.198 — the EQ of a 1D OB and a known liquidity pool. If we displace through that with conviction, I expect full expansion toward the 184.8 high.
Execution logic:
🔑 Entry: 150.7–154 zone (1D OB + STB zone + 0.786 retrace)
🎯 First TP: 171.198
🛑 Invalidation: 141.4 break and close below (full POI invalidation)
🧠 Patience if we revisit 141 — that level may serve as the final sweep before a macro move higher
I don’t trade headlines. I trade imbalance and narrative.
Precision or nothing. This is why my trades don’t miss.