SOLUSDT | SELL SETUP...
🔻 SOLUSDT | SELL SETUP
Sell Reaction Zone: 121.50–123.00
🎯 Downside Levels
Target A: 116.50
Target B: 112.50
Target C: 106.00
🛡️ Invalidation: 124.50
📊 Chart Analysis:
SOLUSDT is testing a major 122–124 resistance zone after a strong bullish advance. Price is showing rejection near the upper resistance while the rising trendline is coming under pressure. A confirmed rejection from this area could lead to a pullback toward the 116.50 support, followed by 112.50 and potentially the broader 106.00 support zone.
A sustained breakout and acceptance above 124.50 would invalidate the bearish setup.
In-depth trading ideas
SOLUSDT Price Analysis Bullish Channel Targets 128–130 Liquidity🔹 SOLUSDT is showing a constructive bullish market structure, with price continuing to form higher highs and higher lows inside a rising channel. The recent move above the 116–118 area suggests strengthening price action, while the 112–113 support zone remains an important structural area. Price is currently approaching the upper side of the channel, with liquidity visible around 128–130, making this resistance area important for the next reaction.
🔸 If SOLUSDT maintains the current structure and holds above the highlighted support zone, price could continue toward the upper channel and nearby liquidity area. Traders may wait for clear price confirmation before considering any trade. A rejection near resistance could lead to a pullback toward the channel’s lower boundary, while a sustained move above resistance may suggest further upside momentum. If the 112–113 support zone fails, the bullish structure could weaken and deeper retracement may develop.
This analysis is for educational purposes only and does not constitute financial or investment advice. Always conduct your own research before making trading decisions.
SOLUSDT: Continuation structure, Bulls hold advantageSOLUSDT is trading around 115.2 USDT after bouncing off the 113–114 zone. The price is currently holding above the EMA89 (near 114.95) but remains below the EMA34 and the upper boundary of the descending channel; consequently, the 116–117 USDT area will determine the next move.
If SOL maintains the 114–115 level and clearly breaks out of the 116.5–117 zone, the short-term structure will improve significantly. In that scenario, I lean towards an extension to 118–119, followed by a move toward the primary target around 120.5 USDT.
It is worth noting that SOL previously broke out of a similar descending channel and rallied sharply, so the price action at the trendline this time bears watching. However, I prefer waiting for a confirmed breakout rather than buying right below resistance.
The bullish scenario would weaken if SOL loses the 114 USDT level, particularly if it breaks the recent low around 113.
SOLUSDT: Buyers Take Control, Next Higher AimSOLUSDT is trading around 117.9 USDT following a decisive breakout from the descending channel that had been in place since late August. The price is currently holding firm above the EMA34 (around 110) and the EMA89 (near 105.5), signaling a distinct shift toward a more positive H4 market structure.
After a rapid rally toward 120, chasing the price is not my preferred strategy. The 110–114 USDT range stands out as a key "Buy Zone." If SOL pulls back to this area but finds continued support from buyers, the likelihood of a return to 120—followed by an extension to the 124–127 USDT range—increases significantly.
Solana’s internal metrics also support a bullish outlook. FXStreet reported a nearly 12% gain for SOL over the past week, while the ecosystem of tokenized equities on Solana reached a record high of approximately 850,000 unique holders, indicating continued improvement in network activity and demand.
The broader "risk-on" environment is also favorable, driven by falling US bond yields, cooling oil prices, and a strong rally in Bitcoin—even though the USD remains supported by expectations of continued Fed tightening.
The bullish scenario would be undermined if SOL decisively loses the 110 USDT level, particularly if it falls back below the EMA34.
HOW-TO: Read MSL Buy and Sell Signals 📌 Overview
This educational example uses the SOLUSDT 1-hour chart to explain how MSL Buy Sell Signals displays market state, confirmed BUY and SELL signals, risk-based targets and completed setup outcomes.
The current Dashboard shows:
• STATE: DOWN
• Last Signal: BUY
• Setup: CLOSED / REVERSE
• Move: 1.49%
These values describe different parts of the indicator and should not be interpreted as a new signal. The purpose of this publication is to explain how they work together.
This is not a current trade recommendation or a prediction of future price movement.
━━━━━━━━━━━━━━━━━━━━
🧭 1. Reading the Adaptive Channel
The colored channel represents the indicator’s current market state.
The central rail adapts its response to the character of price movement:
• During directional movement, it reacts more quickly.
• During choppy movement, it responds more slowly to reduce unnecessary state changes.
An ATR-based envelope surrounds the adaptive rail.
• A teal channel represents an upward state.
• A red channel represents a downward state.
The channel describes the current state. It is not a BUY or SELL signal by itself.
━━━━━━━━━━━━━━━━━━━━
🟢 2. How BUY and SELL Signals Are Confirmed
A BUY signal appears after a candle closes beyond the upper channel boundary and the additional confirmation margin.
A SELL signal appears after a candle closes beyond the lower channel boundary and the confirmation margin.
Signals are confirmed only after the candle closes. A temporary wick beyond the channel is not sufficient.
The additional margin is designed to filter weak breaks:
• A larger margin generally produces fewer and later signals.
• A smaller margin increases sensitivity but can create more signals in noisy conditions.
Only one setup can be active at a time.
━━━━━━━━━━━━━━━━━━━━
🔄 3. New Signals and Reentries
A signal can represent either:
• a new directional state; or
• a same-direction reentry after a previous stop.
If a setup closes by its stop while the market state remains unchanged, the indicator can allow another entry in the same direction after a new confirmed close beyond the channel.
Reentry can be disabled in the settings when the user prefers to wait for a complete state reversal.
When the market state changes against an open setup, the existing setup closes as REVERSE. A new setup in the opposite direction can begin only after the next qualifying confirmed close.
━━━━━━━━━━━━━━━━━━━━
🎯 4. Entry, Initial Stop and TP Levels
Every confirmed BUY or SELL signal creates a visual trade model containing:
• Entry
• Initial SL
• TP1
• TP2
• TP3
Entry is the closing price of the confirmed signal candle.
The initial stop is derived from the opposite side of the ATR envelope, with an optional volatility buffer. An additional ATR-based cap can limit an excessively wide initial stop.
The distance between Entry and the initial stop defines the initial risk. TP1, TP2 and TP3 are calculated as configurable multiples of that risk.
These levels are educational reference points. They are not automatic orders or guaranteed outcomes.
━━━━━━━━━━━━━━━━━━━━
🟣 5. Reading the TP Labels
A 1TP, 2TP or 3TP label means that price touched the corresponding target during that historical setup.
The percentage displayed inside the label measures the price movement from Entry to that target.
The labels record historical target touches:
• 1TP — the first target was touched.
• 2TP — the second target was touched.
• 3TP — the third target was touched.
A closer target will normally be reached more frequently than a distant target. Target-touch frequency should not be interpreted as profitability.
━━━━━━━━━━━━━━━━━━━━
🛡️ 6. Protection After TP1
TP1 changes the risk-management state of the setup.
After TP1 is reached, the stop is moved to Entry and becomes active from the following candle. On the chart, the Entry level changes color to show that protection has been activated.
This is a fixed breakeven stop, not a trailing stop.
If the TP1 candle itself closes back at or beyond Entry before the breakeven stop becomes active, the setup closes at that candle’s close. This outcome is identified as TP1 CLOSE.
━━━━━━━━━━━━━━━━━━━━
🚪 7. How a Setup Can Close
A setup can end in several ways:
• SL — price reached the initial stop before protection was activated.
• BE — price reached Entry after the stop had been moved to breakeven.
• TP1 CLOSE — TP1 was reached, but the same candle closed back at or beyond Entry.
• REVERSE — the confirmed market state changed against the active setup.
If price gaps beyond the stop, the historical exit uses the less favorable value between the opening price and the stop level.
Targets do not automatically close the entire setup. They record target touches while the setup remains subject to its stop and reversal rules.
━━━━━━━━━━━━━━━━━━━━
📊 8. Reading the Dashboard
The Dashboard separates current state from the most recently modeled setup:
• STATE — the indicator’s current directional state.
• Last Signal — the direction of the most recent setup.
• Setup — the current or final setup status.
• Move — the modeled percentage movement of the active or most recently closed setup.
• TP1, TP2 and TP3 — target-touch rates from the selected sample of closed setups.
On this chart, STATE is DOWN while Last Signal is BUY because the most recent BUY setup has already closed after the state reversed.
CLOSED / REVERSE confirms that the BUY setup ended when the indicator entered the opposite state.
The displayed Move refers to that completed modeled setup. It is not an account return and does not include fees, slippage, position sizing or execution differences.
━━━━━━━━━━━━━━━━━━━━
📈 9. Understanding the Historical Statistics
The Dashboard uses the latest 50 closed setups in this example.
• TP1: 74% / 50
• TP2: 30% / 50
• TP3: 22% / 50
For example, TP1 at 74% means that 74% of the latest 50 closed historical setups touched TP1.
Only closed setups enter the sample. An active setup is excluded until it closes.
These values are target-touch rates. They are not win rates, realized returns or forecasts of future performance.
━━━━━━━━━━━━━━━━━━━━
✅ Practical Review Process
1. Identify the current channel color and STATE.
2. Locate a confirmed BUY or SELL label.
3. Follow the setup from Entry to its initial SL and targets.
4. Note which TP labels appeared.
5. Check whether Entry became protected after TP1.
6. Identify whether the setup ended by SL, BE, TP1 CLOSE or REVERSE.
7. Review both favorable and unfavorable examples.
8. Compare behavior across different volatility and market conditions.
Use standard candlestick charts. Heikin Ashi, Renko, Kagi, Point and Figure, Line Break and Range charts modify price data and can distort signals, stops and targets.
━━━━━━━━━━━━━━━━━━━━
⚠️ Important Limitations
If TP1 and the stop are both touched during the same candle, TP1 is credited and the setup still closes at the stop. The exact intrabar sequence cannot be determined from standard OHLC candle data.
TP2 and TP3 do not receive new credit on a candle that also touches the stop.
Historical signals and target-touch statistics do not account for commissions, slippage, position sizing or individual execution decisions.
MSL Buy Sell Signals is a decision-support indicator. It does not execute trades, provide personalized financial advice or guarantee any trading outcome.
Historical behavior does not guarantee future results. Every trading decision requires independent analysis and risk management.
━━━━━━━━━━━━━━━━━━━━
🔗 Indicator
MSL Buy Sell Signals:
Solana SMC Analysis: Break Above $148.73 Could Confirm a CHoChSolana SMC Analysis: Break Above $148.73 Could Confirm a Major CHoCH
On the HTF chart, CRYPTOCAP:SOL is approaching a critical HTF supply zone at $138–$149, where a major Bearish Order Block remains unfilled.
The broader structure is still defined by a Lower High, but the recent recovery from the $60.14 macro low has significantly strengthened short-term market structure.
Key SMC Levels:
▪️ $138–$149 → HTF Bearish Order Block
▪️ $148.73 → Critical structural level / potential CHoCH
▪️ $95.78 → Major inducement & structural reference
▪️ $74.15 → Key support
▪️ $60.14 → Macro swing low
BULLISH SCENARIO: A clean HTF close and acceptance above $150 could confirm a genuine CHoCH and invalidate the current Lower High structure.
Potential expansion zones: $250 → $500 → $700–$1000.
BEARISH SCENARIO: Rejection from $139–$150 could trigger another distribution leg toward $95, $74 and potentially $60.
For me, the key question is simple:
Will SOL reject from the HTF Bearish OB, or finally break the Lower High and transition into a new bullish market structure?
NFA. DYOR.
SOL/USDT BUY UPDATE🚀 SOL/USDT — BUY SETUP | TradingView Update
🟢 Bullish Breakout Momentum
📌 Asset: SOL/USDT
⏱️ Timeframe: 15M
📈 Bias: BUY / Bullish
🎯 Entry: 115.99
🛑 Stop Loss: 114.14
🚀 Take Profit: 119.80
⚖️ Risk-Reward: Approx. 1:2.05
Market Structure: Price has reclaimed the 114.99 key structure level with strong bullish momentum after sweeping the lower liquidity zone. The setup is targeting the next upside area around 119.80.
📊 Setup: Liquidity Sweep + Structure Reclaim + Bullish Momentum
SOLUSDT 8H Update — Retest Held, Trendline Broken TooFollow-up to the rangebreaker CHoCH flagged last update. The sequence played out in order, which is worth noting plainly rather than just moving on to the next chart.
C swept below the range at 96, reclaimed back above 97.38, and the smaller timeframe came back to retest that exact level, the small candles sitting right on 97.38 before the push. That retest holding was the actual entry point, not the reclaim candle itself, exactly the sequence the methodology calls for. From there price didn't just bounce, it broke straight through the descending trendline from the 110 high and printed a fresh local high at 114.32.
Gate one, structure, is now confirmed rather than pending. The trendline that gated the last update's read is broken, and this is happening with the larger trend from the August low near 80, not against it.
Gate two, the zone, was the 96-98 region. It did its job twice, once as the sweep and once as the retest, and both times it held.
Gate three, the trigger, is confirmed. The break above the trendline with a new high on top of an already-confirmed CHoCH and successful retest is about as complete as this kind of setup gets. What matters now is whether 97.38 continues to hold as support on any pullback, that's the new line in the sand. Losing it back below would undo the structural read this entire sequence has been building.
If anyone faded the rangebreaker, this is the chart that explains why that's a hard way to trade. The sweep does the work of clearing out the people who would have sold the reclaim. The retest is just confirmation for everyone else.
SOLUSDT: Pullback Open the Way TowardSolana remains constructive on the H4 chart after breaking out of the previous descending channel. Since that breakout, price has built a clear sequence of higher highs around $114.52, $120.09 and $125.08, showing that buyers have continued to push the structure upward.
The current decline from $125.08 looks more like a pullback than a confirmed reversal. The main area to watch is the $114–$118 buy zone, where previous structure meets the rising EMA support. If buyers defend this region and price starts recovering above the short-term EMA again, the bullish structure remains intact.
A successful rebound would first bring $125 back into focus. Breaking that high could then open the next expansion toward approximately $130–$132.
Macro / market context
Institutional flows also support the bullish case. U.S. spot Solana ETFs recorded a record $86.7 million daily inflow on Friday and about $188.2 million for the week, while combined SOL ETF assets reached a record $1.5 billion. FXStreet also highlighted firm institutional demand behind SOL's recent recovery.
Trade idea
Bias: Bullish
Buy zone: $114–$118
First resistance: $125.08
Main target: $130–$132
Invalidation: Sustained H4 break below approximately $113
For now, I prefer waiting for buyers to confirm the reaction inside the buy zone rather than chasing the previous rally.
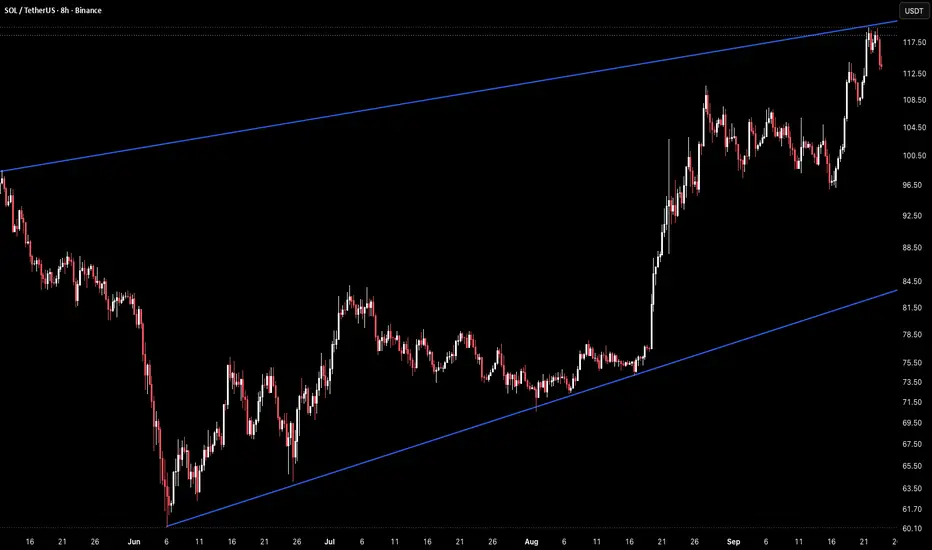
SOL 8H – Testing Rising Channel Highs After Breakout RallySolana is trading around 113.90 on the 8H timeframe after breaking out sharply from the range that held throughout July and August, now pushing directly into the upper boundary of the rising channel that has framed this entire structure since the June low.
The broader pattern began with a steep decline into early June, bottoming near 60.10 at the point where the lower channel trendline originates. From there, price built a wide basing range between roughly 73 and 84 through most of July and August, with the upper channel trendline running well above the entire time. That range finally resolved with a strong breakout in late August, sending price from the low 70s up through 100 and continuing into a fresh push toward the channel's upper boundary near current levels.
Price is currently testing that upper trendline directly after tagging a high near 118, pulling back slightly to 113.90 as the market decides whether to break through or roll over from this resistance.
Key Levels To Watch:
→ 118.00 Recent high, upper channel trendline resistance
→ 113.90 Current price, testing channel resistance
→ 108.50 Prior swing high, first support on a pullback
→ 100.50 Breakout level, key flip zone from the range
→ 84.00 Range high, deeper support if breakout fails
→ 60.10 Channel origin, June low
A break and hold above 118 confirms the channel resistance is broken, opening the door to a continuation move with the breakout strength suggesting further upside if this level gives way.
Rejection from the channel trendline sends price back down to retest 100.50, and a deeper pullback would bring the 84.00 range high back into focus as the next support.
Hold above 100.50 and SOL stays on track for a channel breakout. Rejection here keeps price capped inside the channel for now.
Bias stays bullish given the strength of the breakout that preceded this test, but the reaction at the channel trendline is the level that decides the next move.
SOL best bull is backSolana will once again test resistance around 148–155. I think now is the right time—don’t hesitate to jump in and join the bulls. We all know that Solana is set to become one of the strongest ecosystems in DeFi. Such a low, discounted price may not be seen again for some time. In my opinion, this is most likely your last chance to become an investor in the largest blockchain ecosystem.
SOL — BREAKOUT TEST AND REJECTION🚀
SOL is currently testing a major multi-month resistance line, confirming a decisive rejection following a recent wedge breakout. The asset remains within a broader structure, but the inability to flip this descending trendline into support creates a bearish deviation. We anticipate a pullback toward the internal wedge consolidation zone as the momentum stalls at the ceiling, effectively cooling the recent impulsive expansion.
📈 FACT — $1B inflow into Bitcoin ETFs bolsters general market sentiment.
🤝 FACT — Binance's $100M Circle stake signals major institutional alignment.
The path of least resistance is downward as bulls lack strength to clear the primary trendline.
🔑 Key Levels
🚧 Resistance: $128
🛡️ Support: $110
Solana Breakout Soon Hello everyone, I hope you are doing well.
I have previously shared many analyses for this altcoin, and we achieved significant profits—reaching up to 30x—from it.
Take a look at the analysis below.
Disclaimer: Altcoins carry high risk, so please take full responsibility for your buying and selling decisions.
If you have any questions, feel free to leave them in the comments below
Solana meets first resistance, ready to hit $500!The first resistance stands at $122 and this is the level that is being challenged this week. The first, Fibonacci extension based, resistance on SOLUSDT starts with 100% profits potential, from a low of $60 in June 2026 to the current high.
This week SOLUSDT hit the highest price since January 2026 and the entire bear-market bottom range has been recovered. Solana is trading above the April 2025 low which has a price of $95.
Above $95, SOLUSDT can be considered hyper-bullish based on all timeframes and future scenarios. Any trading above $100, a rounded number, and the bulls are in full control of the chart.
There can be retraces and sudden moves counter-trend, this is unavoidable and can happen at anytime without prior notice. The entire market can be rising for weeks or months and then suddenly, a correction appears. Then it becomes tricky.
A pause, once a resistance level is reached, can result in only several days of consolidation later the market produces additional growth. So it is easy to buy at support and just hold, let the market take care of the rest. If the action is already happening, buying FOMO, a retrace or correction can show up the next day. It is better to look for the projects that are yet to move; don't chase a rising wave.
When resistance is reached, as $122 on SOLUSDT, there can be a retrace. Another tricky situation. A retrace can lasts 3-6 days just as it can last 14-21 days. It varies wildly. Then comes the correction.
The market can rise three months non-stop and everything looks great. Then the market turns red to start a retrace. Another situation that demands experience. The retrace can extend, market situations worsen and prices down go. Instead of a pause or short retrace, a multiple months correction shows up.
Once the correction starts to unravel it is already too late to sell. Taking profits should be anticipated. The sell orders should be set beforehand, before your expected target is hit.
Since the market is unpredictable and nobody knows for how long this bullish period can go for, make sure to secure profits when prices are up. Whenever one of your pairs grow 100%, 200%, 300%, etc., make sure to secure some gains. The only way to win is to sell higher than you bought. Selling produces a win, and a win will let you play again.
Secure profits on the way up and plan for the long-term. Aim high, but also prepare for all scenarios. Solana is set to move beyond $500 and likely much higher in the coming years. An easy target on this move is $200 and $290. Higher can be seen on the chart.
More on Solana & Crypto
Think truly of the long-term, Solana will have a price of $1,000 or even $2,000 in just a few short years.
How can you make the most out of this information?
What can be done now to benefit from the fact that you already know, the Cryptocurrency market is going up for the long run?
What type of actions can you take now, to secure big gains, big wins and profits during this bullish market phase?
The best is yet to come.
There are many ways to approach the market and there isn't even a need to trade. At this point in time, all that is needed is to buy and hold—just buy the pairs that you find fit your requirements, criteria and preferences.
Read daily what I share, as you read, the projects, strategy and choices that are right for you will come to the front, you will know with a 100% level of certainty when you've found the right one.
Take your time, the market is here to stay. There is no need to rush, opportunities are endless in this game. We went through a period that was rough, now we get to enjoy years of expansion and growth.
Thanks a lot for your continued support.
Namaste.
$SOL Doubled From My Entry Zone But I’m Still Targeting $1000CRYPTOCAP:SOL Just Doubled From My Entry Zone But I’m Still Targeting $500-$1000
CRYPTOCAP:SOL JUST DID IT. From The $60-$67 Accumulation Zone To $120.
That’s Already A 100%+ Move From Our Entry Zone.
Back In October 2025, I Told You:
CRYPTOCAP:SOL Could Crash Under $70-$50
Long-Term $500-$1000 Was Still Possible.
Now Look At It:
✅ $60 → $120 = 100% Gain
✅ CRYPTOCAP:SOL Reclaimed $120
✅ Those Who Accumulated The Fear Are Now In Profit
Hope You Enjoyed The Move And Caught The CRYPTOCAP:SOL Bottom.
But I’m Not Changing My Long-Term Targets.
Next Targets: $500 → $1000
The Market Rewards Patience.
TA Only. Not Financial Advice. ALWAYS DYOR.
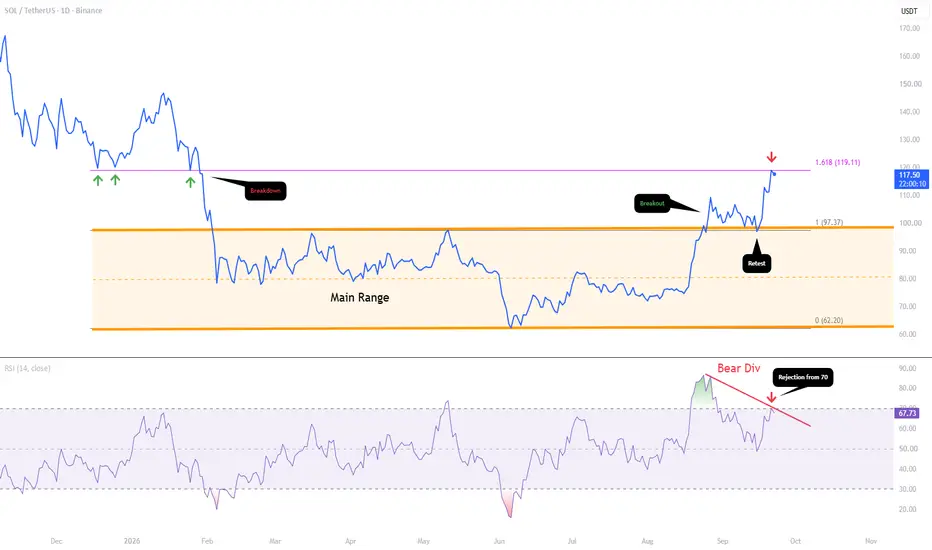
SOL - At Extremely Key Level Solana is arguably at its most important liquidity range this entire bear market. The reason for this is that the current price zone was the main support region during last cycle, and it will likely act as new resistance for the time being.
Why the $120 to $130 Range Matters
To understand why this range matters so much, look back at my post from 2024, and click play to see how price used this exact range as the liquidity range low before the final bull market leg of that cycle:
Since price broke below that range, it should act as a new resistance zone for the time being. I have outlined this on the current chart using the line chart, since it does a very good job of laying out this structure clearly.
Reviewing the Recent History
The last time Solana traded at this level was at the end of January 2026, right before it entered the main range I have outlined. SOL formed a low at this level on December 18, 2025, December 25, 2025, and January 25, 2026 (green arrows). Once SOL began closing daily candles below it, that kicked off the 50% breakdown that led to the eventual lows.
After that breakdown, SOL established its primary trading range from February 2026 through present day, outlined here with the orange parallel channel.
Once SOL broke out above that channel, it retest the top of old resistance as new support, and fueled the recent large breakout move to the upside.
Why This Matters Now
However, price has now reached this critical level around $120 once again. Since it was previously macro level support, it could act as new resistance for the time being. In addition to that, this is the 1.618 extension target of the swing high in May 2026 to the swing low in June 2026. I have this extension outlined based on candle closes, but if you prefer the target based on wicks, that would put it slightly higher around $122.
The Momentum Signal
Adding to this, the RSI gave a key signal at the recent high. Trend momentum is beginning to get rejected right off overbought conditions at 70. If momentum continues trailing to the downside, this would be a prime region for sellers to step back in and pull price back toward the downside. It would also create a bearish divergence on the daily timeframe, a higher high in price paired with a lower high on the RSI.
If a pullback does occur from here, the top of the parallel channel, just below $100, will be a very key level to keep an eye on for the bulls.
Once price is able to decisively close above the $120 it will be off to the races for Solana's bull market.
$SOL: Is This the Breakout Everyone Is Waiting For?CRYPTOCAP:SOL is now approaching a major 1W resistance around $120–$135, and this is the level I’m watching very closely.What makes this interesting is the bigger structure. After the deep correction, SOL has formed a large rounded recovery/base, and price is now pushing back into the same resistance zone that previously caused strong rejection.
So I’m not calling the breakout yet.If SOL gets a clean weekly breakout + confirmation above the zone, the next major areas on my chart are around $175–$185 and then $240–$250.
But if price gets rejected here again, I’ll be watching how it reacts around the current structure before considering the next move.
For me, $120–$135 is the level to watch.
SOL/USDT — Small Update. SOL/USDT — Small Update.
SOL is testing the $120–$122 resistance zone with positive momentum.
Resistance: $122–$125
Support: $115–$117
Above $125 → momentum can strengthen.
Below $115 → short-term pullback risk increases.
Key: Watch for a clean breakout and sustained hold above $122.
DYOR | NFA
SOL/USDT Technical Analysis (2H) | Ichimoku + Market Structure# 🚀 SOL/USDT Technical Analysis (2H) | Ichimoku + Market Structure
🟢 **Pair:** SOL/USDT
⏰ **Timeframe:** 2 Hours
📊 **Indicators:** Ichimoku Cloud (9,26,52), Trendline, Support/Resistance
💰 **Current Price Area:** ~$121
---
## 📈 Market Structure Overview
SOL remains in a **strong bullish trend** after breaking out from a descending channel and establishing a series of **higher highs and higher lows**.
✅ Price is trading **above the Ichimoku Cloud**
✅ Bullish trendline remains intact
✅ Previous resistance has turned into support
✅ Buyers continue defending pullback zones
This indicates that momentum is still favoring the upside as long as key support levels hold.
---
## 🟨 Key Support Zones
🔹 **Primary Support:** **114–116 USDT**
* Previous breakout zone
* Strong reaction area
* Cloud support alignment
🔹 **Secondary Support:** **119–120 USDT**
* Short-term pullback area
* Near Tenkan/Kijun support
🔹 **Major Structural Support:** **95–96 USDT**
* Long-term invalidation level
---
## ☁️ Ichimoku Analysis
🟢 Price is above the cloud → Bullish bias
🟢 Future cloud remains green → Positive momentum
🟢 Tenkan-Sen above Kijun-Sen → Trend continuation signal
As long as SOL stays above the cloud, buyers maintain market control.
---
## 🎯 Resistance & Targets
📍 **Immediate Resistance:** 122–123 USDT
If price breaks and closes above this zone:
🎯 Target 1: **124–125 USDT**
🎯 Target 2: **126–128 USDT**
---
## 🔄 Possible Scenario
📌 A healthy retracement toward **119–120 USDT** could provide support before continuation.
➡️ Holding above support may lead to another upward move toward the **126–128 USDT** area.
❌ Losing the **114–116 USDT** zone would weaken short-term momentum and could trigger a deeper correction.
---
## 🧠 Trading View Style Summary
🚀 **Trend:** Bullish
☁️ **Ichimoku:** Positive
📈 **Structure:** Higher Highs & Higher Lows
🛡️ **Support:** 119–120 / 114–116
🎯 **Targets:** 124 → 126 → 128
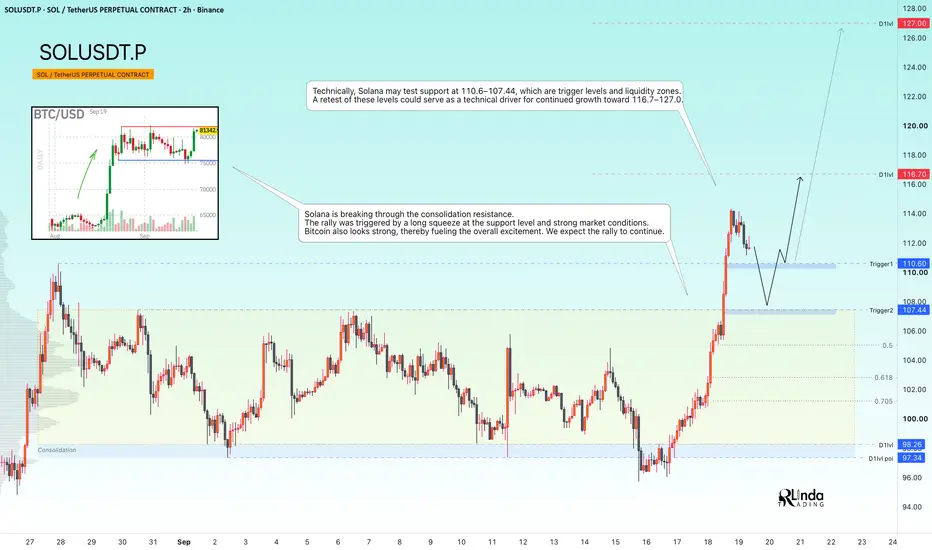
SOLUSDT - A hunt for liquidity ahead of the rally's continuationBINANCE:SOLUSDT confirms its bullish market structure. The long squeeze of support that we expected in the previous analysis played out perfectly. The bulls quickly took control of the situation and strengthened their positions...
Previously, we discussed how the market turned out to be stronger than expected: Bitcoin showed virtually no reaction to higher interest rates, the Fed’s hawkish stance, or the fact that the CLARITY Act was not passed. Consolidation continued, which further confirmed the strength of the market.
As for Solana, the altcoin is breaking through the consolidation resistance, suggesting that the coin is ready to continue its move higher. The rally was triggered by a long squeeze of support and the overall strength of the market
Resistance levels: 116.7, 127.0
Support levels: 110.6, 107. 44
Technically, Solana could retest the 110.6–107.44 support zone, which represents both key triggers and liquidity areas. A retest of these levels could become a technical catalyst for further upside toward 116.7–127.0
Best regards,
R. Linda!
SOLUSDT Bullish Breakout – Buy Setup#SOL
The price is moving within a descending channel on the 1-hour timeframe; it has reached the lower boundary and appears poised for a rebound. A retest of this boundary is expected, supporting an upward move.
The Relative Strength Index (RSI) indicates a bearish trend, but an upward breakout is likely due to oversold conditions on the 1-hour chart.
An orange trend line supports the potential upward rebound.
There is initial support at 103.23, acting as a primary support zone.
A key support zone (marked in green) exists at 98.50; the price has rebounded from this area multiple times, making it a strong support level.
The price is moving toward the 100-period moving average—a level we are currently approaching—which supports a rise.
Entry Price: 118.96
Target 1: 121.37
Target 2: 124.25
Target 3: 127.68
Stop Loss: At the green resistance zone.
Remember this simple rule: Capital management.
If you have any questions, please leave a comment.
Thank you.