SPACEUSDT Forming Bullish MomentumSPACEUSDT is forming a clear bullish momentum pattern, a classic bullish wave signal that often indicates an upcoming breakout. The price has been consolidating within a narrowing range, suggesting that selling pressure is weakening while buyers are beginning to regain control. With consistent volume confirming accumulation at lower levels, the setup hints at a potential bullish breakout soon. The projected move could lead to an impressive gain of around 90% to 100% once the price breaks above the wedge resistance.
This bullish momentum pattern is typically seen at the end of downtrends or corrective phases, and it represents a potential shift in market sentiment from bearish to bullish. Traders closely watching SPACEUSDT are noting the strengthening momentum as it nears a breakout zone. The strong trading volume adds confidence to this pattern, showing that market participants are positioning early in anticipation of a reversal.
Investors’ growing interest in SPACEUSDT reflects rising confidence in the project's long-term fundamentals and current technical strength. If the breakout confirms with sustained volume, this could mark the start of a fresh bullish leg. The current market structure suggests that buyers are steadily gaining control while bearish pressure continues to weaken.
Traders might find this a valuable setup for medium-term gains, especially as the bullish momentum pattern completes and buying momentum accelerates. A successful breakout could attract additional attention from market participants and potentially push the price toward significantly higher levels over the coming weeks.
✅ Show your support by hitting the like button!
✅ Leaving a comment below! (What is your opinion about this Coin?)
Your feedback and engagement keep me inspired to share more insightful market analysis with you!
Spacecoin / Tether
No trades
No trades
In-depth trading ideas
SPACEUSDT 1D#SPACE is moving inside a symmetrical triangle on the daily chart.
Entry should be considered only after a confirmed breakout above both the Ichimoku Cloud and the triangle resistance.
If breakout is confirmed, the following upside targets could come into play:
🎯 $0.009134
🎯 $0.010539
🎯 $0.011943
🎯 $0.013942
🎯 $0.016488
🎯 $0.019725
🎯 $0.021414
🎯 $0.023842
⚠️ Always remember to use a tight stop-loss and maintain proper risk management.
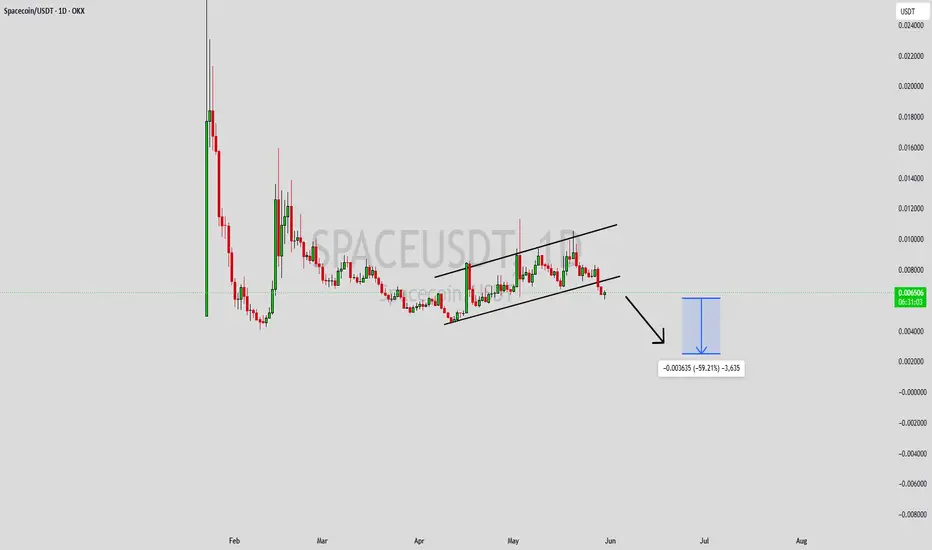
SPACEUSDT Forming Ascending ChannelSPACEUSDT is forming a clear ascending channel pattern, a classic bullish wave signal that often indicates an upcoming breakout. The price has been moving steadily within an upward-sloping channel, suggesting that buyers are maintaining control while the market continues to print higher highs and higher lows. With consistent volume confirming accumulation at lower levels, the setup hints at a potential bullish breakout soon. The projected move could lead to an impressive gain of around 40% to 50% once the price breaks above the channel resistance.
This ascending channel pattern is typically seen during strong bullish trends or corrective phases before continuation, and it represents sustained buying interest in the market. Traders closely watching SPACEUSDT are noting the strengthening momentum as it nears a breakout zone. The good trading volume adds confidence to this pattern, showing that market participants are positioning early in anticipation of a larger upward move.
Investors’ growing interest in SPACEUSDT reflects rising confidence in the project’s long-term fundamentals and current technical strength. If the breakout confirms with sustained volume, this could mark the start of a fresh bullish leg. Traders might find this a valuable setup for medium-term gains, especially as the channel pattern matures and buying momentum accelerates.
✅ Show your support by hitting the like button and
✅ Leaving a comment below! (What is your opinion about this coin?)
Your feedback and engagement keep me inspired to share more insightful market analysis with you!
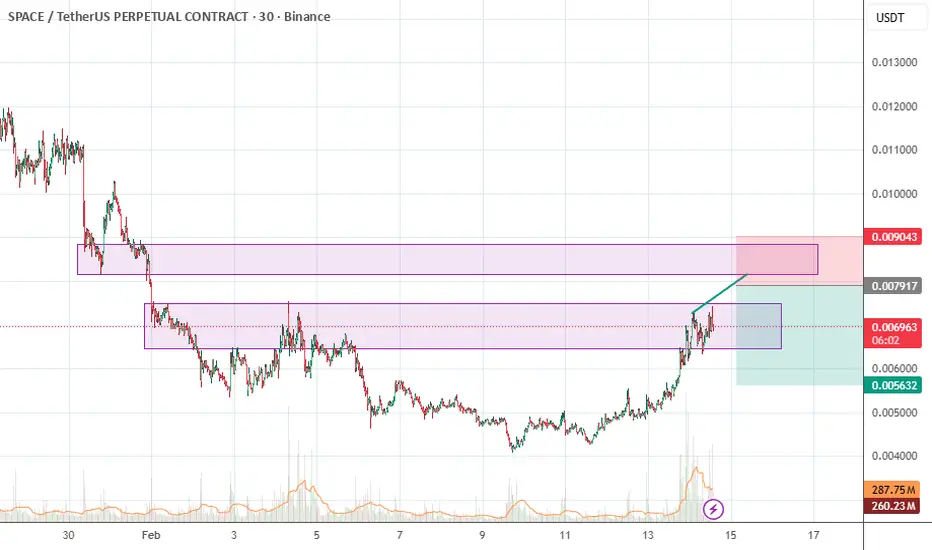
spaceusdt long Roddy01-signalsproviderInstructions:
Entry point: yellow
Stop loss: red
Take profit: green
👉Leverage x 5-10-20 for crypto
👉Leverage x 20-50-100 for commodities, stocks, indices, and forex
👉Margin 1-5% max.
Always practice risk and money management.
Invest a maximum of 5% on any trade or across all your trades.
Invest only what you can afford to lose, as no one is in control of the market.
👉Our analyses are primarily based on:
breakouts: two trend lines (ascending and descending) and a line indicating a horizontal breakout.
chart patterns: shoulders and head, triangle parttern, elliott impulse, etc etc.
We don't always have the time to track them at all times or to represent them visibly, given the numerous signals, the number of channels to manage, and especially because of the often rapid pace of market movements.
indicators: We associate at least two indicators with this technique.
👉Depending on the circumstances, we use specific indicators, often setting 3 or more take profit levels.
👉Indeed, there are good days in trading and also bad days. No one can promise to win every trade, and like all traders worldwide, we also experience stop-loss orders. However, we win more than we lose and remain positive.
👉You can close the position before or after the take profit orders indicated by the green lines if you are personally satisfied; the same applies to stop loss orders.
👉We must stay positive, clear-headed, and humble.
we cannot provide all instructions or all trades here on this channel.
Good luck to us all, and may God guide us. Amen.
spaceusdt trading opportunitySPACEUSDT initially formed a rising wedge upon listing, which broke down as the price trended downward until reaching $0.645 a potential temporary bottom, confirmed by a double bottom pattern signaling reversal. This level is expected to hold, with immediate resistance at $2.1. A break above $2.1 could open significant upside potential.
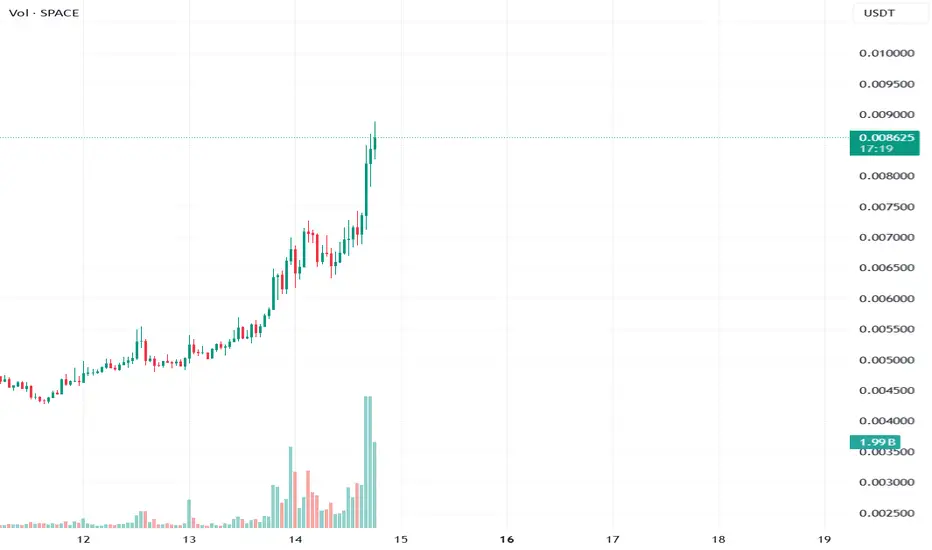
SPACE/USDT: 41% Parabolic Bounce With Shorts Getting LiquidatedSPACE/USDT: 41% Parabolic Bounce With Shorts Getting Liquidated — But Futures Speculation Is Driving the Bus
Overview
SPACEUSDT is in full parabolic mode. A 41.3% bounce at 17.1x magnitude, a Deep BULL bias at 62.96% with an 81:19 directional split, 13:1 candlestick dominance, a price squeeze that just fired, and shorts actively getting liquidated. On the surface, this looks like an unstoppable freight train. But underneath the price action, the volume structure reveals a critical vulnerability: futures speculation is running at 10.49x spot activity, the futures Z-score is at 2.62σ (Very High) while spot is a flat -0.41σ, and the premium is volatile and unstable. This is a leveraged momentum event with real liquidation fuel — powerful but fragile.
Price Structure
Spot trades at 0.008762 with futures at 0.008744 — a -0.22% backwardation with a Z-score of -1.6. This is a meaningful premium reading. The negative Z-score at -1.6σ means futures are trading below spot by a statistically significant margin, which in a parabolic rally typically indicates heavy short positioning being squeezed — consistent with the active shorts liquidation detected on the chart.
The premium standard deviation is at 0.11%, classified as Volatile on both short and long lookbacks. This is important context: the basis between spot and futures is not just wide but unstable, swinging rapidly. Volatile premium during a parabolic move signals aggressive repositioning in the derivatives market.
The mean Z sits at 0.02σ — essentially at its historical norm. Despite the -1.6 Z-score on the premium itself, the mean reversion metric hasn't drifted far. This suggests the backwardation is a temporary dislocation driven by the liquidation event rather than a structural shift.
Yield reads -238% APY at -1.6σ — an extreme reading that screams bullish from a funding perspective. At this yield level, the cost of holding a short position is enormous, which creates additional upward pressure as shorts are forced to cover.
The bounce at 41.3% with 17.1x magnitude is classified as Parabolic. The retrace is -2.4%, which is remarkably shallow for a move of this size. Price is sitting in a demand zone. The combination of a parabolic bounce, shallow retrace, and active liquidation creates a self-reinforcing feedback loop — rising price forces shorts to cover, which pushes price higher, which forces more shorts to cover.
Multi-Timeframe Directional Bias
The bias reads Deep BULL (62.96%) — the strongest classification — with an 81% bull : 19% bear split. Total signal count: 47 bull : 17 bear out of 122 evaluated. The spread is 46.9%, classified as Strong. Clarity at 48% reflects the volatile nature of the move rather than signal disagreement.
Close vs Tenkan: 11:3 — decisively bullish. Price is closing above the Tenkan-sen on the vast majority of timeframes.
The component breakdown is overwhelmingly one-sided:
EMA alignment: 5:3 bullish. The trend structure has turned. Moving averages are now favoring buyers on the majority of timeframes — a lagging confirmation that the parabolic move has begun to reshape the broader trend.
Ichimoku TK crosses: 10:3 bullish. Near-total dominance. The cloud structure across timeframes is firmly in bull territory.
Candlestick patterns: 13:1 bullish. This is an extreme reading. On 13 out of 14 timeframes producing signals, the candle structure favors bulls. One bearish signal exists in isolation.
Pattern detail: 4 bullish 3-soldier patterns, 0 bearish. 1 bullish engulfing, 0 bearish. Pattern total: 4:0. Four separate timeframes are printing 3-soldier patterns — the most aggressive bullish continuation pattern. This is not a single-timeframe anomaly; it's a synchronized bullish cascade across the timeframe spectrum.
The price squeeze has FIRED with bandwidth at 35.56% — this is an already-expanded reading, confirming the squeeze resolved into the parabolic move. Momentum reads Bull ↑ (bullish and rising). The squeeze fire, parabolic expansion, and rising momentum are all aligned.
Zero bearish reversal patterns. Zero stars, zero harami. The bear case has no candlestick structure to lean on.
Volume Intelligence — The Structural Vulnerability
This is where the picture gets more complex.
Spot Z-score: -0.41 (Steady — slightly below average, unremarkable)
Futures Z-score: 2.62 (Very High — extreme, nearly 3 standard deviations above mean)
Combined Z-score: 0.57 (Active — pulled up entirely by futures)
Futures-to-Spot ratio: 10.49x — classified as High.
The market is classified as Futures Speculative. The dollar volumes tell the story: spot is running at $14.98M while futures sits at $157.06M. The futures market is generating over 10x the dollar volume of spot.
This isn't in the manipulation territory we sometimes see (100x+), but 10.49x with a High classification means the price move is predominantly driven by derivatives speculation rather than spot accumulation. The parabolic bounce is being fueled by leverage, not real buying of the underlying asset.
Bull:Bear volume Z-scores read 1.21 : -0.59. This is the one positive note in the volume structure — bullish volume is running above average (1.21σ) while bearish volume is suppressed (-0.59σ). The bulls that are participating are doing so with conviction, even if most of that conviction lives in the futures market.
Volume momentum is at -0.05 and falling — barely negative, but the declining trajectory suggests the speculative fervor may be peaking rather than building. Volume direction is Neutral despite the parabolic price move.
The liquidation map shows active Shorts Liquidation. This is the fuel source for the rally. As price pushes higher, short positions hit their liquidation levels, triggering forced buying that accelerates the move. The -238% APY yield and -1.6 Z-score premium confirm that shorts are under extreme pressure.
No volume squeeze on either spot or futures — the expansion is already underway. Squeeze momentum is expanding at 158.6% on the downside (contracting from previous squeeze levels), which is normal during a breakout phase.
No whale activity detected. The ceiling sits at 15.78σ — ample room for further volume expansion.
Supply/Demand Context
There are 7 supply zones overhead versus 3 demand zones below. The current price sits in a demand zone. The 7:3 ratio means resistance exists above, but the parabolic momentum and active liquidations have the potential to punch through supply zones rapidly — liquidation cascades don't respect technical resistance the way organic selling does.
The Core Analysis
This setup has a clear narrative: a legitimately powerful directional move (Deep BULL, 81:19, 13:1 candles, 4 three-soldiers, squeeze fired, shorts liquidating) that is structurally dependent on leveraged speculation (10.49x F/S ratio, futures at 2.62σ vs spot at -0.41σ, Futures Speculative classification).
The bullish case is supported by everything visible on the chart — bias, patterns, momentum, price squeeze, premium yield, liquidation pressure. It's one of the strongest multi-timeframe directional readings possible.
The risk is entirely structural. When a 41% parabolic move is backed by 10.49x futures-to-spot leverage rather than spot accumulation, the sustainability question isn't about direction — it's about what happens when the liquidation fuel runs out. Once the shorts have been cleared, the buying pressure from forced covering evaporates, and the market needs real spot demand to sustain the elevated price level. With spot Z at -0.41 (below average), that demand isn't evident yet.
Volatile premium (0.11% StdDev on both lookbacks) adds another layer of risk — the basis is swinging rapidly, which means the derivatives market is in a state of flux. Volatile premium during a parabolic move often precedes a premium normalization event, which can coincide with price retracement.
Scenarios
Scenario 1 — Liquidation Cascade Continues, Price Extends (~40% probability):
The shorts liquidation event hasn't fully cleared. More short positions hit their stops at higher price levels, creating a cascading effect that drives price through supply zones. The -238% APY yield makes holding shorts prohibitively expensive, forcing remaining bears to capitulate. Spot volume eventually follows (Z climbing from -0.41 toward 0.5+), validating the move. The 4 three-soldier patterns across timeframes prove correct as continuation signals. The parabolic structure extends before eventually exhausting.
Key confirmation: Spot Z climbing above 0 (real buyers entering), the F/S ratio compressing below 8x (spot catching up), and premium StdDev declining from Volatile toward Normal (basis stabilizing).
Scenario 2 — Liquidation Fuel Exhausts, Sharp Retracement (~35% probability):
The shorts get fully liquidated — the fuel runs out. With spot volume running below average (-0.41σ) and the entire move backed by 10.49x futures leverage, there are insufficient real buyers to hold the elevated price. Premium volatility (0.11%) triggers a normalization event. The 41% parabolic bounce retraces 30-50% of its range in a rapid correction as the leveraged structure unwinds. Futures Z collapses from 2.62σ as speculative positions close. The 3 demand zones below provide stepping stones for the correction, but the violence of a leverage unwind can blow through multiple zones.
Key warning: Futures Z declining while spot Z stays flat or falls — this is the leverage exiting. Volume momentum (-0.05, already falling) accelerating to the downside. Premium Z-score (-1.6) snapping back toward 0 rapidly.
Scenario 3 — Transition From Speculative to Structural (~25% probability):
The best-case outcome for bulls. The parabolic phase ends with a controlled consolidation rather than a sharp reversal. Spot volume gradually enters (Z climbing from -0.41 toward Average), the F/S ratio normalizes from 10.49x toward a healthier 4-6x range, and premium StdDev settles from Volatile to Normal. Price gives back 10-15% of the move but holds above key demand, establishing a new structural base. The Deep BULL bias (81:19) and 13:1 candle structure provide the foundation for a more sustainable continuation at a later stage.
Key indicator: F/S ratio declining gradually (not collapsing) while price retraces modestly. Premium StdDev moving from Volatile to Normal over multiple sessions. Spot Z climbing even as futures Z declines — a handoff from speculation to accumulation.
What to Watch
Primary trigger: The shorts liquidation status. When the "Shorts Liq" signal clears, the forced buying pressure disappears. What price does immediately after liquidations clear is the single most telling signal. If it holds — Scenario 1 or 3. If it drops — Scenario 2.
Spot participation: The Spot Z at -0.41 is the structural weak link. A parabolic move needs real buyers to sustain. Watch for Spot Z to cross above 0 — that's the signal that spot demand is validating the futures-driven move.
Premium stability: The volatile StdDev (0.11% on both lookbacks) needs to settle. Declining premium volatility alongside stable price = the market is finding equilibrium. Increasing premium volatility = more instability ahead.
F/S Ratio trajectory: 10.49x is High but not Manipulation level. If it compresses toward 6x with price holding, the structure is improving. If it climbs above 15x, the speculative excess is worsening.
Volume momentum: Currently -0.05 and falling. This needs to stabilize or turn positive for the move to sustain. A deepening decline in volume momentum during a parabolic move = the participation peak has passed.
Risk Note
A 41% parabolic bounce driven by 10.49x futures leverage, active shorts liquidation, -238% APY yield, volatile premium, and below-average spot participation creates a high-reward but structurally fragile setup. The directional signals are among the strongest possible (Deep BULL, 81:19, 13:1 candles, 4 three-soldiers), but the volume microstructure reveals that this move is built on derivatives speculation and forced liquidation rather than organic spot demand. Parabolic moves end — the question is whether they transition or collapse. Position sizing should account for the leveraged fragility, and risk management is critical during active liquidation events. Educational analysis only — not financial advice.
TAGS
SPACE SPACEUSDT Volume Analysis Squeeze Technical Analysis Supply and Demand Multi-Timeframe Analysis Crypto Futures Liquidation
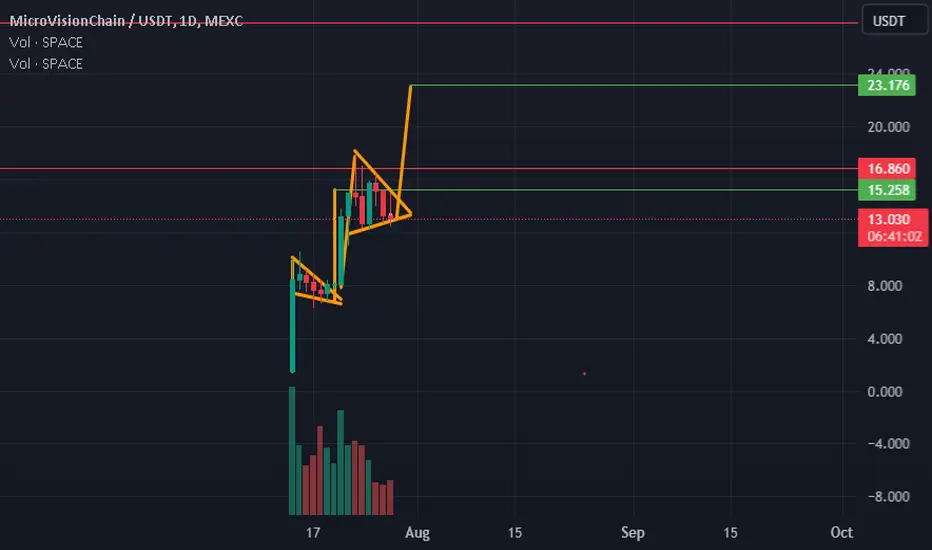
SPACE medium term planTrading in a range between range high at 18 and 12-10 as range lows, 2 scenarios:
is that we get one or more stabs into demand 10-12 area and we go for the liquidity at range highs 18 where we either go for higher targets or dump back down (depends very much on BTC and overall crypto env.) - green scenario
or we get lower and tap into demand area around 8-7$ where I think there is enough demand to make a longer term low - blue scenario
in case we get green than red scenario would be more probable than if we get blue, case in which red scenario would be lower chance