S&P500 Is it about to correct to 7000 minimum?The S&P500 index (SPX) has turned into a sideways consolidation for almost 2 months, putting a stop to the relentless 9 straight green weeks rally that preceded it. At the same time, the 1W RSI has been falling under Lower Highs pressure.
Every time we saw this RSI pattern since late 2021, the index always corrected. The first two times (2022 and 2025), it corrected to the 0.5 Fibonacci retracement level and the 1W MA200 (orange trend-line). The most recent (March 2026) it 'only' breached the 1W MA50 (blue trend-line).
If repeated, S&P500 could break again its 1W MA50 and hit the 0.5 Fib level from the March Low at 7000. Based on that pattern that is the minimum long-term Target. If however we ignore the Jan - March 2026 correction and we are in a wider pattern since the April 2025 Low, the 0.5 Fib would be located at 6250, which would again make the index approach its 1W MA200. Basically that lower target (6250) would be justified only if we get trend continuation confirmation by closing a weekly candle below the 1W MA100 (green trend-line).
In any case, if the 1W RSI enters its 4-year Buy Zone regardless of the price S&P500 will be at that time, it would be at the best interest for long-term investors to start buying again.
---
** Please LIKE 👍, FOLLOW ✅, SHARE 🙌 and COMMENT ✍ if you enjoy this idea! Also share your ideas and charts in the comments section below! This is best way to keep it relevant, support us, keep the content here free and allow the idea to reach as many people as possible. **
---
💸💸💸💸💸💸
👇 👇 👇 👇 👇 👇
SP 500 Cash Index / US Dollar
No trades
No trades
In-depth trading ideas
S&P500 INDEX (US/500): Your Trading Plan ExplainedThe ⚠️S&P500 index is currently testing a horizontal structure that was recently breached. It is highly probable that this level has now become support.
For a confirmed buying opportunity, please observe the formation of a double bottom pattern on the 4-hour chart.
Should the price break and close above 7521, this would provide strong bullish confirmation.
In such a scenario, the market is anticipated to advance to at least the 7584 level.
Conversely, if the price declines and establishes a new lower low, this trading setup would no longer be valid.
Into The RealmLast time I wrote to you,
I shared my view that the US Stock Market,
as measured by the S+P 500, was about to enter a new price adjustment realm.
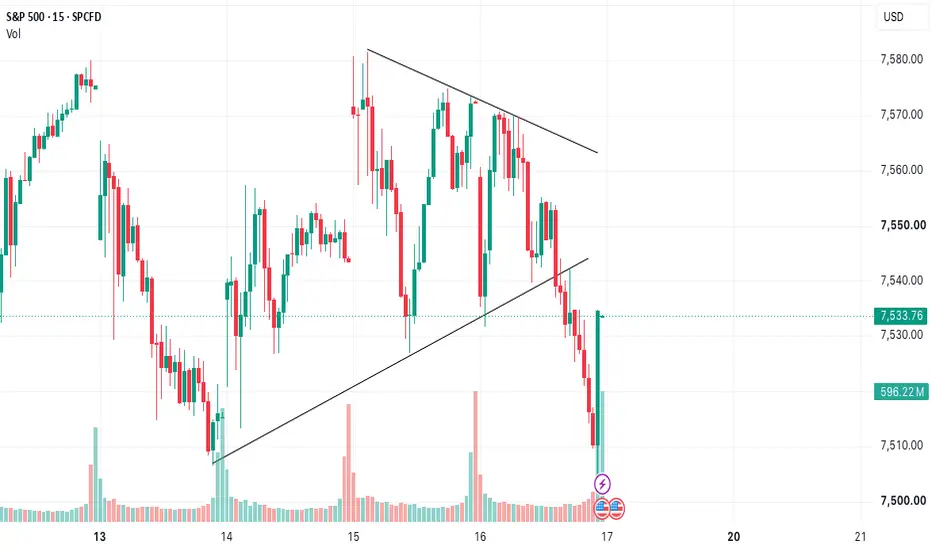
Volume has entered the market today, on the downside
with a gap down opening to awaken that realization
You must respect the move down below SPX 7500 Support.
This is just the beginning.
The massive Trillion Dollar A-I Bubble, must ultimately be deflated
THE_UNWIND
WOODS OF CONNECTICUT
7/23/26
Developing Violent Stock Market TopThe US stock market as viewed by the S+P 500 Index,
is in a final stages of advance this summer
leading to a violent stock market top, and rollover.
The final top, as I am calling it,
will not let bullish traders out.
Capitulation will be the only way to the exit.
Panic will ultimately replace optimism.
It's the other side of the coin, the dark side
that you are going to witness.
Stay vigilant, and ready to pull the trigger.
The breakdown has already begun.
Once the shock hits the market, it will be too late to act
More on this throughout the summer and fall.
Until next time...
THE_UNWIND
WOODS OF CONNECTICUT
July 17,2026.
S&P 500 — When the Data Speaks and the Crowd Doesn't ListenThe Setup in One Paragraph
The US market is simultaneously carrying the second-highest valuation reading in 155 years of recorded history AND the calmest fear gauge in recent memory. CAPE at 41.37. VIX at 16.6. Those two numbers sitting together — in 20 years of weekly back-test data — have produced a 100% negative 12-month forward return rate across every completed historical observation. The one force preventing an immediate breakdown is Federal Reserve Net Liquidity at $5.92 trillion, which has historically been associated with zero negative 12-month outcomes. Two perfectly opposing forces. That tension is the market you are trading right now.
Valuation: Second Highest in 155 Years
The Shiller CAPE ratio measures stock prices against the average of the last 10 years of real earnings — smoothing out single-year distortions. At 41.37 , the current reading has been exceeded only once in recorded history: the dot-com peak of the late 1990s, when CAPE reached approximately 44.
The previous time CAPE crossed 38 — late 2021 — the S&P 500 fell approximately 26% over the following year.
In the 20-year back-test covering 1,057 weekly observations, the CAPE>38 bucket has 9 completed 12-month observations . All 9 are negative. Average: − 16.1% . The remaining CAPE>38 observations from 2025–2026 do not yet have completed 12-month forward data. The verdict is still being written.
VIX at 16.6: Calm at the Wrong Moment
VIX at 16.6 means the options market is pricing near-term serenity. No one is buying protection. The crowd is comfortable.
Historically, VIX below 18 is not dangerous in isolation. But combined with CAPE above 38, the 20-year data produces the single worst configuration in the back-test:
CAPE > 38 + VIX < 18 → 100% negative 12-month rate (9/9 completed observations, avg −16.1%)
The market is calm precisely when the structural data says it should not be. That divergence between surface sentiment and structural reality is the clearest signal in the dataset.
The One Bullish Force: Net Liquidity at $5.92T
Honest analysis requires acknowledging what is working in the bull's favour.
Federal Reserve Net Liquidity (Fed balance sheet minus Treasury cash account minus Reverse Repo) stands at $5.92 trillion . In the 20-year back-test, every observation of Net Liquidity between $5.5T and $6.5T produced a positive 12-month return. 133 observations. Zero negative outcomes.
Liquidity is the master valve. It is why the market has stayed elevated despite extreme valuation. It is the floor under the current S3 cyclical bull phase.
But the floor is not permanent. If Net Liquidity falls below $5.5T — recent weeks have seen modest decline from the $5.987T cycle high — the zero-negative-outcome protection disappears. And with CAPE at 41.37, there is no valuation cushion to catch the fall.
Watch $5.5T Net Liquidity as the primary swing variable.
Rate Pressure: Two Signals Building Quietly
DGS10 at 4.67% — The 10-year Treasury yield has crossed the S4 Forming threshold of 4.5% and is rising. At 4.67%, the risk-free rate is mechanically compressing equity multiples. With CAPE built on a decade of near-zero rate assumptions, the PE compression arithmetic is severe even if the market hasn't priced it yet.
T10Y2Y at +0.36% — The yield curve re-steepened from its October 2023 inversion low of −1.08%, deeper than both the 2000 and 2007 inversions. Historical precedent:
2001: inverted −0.65% → re-steepened → S&P −37%
2007: inverted −0.77% → re-steepened → S&P −52%
2026: inverted −1.08% → now +0.36% and rising
Re-steepening from a deep inversion is not relief. It is historically the signal that damage is flowing through the real economy while equity markets remain calm.
In the 20-year back-test, the 0% to +0.25% re-steepening zone produced 100% negative 3-year outcomes . The current +0.36% reading has moved past that zone — but the trajectory remains the key watch variable.
Dow Theory: Partial Non-Confirmation
DJIA is at all-time highs. DJTA — the Transportation Average, the real economy's report card — recently recovered but remains in a pattern of lower conviction relative to the Industrials.
By strict Dow Theory, both averages must confirm simultaneously for a full bull signal. When Industrials make new highs and Transports lag, it signals that financial markets are running ahead of economic activity. This has been an early warning at every major market turn in Dow Theory's recorded history.
The Dow Theory flag is not yet a bear confirmation. It is the classical early warning of S3 weakening.
Buffett Indicator: 173%
Total US market capitalisation divided by GDP: 173%. Historical fair value: approximately 100%. Every percentage point above 100 represents borrowed return — valuation expansion that must eventually mean-revert through price decline, earnings growth, or time.
Returning to CAPE 25 (still elevated historically) from the current 41.37 would require approximately 39% price compression assuming flat earnings. These are not price targets. They are the arithmetic of where current prices sit relative to 155 years of mean.
Three Active Warning Flags Simultaneously
For the first time in this analytical framework's history, three structural warning flags are simultaneously live:
🔴 DGS10 above 4.5% and rising — S4 Forming signal, third consecutive week above threshold
🔴 T10Y2Y re-steepening from historic inversion — Watch zone active, +0.36% and rising
🟡 Dow Theory partial non-confirmation — DJIA at ATH, DJTA showing lower conviction
The Honest Conclusion
The data is clear: by every structural metric tested across 20 years and 1,057 weekly observations, this market is in a bubble zone. CAPE at second-highest in 155 years. Buffett Indicator at 173%. Three simultaneous active flags. The single most dangerous CAPE×VIX configuration in the back-test is the current one.
And yet.
Markets do not make tops because the data says so. They have been at extreme readings before and kept going — for months, sometimes years — while the data-aware sold too early and the crowd kept buying.
Markets make tops when the last available buyer has bought.
When the AI narrative has pulled in every last sceptic. When the institutional holdout finally capitulates. When the retail investor who waited through the correction decides this time is different. When the universe of potential buyers is fully deployed, fully invested, and fully convinced — and there is no one left to sell to.
At that precise moment, not one week before and not one week after, the market turns. With complete mechanical indifference to the CAPE ratio, the VIX level, or the yield curve shape.
The data tells us where we sit on the probability distribution. Net Liquidity at $5.92T tells us the floor is holding. CAPE at 41.37 with VIX at 16.6 tells us the structural risk is as high as it has been in 20 years of data.
The question is not whether the market is in a bubble zone. It is. The question is who the last buyer is, and when they arrive.
Based on a 20-year systematic back-test of 1,057 weekly observations across 7 US market variables. Not investment advice. The framework reads probabilities — it does not predict.
SPX500 at a Decision Point: Bullish Continuation or BreakdownSPX500 is trading near a major decision zone after rejecting from the 7,532–7,545 resistance area and pulling back toward the rising trendline, EMA cluster, and prior value zone.
The broader structure remains constructive, but the latest rejection shows that buyers have not yet regained full control. Price is now compressed between descending resistance and rising support, creating a scenario where the next confirmed break could determine the next meaningful directional move.
This is not a prediction. It is a two-sided roadmap based on confirmation.
Bullish Scenario
The bullish structure remains valid while price continues to defend the 7,420–7,430 support zone.
For buyers to regain control, SPX500 needs to reclaim the pivot and EMA region around:
7,462–7,480
A decisive close above this area would indicate that the recent selloff was likely a liquidity sweep or bear trap rather than the beginning of a larger breakdown.
Bullish confirmation
Price holds 7,420–7,430
Reclaims 7,462–7,480
Breaks and closes above the descending trendline
Follow-through volume expands on the breakout
Bullish targets
7,532–7,545
7,580
7,620–7,660
The most important test remains 7,532–7,545. A rejection from that area would keep SPX500 trapped inside the broader consolidation. Acceptance above it would materially improve the probability of continuation toward the prior high and the 7,620–7,660 extension zone.
Bearish Scenario
The bearish scenario becomes more credible if buyers fail to reclaim 7,462–7,480 and price continues forming lower highs beneath the descending resistance line.
The critical confirmation level is:
7,420–7,430
A daily close below this zone would represent a loss of the rising support structure and could trigger additional selling as trapped longs begin exiting.
Bearish confirmation
Price rejects from 7,462–7,480
Forms a lower high beneath resistance
Breaks and closes below 7,420
A failed retest of 7,420–7,430 confirms support has become resistance
Bearish targets
7,365–7,375
7,318–7,336
7,264 if selling accelerates
The 7,318–7,336 region is the major higher-timeframe support area. A move into that zone would still be a correction within the broader bullish structure unless price begins accepting below it.
Volume and Momentum Warning
The current cockpit reading shows a bullish structural bias, but the flow data is less convincing:
CVD proxy divergence
Extremely weak relative volume
Mixed EMA alignment
Price rejecting near resistance
That combination supports patience. A breakout without volume may fail, while a breakdown on expanding selling volume would carry more significance.
Trading Plan
Long setup
Wait for price to reclaim and close above 7,480, preferably followed by a successful retest. Initial target is 7,532, with continuation potential toward 7,620–7,660.
Short setup
Wait for a confirmed close below 7,420, followed by a weak bounce or failed retest. Initial target is 7,365, followed by 7,318.
No-trade zone
Between 7,430 and 7,480, price remains inside the decision area. This is where false breaks and whipsaws are most likely.
SPX500 H4: Uptrend Holds Above Key SupportMarket Outlook:
SPX500 continues to maintain its bullish H4 structure, with price holding above the ascending trendline and consistently forming higher lows. The 7,460 area is acting as the nearest support, while 7,560 remains the key resistance level that must be cleared for the uptrend to extend.
Trading Bias:
The preferred scenario is to look for Buy opportunities if SPX500 continues to hold above 7,460 and prints a clear bullish confirmation signal. If confirmed, the index could move higher to retest 7,560, with the next upside target around 7,650.
Invalidation:
The bullish outlook will be invalidated if price breaks below the ascending trendline and an H4 candle closes decisively beneath the 7,440–7,460 support zone.
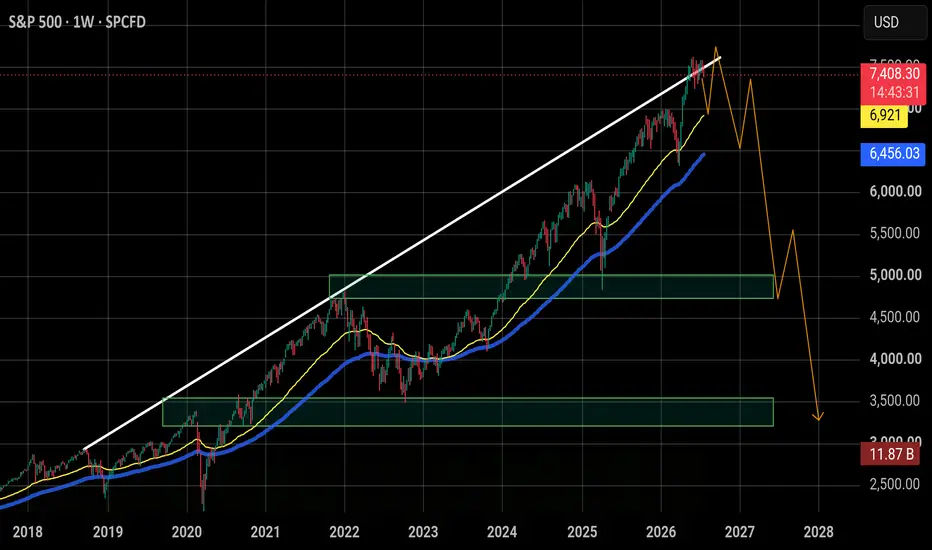
I'm still bearish on the S&P 500. This rally has been impressivI'm still bearish on the S&P 500.
This rally has been impressive, but we're now running into a major long-term resistance area. For me, this isn't a place to get excited about buying.
Everyone knows this is nothing more than a fake pump.
Smart money sells into euphoria. Retail buys after the move.
Chasing longs at these levels, right below major resistance, is exactly how people get trapped. I think the risk is still to the downside. I'm watching 4,800–5,000 as the first key support, and if that fails, a move toward 3,300–3,500 wouldn't surprise me.
I could be wrong, and the market will decide. But based on the current structure, I'm staying bearish until the chart gives me a reason to change my mind. 📉
Continued selling is likelyYesterday was a short opportunity, especially on tech which is out selling the general market and should continue to do so. The tricks and traps I was mentioning over last weekend and Monday looks to be over and we should have continued selling into Friday and probably next week.
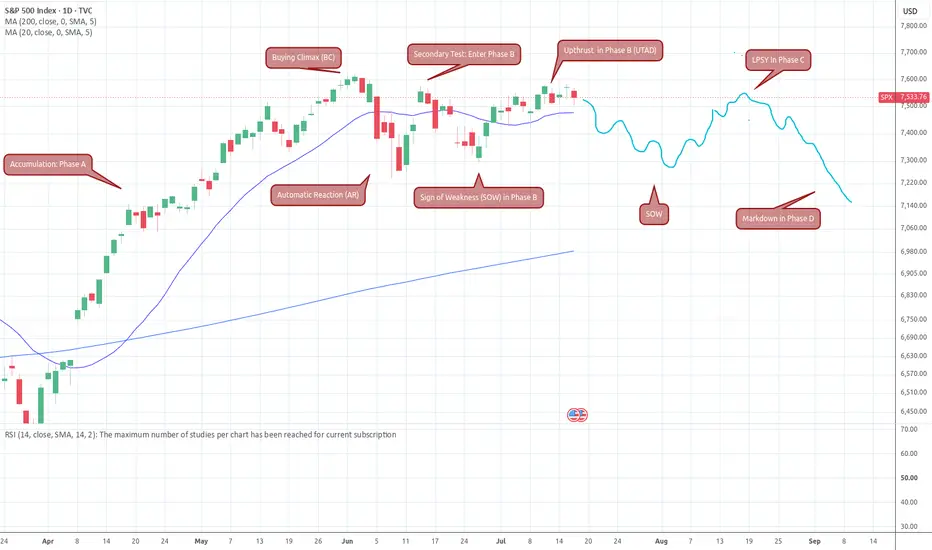
Wyckoff Distribution in Phase BMarket tops are not a point. Wyckoff's Distribution pattern is well-established in market lore as the unwinding of bullish exuberance.
A massive face-ripping runup in Phase A accumulation leads to a blowoff top which we saw in April >May with Buying Climax (BC).
The unsustainable bullish move ends in an Automatic Reaction (AR), or rejection of the ATH. The depth of the AR forms a support line for the Trading Range (TR) of the Phase B cycle in distribution.
What is distribution? It's the systematic unloading of huge positions by 'smart money' institutional investors selling to the rest of us, soon to be bagholders for the big players.
The AR after ATH leads to a Secondary Test (ST) which is typically slightly lower than the ATH. A series of dumps and pumps follows within the TR established by the AR bottom price after ATH.
During Phase B there is expected a Sign of Weakness (SOW), which may be a deep selloff or series of selloffs, followed by a further upthrust after dsitribution (UTAD), which can exceed the BC ATH, or form a double top.
UTAD rapidly suffers a sharp reaction and produces a further SOW which often ends in another ST to the Last Point of Support (LPSY). NB: LPSY marks the end of Phase C in distribution, beyond which further advances are not to be expected. After LPSY price enters MARKDOWN PHASE D.
It is impossible to predict the exact form of every top. Some have multiple upthrusts and SOWs. Typically there may be three thrusts, these can form a series of lower highs, a Head and Shoulders pattern or a Three Drives pattern in which the ATH occurs at end of Phase B and marks entry to phase C at LPSY. Sometimes there is only a Double Top.
This theory CANNOT PREDICT THE FUTURE but is very useful in understanding that you are about to be taken to the cleaners and be left holding the BAG.
NB: Wyckoff Rule 1: The Market and Individual Securities Never Behave in the Same Way Twice!
Rather, trends unfold through a broad array of similar price patterns that show infinite variations in size, detail, and extension. Each incarnation changes just enough from prior patterns to surprise and confuse market participants.
Rule 2: The Significance of Price Movements Reveals Itself Only When Compared to Past Price Behavior: Wyckoff described a 'Composite Man' who moves price according to his own interest. Today's PA is a result of the price moves of previous days, weeks and months. Composite Man consists of all the institutions, traders and participants all ganged up against YOU! Composite Man's prime motivation: taking YOUR money.
Wyckoff Theory: www.marketcalls.in
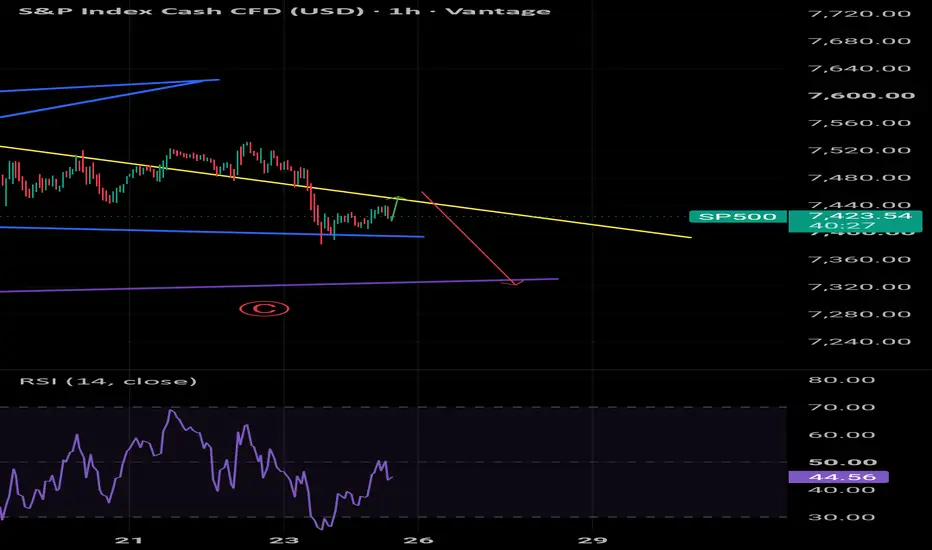
S&P 500 at Potential Reversal Zone—Is a Bigger Correction Next?The S&P 500 ( FOREXCOM:SPX500 ) reacted strongly to the recent support zone($7,463-$7,430) and Support Lines, which led to another bullish move. However, the index is currently trading near the key trading level of $7,500 and the Potential Reversal Zone (PRZ) .
From an Elliott Wave perspective, Wave C appears to have been completed through an Ending Diagonal pattern. The lower trendline of this pattern has already been broken, and the S&P 500 is currently pulling back to retest it.
I expect the S&P 500 to break below the support zone($7,463-$7,430) and support lines in the coming sessions and decline at least toward the $7,413 level.
Target: $7,413
Stop Loss(SL): $7,548
Note: Since tensions in the Middle East continue to escalate, any related news could have an immediate impact on the S&P 500. Therefore, be sure to monitor geopolitical developments closely and manage your risk carefully.
Note: If the S&P 500 begins to decline with strong bearish momentum, it could have a rapid and direct impact on the cryptocurrency market, especially Bitcoin ( BINANCE:BTCUSDT ).
What’s your view on the S&P 500? Do you think it can print new all-time highs again, or should we expect a deeper correction?
💡 Please respect each other's opinions and express agreement or disagreement politely.
📌 S&P 500 Index Analyze (SPX500USD), 4-hour time frame.
🛑 Always set a Stop Loss(SL) for every position you open.
✅ This is just my idea; I’d love to see your thoughts too!
🔥 If you find it helpful, please BOOST this post and share it with your friends.
Monday's possible trapA move down in futures may occur, but bears need to be cautious if they get down to 7400 by the open on Monday. The RSI is very low already on mid time frames and shorter time frames are setting up for bullish divergences. My target of 7600+ never got hit, and it often is the case that the target gets hit after it seems that the market missed it.
have a good weekend and see you Monday
Lets get ready for next week 7/19/26I walk you through my levels and the things I'm watching for in the markets. support and resistance. In this video I walk you through my ideas and possible scenarios that could possibly happen to the up side or the down side. I also go over a couple charts I decided to take profits on and a couple of charts I decided to buy. I hope you enjoy the video subscribe and boost. Leave a comment or questions if you have any I will get back to you as soon as I can thx.
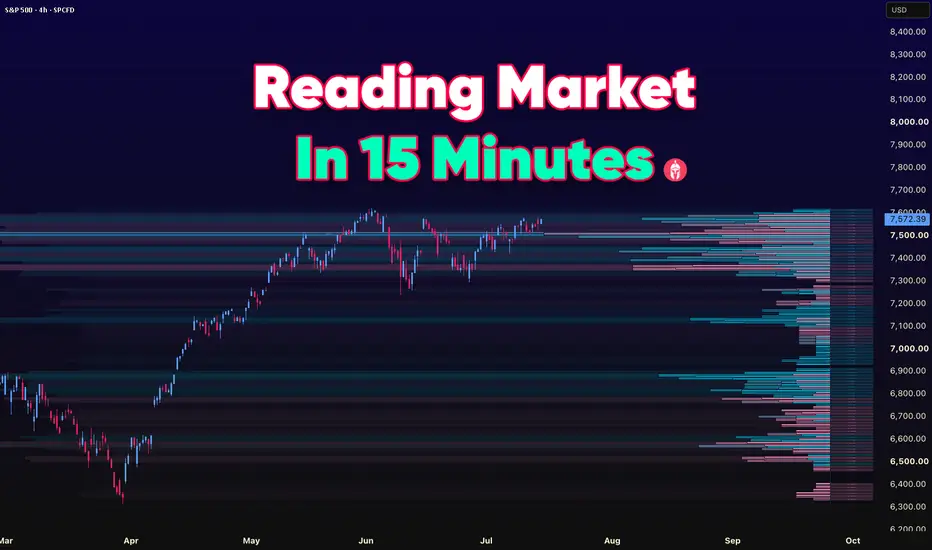
The Performance Trader · 02: Reading Market In 15 MinutesThe Performance Trader · 02: Reading Market In 15 Minutes
Last week I promised you the routine that decides your first trade before the market even opens. So here it is, the actual thing I do.
There was a long stretch where I'd sit down maybe two minutes before the open, coffee still too hot to drink, and just start clicking. No plan. The first green candle would tug at me and I'd be in, and half the time I was already red before I'd even worked out what kind of day it was. A friend who'd traded years longer than me made me time myself. Fifteen minutes. Same five checks. Every morning, before I was allowed to touch the mouse.
It's boring. It also fixed more of my mornings than any indicator ever did.
🗺️ Mark the trend and the levels
First I open the higher timeframe, which just means the bigger-picture chart, the daily or the 4-hour. I want the trend, the direction price has been leaning over the last few weeks. Up, down, or sideways and going nowhere.
Then I mark the levels. My understanding of good levels is a prices where the market stalled or turned before few times. One clear line overhead, one clear line below where we are now. That's it. Few levels and lines, not a spiderweb. On NASDAQ I'll usually have last week's high above and a big round number below, and I know before the bell where the air is thin.
📍 Note where price opened
Second check takes ten seconds. Where did we open compared to yesterday's range, the high to low of the whole prior day?
All possible levels from previous timeframes:
Open inside yesterday's range and the day often stays quiet, chopping around. Open above the high or below the low and something changed overnight, and I treat the first hour with more respect. Same chart, very different morning, and I want to know which one I woke up to before I risk anything.
🗓️ Check the one event
Third, I look at the calendar for a single macro event, meaning a scheduled news release, a rate decision or a jobs number or an inflation print. Not ten of them. The one that can move my market today.
If it lands at 2pm, I know my morning trades need to be closed or safe by then, because the minutes around a release can rip through any level like it isn't there. Boring to check, but it's the part that's saved me from getting caught leaning the wrong way.
🎯 Pre-decide two setups
Fourth is the one that changed the most for me. I pick two setups I'll take and I ignore everything else.
A setup is just the specific pattern you agree to wait for. Mine might be a pullback, price dipping back to that level below inside an uptrend, or a failed push through the level overhead. Two of them. Written down. And the part that took me longest to trust: which two I pick matters less than the permission they give me to sit on my hands through everything that isn't them. For years I assumed the better traders were the ones catching more. That was backwards for me. The stretch where I actually improved was the stretch where I stopped hunting and let most of the screen go by.
✍️ Write your daily stop
Last, I write one number down where I can see it. My daily stop , meaning the total loss for the day where I close the laptop and I'm done, win it back tomorrow (If you trading prop number must be lower Daily Loss Limit).
Say the number is 2% of the account. Two full losing trades at 1% each and I'm finished for the session, no matter how much the screen is begging me for a third. In plain words: I decide when I'm calm how bad a day I'm willing to have, so the angry version of me at 11am doesn't get a vote.
That's the fifteen minutes. Trend and levels, where we opened, the one event, two setups, a daily stop. I still run it with a timer, because the morning I skip it is always the morning I improvise, and improvising is expensive.
Part 3 lands next Thursday: how to protect your profit once you're up.
Which of the five do you actually run, and which do you keep skipping? Mine was the daily stop, the one I needed most.
Hellena | SPX500 (4H): LONG to the 7700 resistance area.It has been a while since my last S&P 500 update. The structure remained unclear for some time, but the bullish scenario is becoming much easier to read now.
After the medium-degree wave "4" was completed around 7228.7, the price started developing wave "5". Inside it, the smaller waves "1" and "2" have already been formed, and the market now appears to be moving within the smaller wave "3".
If the current medium-degree wave "5" develops normally, it should move above the wave "3" high at 7621.5. A truncated wave "5" is possible, but I do not see it as the main scenario for now.
The 100% Fibonacci extension is located around 7660.2. The nearest round level above it is 7700, so this is the target area I am watching.
Before the next move higher, the price may correct toward the 7500 support area. After that, I would expect the bullish move to resume. The second option is a direct continuation from the current levels without a noticeable pullback.
Softer U.S. inflation data and a strong start to the corporate earnings season are currently supporting equities. Treasury yields have eased, while expectations of an imminent Fed rate hike have declined. This gives buyers some additional support, although local corrections are still possible along the way.
Manage your capital properly and wisely! Enter trades only based on reliable patterns!