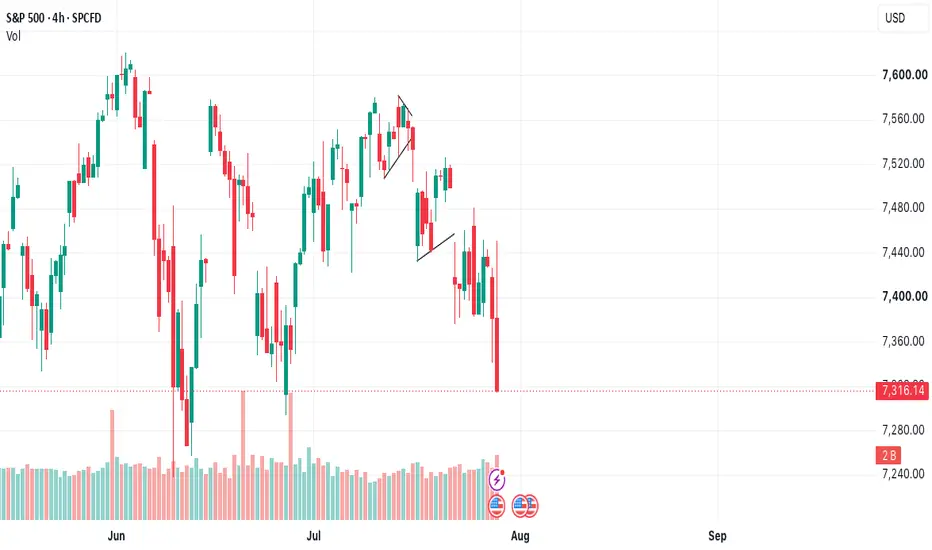
S&P 500 Weekly Outlook – Neckline Breaking. Bears Gain ControlS&P 500 Weekly Outlook – The Neckline Is Breaking. Bears Gain Confirmation (July 29, 2026)
Jul. 29 – The bearish setup we’ve been tracking is now taking another step forward.
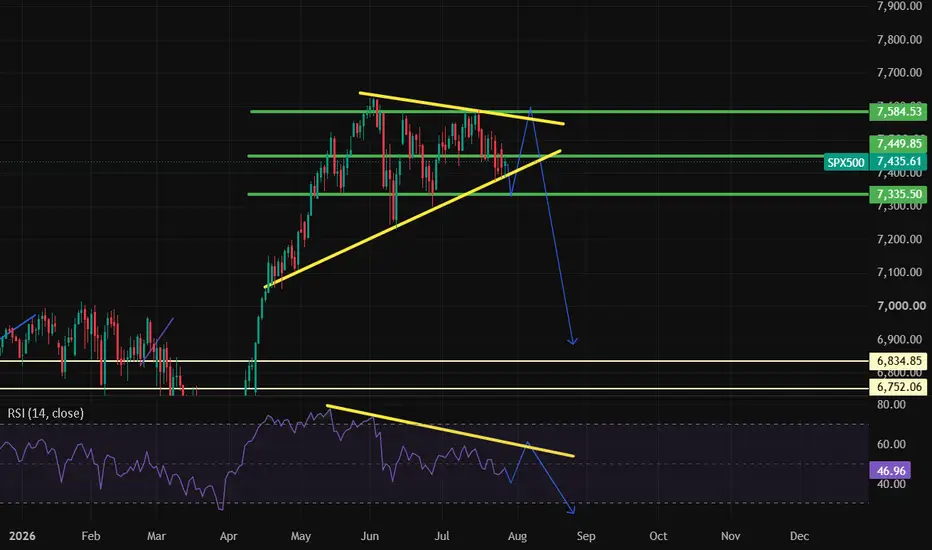
After the rising wedge broke, price has continued lower and is now breaking below the double-top neckline around 7,351.81.
This is an important level. The wedge breakdown was the first warning. Now, the loss of the neckline adds further confirmation that the market may be entering a deeper correction.
📍 Key Levels
7,620.90 = Major resistance and the double-top highs.
7,540–7,550 = Near-term resistance. A reclaim would be the first sign that bears are losing control.
7,351.81 = Double-top neckline. Price is now trading below this key level.
7,257.86 = Next support to watch.
6,645.30 = Major downside target and gap-fill area.
6,318.23 = March 30 lows and major support.
The key question now is whether the S&P 500 can reclaim the 7,351.81 neckline or if this level turns into resistance.
If the breakdown holds, the next leg lower could begin to unfold toward the 6,645 gap-fill area , with the 6,318 March lows remaining the deeper support level.
The wedge broke. Now the neckline is breaking. Bears are gaining confirmation.
Not Financial Advice. This is my technical analysis based on price action and chart structure.
S&P 500 Index
No trades
No trades
In-depth trading ideas
US500 Breaks Above the Channel – Bulls Stay in ControlUS500 Breaks Above the Channel – Bulls Stay in Control
Yesterday, after White House Counselor Hassett said that inflation is continuing to decline, we saw all the indices rise further and also the stock market turned green.
Currently, the US500 has broken out through a large channel pattern and the price seems to be able to rise further.
A very good entry price is if the price moves down for a correction near 7400 - 7450 before moving up again.
It is also possible to rise from the market price.
If you already have CALL OPTIONS, you don't have to worry about anything yet. The price should resume the upward movement soon.
You can find more details on the chart.
Thank you and good luck! 🍀
⚠️PS: Do your own analysis and use your own strategy to join the trade.
❤️ If this analysis helps your trading day, please support it with a like or comment ❤️
S&P500 When this happens, the market falls -10% at least.The S&P500 index (SPX) has been unable to break above its 1D MA50 (blue trend-line), turning it into a Resistance and every time this took place while the 1D RSI was falling under Lower Highs, the market corrected by at least -10%.
More specifically, the Double Top before the current one took place in early February 2026, right before the U.S. - Iran war, initiating a -10.06% correction that bottomed exactly on the 1W MA70 (red trend-line).
The most recent correction before that was right before the U.S. - China Trade War, in February 2025, which resulted into a much bigger correction. But the first Bearish Leg of this structure was -10.48% and also tested the 1W MA70.
As a result, the successive failure to recover the High, has high probabilities to turn into a new -10% correction, which would target 6865 and test yet again the 1W MA70.
---
** Please LIKE 👍, FOLLOW ✅, SHARE 🙌 and COMMENT ✍ if you enjoy this idea! Also share your ideas and charts in the comments section below! This is best way to keep it relevant, support us, keep the content here free and allow the idea to reach as many people as possible. **
---
💸💸💸💸💸💸
👇 👇 👇 👇 👇 👇
SP 500 Forecast panic cycles 8/5 and 10/16 The Sp 500 is nearing the end of the decline in wave C for wave B low The last advance should see above the last high likely 7641 to 7710 focus 7660 july 10th . Then THE start The first leg of the panic is ugly into 8/5 low from there we should see a ABC rally into sept 2nd Then The next leg of the CRASH cycle into oct 10 to the 20th focus is 10/16th This is what I see and how it will unfold ! best of trades WAVETIMER
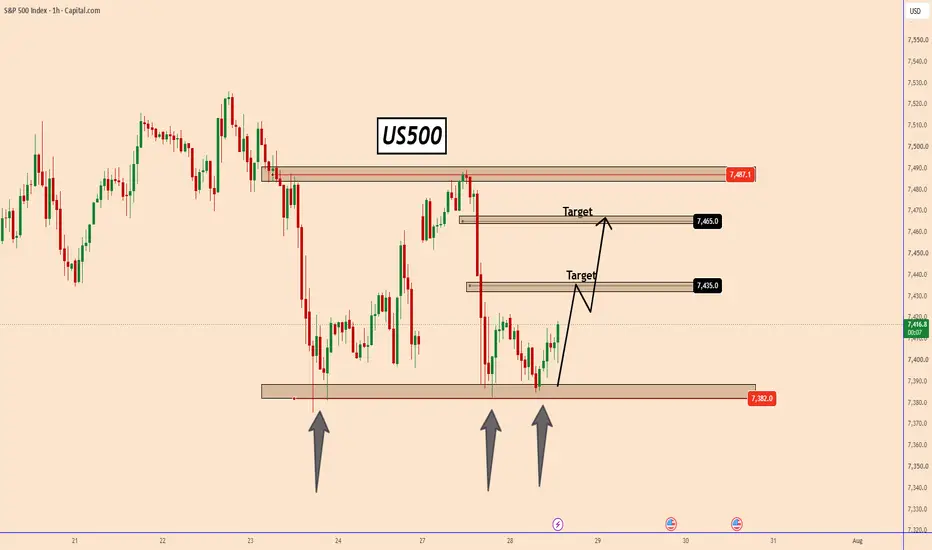
US500 Holds Key Support – Bulls Target Higher LevelsUS500 Holds Key Support – Bulls Target Higher Levels
US500 found strong support near 7380 and the price bounced back.
The indices stopped at this area several times in the previous days, thus increasing the chances that he could respect this area again.
The larger trend remains strong and bullish despite what is happening in this lower timeframe. For this reason, we should be careful because US500 could resume the prevailing trend again.
Also, Trump sees the stock price as the leading indicator for the US economy, so he could push everything up again.
Companies are still reporting strong earnigs overall despite that some of the big ones reported a slight fall this time.
Bullish targets:
7435
7465
You can find more details on the chart.
Thank you and good luck! 🍀
⚠️PS: Do your own analysis and use your own strategy to join the trade.
❤️ If this analysis helps your trading day, please support it with a like or comment ❤️
Rollover "Into The Realm" Part 2Now the market is seeing the costs
associated with the AI Bubble.
You see as long as the market was going straight up,
company CEO's have had a free ticket to spend TRILLIONS
to bolster their commitment to AI,
least they fall behind the curve.
But now you see the market,
the ultimate decider of public companies prosperity and fate
is deciding quite quickly that the costs have been too great,
and forward guidance is only adding TRILLIONS more to costs.
Put it this way.
The stock market bubble, which has been built on the future infinity of AI,
is now having some serious "doubt" mixed into the equation.
Sound familiar ???
THE_UNWIND
WOODS OF CONNECTICUT
7/29/26
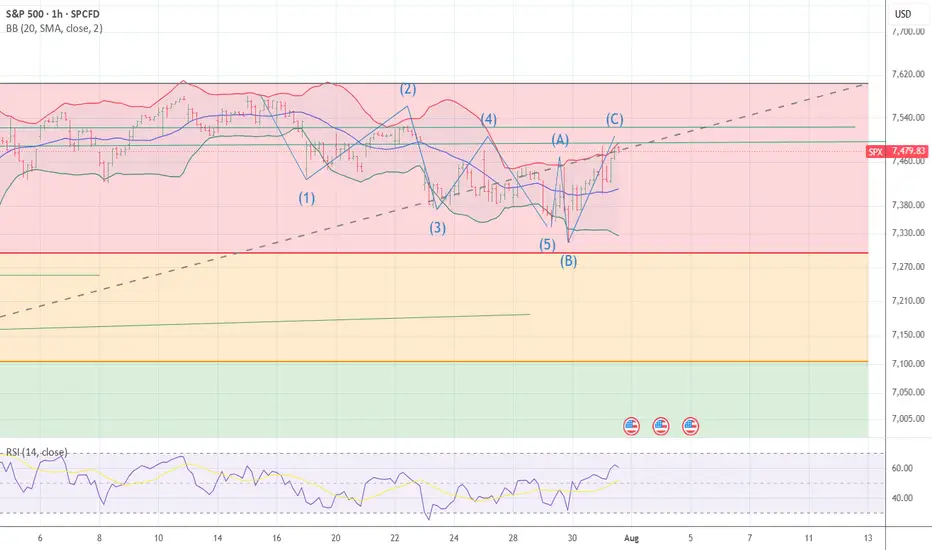
ABC and {A] x 1,618 = [C] 7489 I moved back to 90 % short SPYThe chart posted is the sp 500 I was flat early and now have moved back to 90 % long in the money puts The spiral from march 9th is 8/5 and The 10yr yield is doing what the 20 and 30 yr have been doing and The us /yen finally turned down from my 161.8 target I am NOT sure what is holding up the sp other that rotation But I am back again in puts at 7475 and 7488 best of trades WAVETIMER
We may rally at open but then turnIts hard to say if the market is done with the countertrend rally. We'll know it's over if they get under 7440 and hold. In the meantime, dips may get bought. We stopped at the 18ma in futures, they may want to test it in cash as well.
The VIX looks like it could pullback at open, but again it's in an area where a reversal is possible.
Warning: Institutional Cash Allocation Falls Below 4%!While the S&P 500 is trading close to its all-time high, the Federal Reserve is set to announce a new monetary policy decision this week, and the biggest U.S. technology companies will report their quarterly earnings.
Last week, I highlighted the technical signal that should absolutely be avoided to prevent the semiconductor sector from entering a deep correction phase. The chart below will take you to that analysis.
A good market analyst must, above all, follow the trend, and the primary trend of the S&P 500 remains bullish. Therefore, every short-term correction (lasting several trading sessions or, at most, a few weeks) should be viewed as an opportunity to initiate or increase positions in the direction of the prevailing trend.
However, as with every long-term market cycle, there comes a point when technical warning signals begin to emerge. These signals can provide an early indication of a potential medium-term market reversal.
Among the key indicators to monitor is the percentage of cash held by institutional asset managers. Put simply, asset managers allocate their portfolios among cash, equities, and bonds.
Historically, whenever the cash allocation has fallen below 4%, it has served as a warning that the equity market had reached an extreme overbought condition.
This is precisely what Bank of America's latest monthly survey of global fund managers reveals: the average cash allocation has declined to just 3.6% of assets under management, down from 4.1% the previous month. Such a low level has not been seen since 2021.
In practical terms, this means institutional investors are already heavily invested in equities. When cash reserves become this limited, their ability to fuel another wave of buying diminishes significantly, while even a minor disappointment can trigger profit-taking.
History also shows that falling below the 4% threshold does not automatically mark the market's peak. Rather, this signal indicates that investor optimism has become extreme and that the risk/reward balance is gradually deteriorating. In both 2000 and 2021, it preceded periods of weak market performance, although with a lag of several weeks or even several months.
This is therefore not an immediate sell signal, but rather an invitation to strengthen risk management discipline. In the coming days, the market's reaction to the Federal Reserve's decision and to the earnings reports of the major technology companies will be crucial. If positive news is no longer enough to push stock indices higher, then this exceptionally low cash allocation could become a warning that investors should not ignore.
The chart below illustrates the evolution of institutional cash allocations. The data comes from the BofA Fund Manager Survey (FMS). Cash currently represents 3.6% of total institutional assets under management. Below 4% is considered a warning zone for the equity market.
DISCLAIMER:
This content is intended for individuals who are familiar with financial markets and instruments and is for information purposes only. The presented idea (including market commentary, market data and observations) is not a work product of any research department of Swissquote or its affiliates. This material is intended to highlight market action and does not constitute investment, legal or tax advice. If you are a retail investor or lack experience in trading complex financial products, it is advisable to seek professional advice from licensed advisor before making any financial decisions.
This content is not intended to manipulate the market or encourage any specific financial behavior.
Swissquote makes no representation or warranty as to the quality, completeness, accuracy, comprehensiveness or non-infringement of such content. The views expressed are those of the consultant and are provided for educational purposes only. Any information provided relating to a product or market should not be construed as recommending an investment strategy or transaction. Past performance is not a guarantee of future results.
Swissquote and its employees and representatives shall in no event be held liable for any damages or losses arising directly or indirectly from decisions made on the basis of this content.
The use of any third-party brands or trademarks is for information only and does not imply endorsement by Swissquote, or that the trademark owner has authorised Swissquote to promote its products or services.
Swissquote is the marketing brand for the activities of Swissquote Bank Ltd (Switzerland) regulated by FINMA, Swissquote Capital Markets Limited regulated by CySEC (Cyprus), Swissquote Bank Europe SA (Luxembourg) regulated by the CSSF, Swissquote Ltd (UK) regulated by the FCA, Swissquote Financial Services (Malta) Ltd regulated by the Malta Financial Services Authority, Swissquote MEA Ltd. (UAE) regulated by the Dubai Financial Services Authority, Swissquote Pte Ltd (Singapore) regulated by the Monetary Authority of Singapore, Swissquote Asia Limited (Hong Kong) licensed by the Hong Kong Securities and Futures Commission (SFC) and Swissquote South Africa (Pty) Ltd supervised by the FSCA.
Products and services of Swissquote are only intended for those permitted to receive them under local law.
All investments carry a degree of risk. The risk of loss in trading or holding financial instruments can be substantial. The value of financial instruments, including but not limited to stocks, bonds, cryptocurrencies, and other assets, can fluctuate both upwards and downwards. There is a significant risk of financial loss when buying, selling, holding, staking, or investing in these instruments. SQBE makes no recommendations regarding any specific investment, transaction, or the use of any particular investment strategy.
CFDs are complex instruments and come with a high risk of losing money rapidly due to leverage. The vast majority of retail client accounts suffer capital losses when trading in CFDs. You should consider whether you understand how CFDs work and whether you can afford to take the high risk of losing your money.
Digital Assets are unregulated in most countries and consumer protection rules may not apply. As highly volatile speculative investments, Digital Assets are not suitable for investors without a high-risk tolerance. Make sure you understand each Digital Asset before you trade.
Cryptocurrencies are not considered legal tender in some jurisdictions and are subject to regulatory uncertainties.
The use of Internet-based systems can involve high risks, including, but not limited to, fraud, cyber-attacks, network and communication failures, as well as identity theft and phishing attacks related to crypto-assets.
Not buying this move - I am wolf.I’m not buying this move.
As a lone wolf in the profession I’m passionate about, I’ve spent years developing the discipline to observe before I strike.
Just like a wolf.
I stay patient, study the landscape, and question every move. I don’t attack until every condition in my playbook is aligned.
From my perspective, the conditions for a long trade are still far from ideal.
These recent rallies don’t look like aggressive institutional buying. They look more like short covering, profit-taking, or market makers pushing price toward a higher-value supply zone where real sellers may finally step in.
I’m looking for price to rotate lower. It may take another catalyst—perhaps a more impactful headline from the Middle East than we’ve seen so far—to drive the market into the demand zone that truly interests me.
Until then, I wait.
I’m prepared for shorts.
I am a wolf.
The Wolf of TetroTrade.
S&P 500 — When the Data Speaks and the Crowd Doesn't ListenThe Setup in One Paragraph
The US market is simultaneously carrying the second-highest valuation reading in 155 years of recorded history AND the calmest fear gauge in recent memory. CAPE at 41.37. VIX at 16.6. Those two numbers sitting together — in 20 years of weekly back-test data — have produced a 100% negative 12-month forward return rate across every completed historical observation. The one force preventing an immediate breakdown is Federal Reserve Net Liquidity at $5.92 trillion, which has historically been associated with zero negative 12-month outcomes. Two perfectly opposing forces. That tension is the market you are trading right now.
Valuation: Second Highest in 155 Years
The Shiller CAPE ratio measures stock prices against the average of the last 10 years of real earnings — smoothing out single-year distortions. At 41.37 , the current reading has been exceeded only once in recorded history: the dot-com peak of the late 1990s, when CAPE reached approximately 44.
The previous time CAPE crossed 38 — late 2021 — the S&P 500 fell approximately 26% over the following year.
In the 20-year back-test covering 1,057 weekly observations, the CAPE>38 bucket has 9 completed 12-month observations . All 9 are negative. Average: − 16.1% . The remaining CAPE>38 observations from 2025–2026 do not yet have completed 12-month forward data. The verdict is still being written.
VIX at 16.6: Calm at the Wrong Moment
VIX at 16.6 means the options market is pricing near-term serenity. No one is buying protection. The crowd is comfortable.
Historically, VIX below 18 is not dangerous in isolation. But combined with CAPE above 38, the 20-year data produces the single worst configuration in the back-test:
CAPE > 38 + VIX < 18 → 100% negative 12-month rate (9/9 completed observations, avg −16.1%)
The market is calm precisely when the structural data says it should not be. That divergence between surface sentiment and structural reality is the clearest signal in the dataset.
The One Bullish Force: Net Liquidity at $5.92T
Honest analysis requires acknowledging what is working in the bull's favour.
Federal Reserve Net Liquidity (Fed balance sheet minus Treasury cash account minus Reverse Repo) stands at $5.92 trillion . In the 20-year back-test, every observation of Net Liquidity between $5.5T and $6.5T produced a positive 12-month return. 133 observations. Zero negative outcomes.
Liquidity is the master valve. It is why the market has stayed elevated despite extreme valuation. It is the floor under the current S3 cyclical bull phase.
But the floor is not permanent. If Net Liquidity falls below $5.5T — recent weeks have seen modest decline from the $5.987T cycle high — the zero-negative-outcome protection disappears. And with CAPE at 41.37, there is no valuation cushion to catch the fall.
Watch $5.5T Net Liquidity as the primary swing variable.
Rate Pressure: Two Signals Building Quietly
DGS10 at 4.67% — The 10-year Treasury yield has crossed the S4 Forming threshold of 4.5% and is rising. At 4.67%, the risk-free rate is mechanically compressing equity multiples. With CAPE built on a decade of near-zero rate assumptions, the PE compression arithmetic is severe even if the market hasn't priced it yet.
T10Y2Y at +0.36% — The yield curve re-steepened from its October 2023 inversion low of −1.08%, deeper than both the 2000 and 2007 inversions. Historical precedent:
2001: inverted −0.65% → re-steepened → S&P −37%
2007: inverted −0.77% → re-steepened → S&P −52%
2026: inverted −1.08% → now +0.36% and rising
Re-steepening from a deep inversion is not relief. It is historically the signal that damage is flowing through the real economy while equity markets remain calm.
In the 20-year back-test, the 0% to +0.25% re-steepening zone produced 100% negative 3-year outcomes . The current +0.36% reading has moved past that zone — but the trajectory remains the key watch variable.
Dow Theory: Partial Non-Confirmation
DJIA is at all-time highs. DJTA — the Transportation Average, the real economy's report card — recently recovered but remains in a pattern of lower conviction relative to the Industrials.
By strict Dow Theory, both averages must confirm simultaneously for a full bull signal. When Industrials make new highs and Transports lag, it signals that financial markets are running ahead of economic activity. This has been an early warning at every major market turn in Dow Theory's recorded history.
The Dow Theory flag is not yet a bear confirmation. It is the classical early warning of S3 weakening.
Buffett Indicator: 173%
Total US market capitalisation divided by GDP: 173%. Historical fair value: approximately 100%. Every percentage point above 100 represents borrowed return — valuation expansion that must eventually mean-revert through price decline, earnings growth, or time.
Returning to CAPE 25 (still elevated historically) from the current 41.37 would require approximately 39% price compression assuming flat earnings. These are not price targets. They are the arithmetic of where current prices sit relative to 155 years of mean.
Three Active Warning Flags Simultaneously
For the first time in this analytical framework's history, three structural warning flags are simultaneously live:
🔴 DGS10 above 4.5% and rising — S4 Forming signal, third consecutive week above threshold
🔴 T10Y2Y re-steepening from historic inversion — Watch zone active, +0.36% and rising
🟡 Dow Theory partial non-confirmation — DJIA at ATH, DJTA showing lower conviction
The Honest Conclusion
The data is clear: by every structural metric tested across 20 years and 1,057 weekly observations, this market is in a bubble zone. CAPE at second-highest in 155 years. Buffett Indicator at 173%. Three simultaneous active flags. The single most dangerous CAPE×VIX configuration in the back-test is the current one.
And yet.
Markets do not make tops because the data says so. They have been at extreme readings before and kept going — for months, sometimes years — while the data-aware sold too early and the crowd kept buying.
Markets make tops when the last available buyer has bought.
When the AI narrative has pulled in every last sceptic. When the institutional holdout finally capitulates. When the retail investor who waited through the correction decides this time is different. When the universe of potential buyers is fully deployed, fully invested, and fully convinced — and there is no one left to sell to.
At that precise moment, not one week before and not one week after, the market turns. With complete mechanical indifference to the CAPE ratio, the VIX level, or the yield curve shape.
The data tells us where we sit on the probability distribution. Net Liquidity at $5.92T tells us the floor is holding. CAPE at 41.37 with VIX at 16.6 tells us the structural risk is as high as it has been in 20 years of data.
The question is not whether the market is in a bubble zone. It is. The question is who the last buyer is, and when they arrive.
Based on a 20-year systematic back-test of 1,057 weekly observations across 7 US market variables. Not investment advice. The framework reads probabilities — it does not predict.
S&P500 - Bullish ScenarioHello, Traders! 👋
The S&P 500 index has formed a Descending Channel.
The price failed to create a new lower low, signaling weakening bearish momentum.
Let's watch for a bullish scenario.
If the price breaks and closes above the channel's resistance line, I expect a strong bullish move.
🎯 Target: 7551.5
Into The RealmLast time I wrote to you,
I shared my view that the US Stock Market,
as measured by the S+P 500, was about to enter a new price adjustment realm.
Volume has entered the market today, on the downside
with a gap down opening to awaken that realization
You must respect the move down below SPX 7500 Support.
This is just the beginning.
The massive Trillion Dollar A-I Bubble, must ultimately be deflated
THE_UNWIND
WOODS OF CONNECTICUT
7/23/26
Bigger correction down for S&P500Hi traders,
Last week S&P500 dropped and went up again.
Now we could see a much bigger decline for the last leg down of a bigger (red) wave 4 ABC-correction into the bullish Monthly FVG.
Another possibility is that it's making a bigger Triangle and price is now in the D-wave up.
Let's see what the market does and react.
Trade idea: Wait for an impulsive move down, a correction up and a bearish change in orderflow on a lower timeframe to trade shorts.
This shared post is only my point of view on what could be the next move in this pair based on my technical analysis.
But I react and trade on what I see in the chart, not what I've predicted or expect.
Manage your emotions, trade your edge!
Eduwave
S&P500: 1W MACD Bearish Cross threatens to push for 6,800S&P500 is heavily bearish on its 1D technical outlook (RSI = 36.107, MACD = -27.300, ADX = 21.921) and just turned neutral on 1W (RSI = 52.724), following a negative mix of Fed rate (future) outlook and disappointing earnings. Apart from those, the strongest Sell Signal that could possibly emerge, did so: a Bearish Cross on the 1W MACD. Every time this happened while the 1W RSI was printing a similar pattern, S&P500 had a sharp dicline under its 1W MA50. Based on the three previous events, we expect the current decline to reach at least the middle of the 1W MA50 and MA100 (TP = 6,800).
## If you like our free content follow our profile to get more daily ideas. ##
## Comments and likes are greatly appreciated. ##