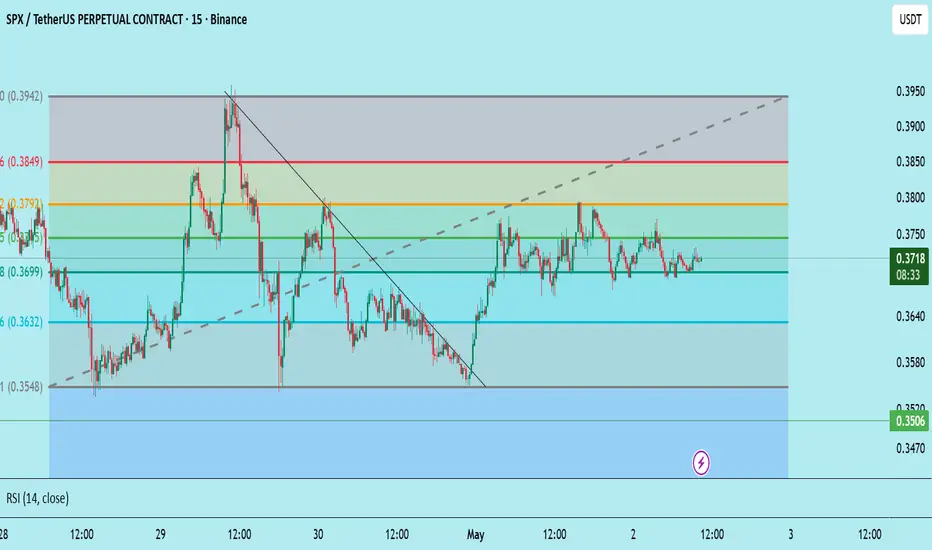
SPX / SPXUSDT | Long Setup | Breaker Block Reclaim📊 MARKET ANALYSIS
SPX is currently reacting from a key technical area highlighted on the chart.
As long as the protected support zone remains intact, the bullish market structure remains valid and higher liquidity targets may continue to attract price action.
A breakdown below the invalidation level would weaken the current bullish scenario and require a reassessment of market conditions.
🎯 Entry, Stop Loss, and Take Profit levels are displayed on the chart.
━━━━━━━━━━━━━━
⚠️ DISCL
SPX6900 / USDT
No trades
No trades
In-depth trading ideas
Cardano is approaching a key support level! (8H)The SPX correction began from the point marked by the green arrow on the chart, and price has been following the corrective scenario outlined in our previous analysis.
From a structural perspective, it appears that we are dealing with a Diametric pattern, with Wave F potentially nearing completion. However, another bearish move could still occur before the entire correction is finished.
Based on this scenario, SPX could drop toward the green zone, where the bearish Wave G may complete. If pric
SPX6900: A Small Allocation With a Longer-Term ViewI am looking at SPX as a medium- to long-term portfolio idea.
I am skeptical that another broad meme cycle will lift everything again. Too many projects seem to have lost the attention and conviction that supported them during the earlier hype. My interest is more selective: which communities can survive a prolonged decline and remain relevant?
SPX is one of the few names that still interests me from that perspective. I would consider a small allocation of approximately 0.5%–1.5% of the por
SPX6900 – Believe in Something? The Chart Tells a Different StorEveryone keeps repeating the same message: **"Believe in something."**
But here's my question: Are we believing in the project, or are we becoming exit liquidity for someone else?
I see a heavily hyped meme coin, but the 6H chart tells a very different story.
**What I'm watching:**
🔴 Clear bearish market structure – lower highs and lower lows.
🔴 Strong rejection from the $0.645 region.
🔴 Price trading below key moving averages.
🔴 Former support at $0.4489 has become a major resistance are
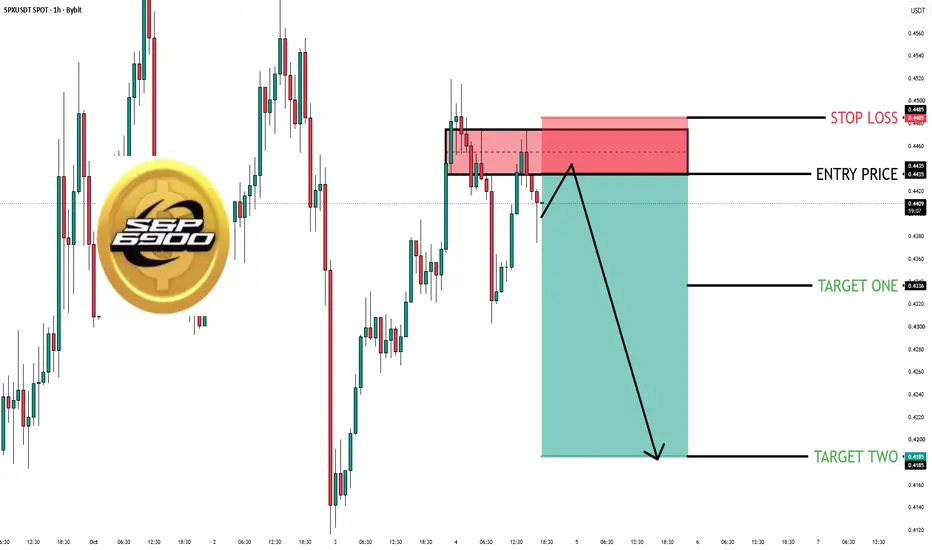
$SPX | 1H | SELL SETUP |🚨 BYBIT:SPXUSDT is down ~80% from its $2.27 ATH. "It's a discount" is the wrong read here.
📊 The narrative: "Community coin, deep drawdown, plenty of room to run."
What the data shows:
~$415M market cap, ~$446M FDV (Coinbase)
930.99M of 1B max supply is already circulating, ~93%
Price is up ~5% in 24h, but down ~2% on the week
Almost no fresh news flow around it
That last bit matters.
With ~93% of supply already out, there's no unlock overhang to blame for weakness. There's also none to h
SPX/USDT – 3D Range Breakout & RetestSPX has spent several months consolidating inside a broad accumulation range after the previous downtrend. Price recently broke above the range resistance with strong momentum and is now pulling back to retest the breakout zone.
On 4H price also has Bullish RSI divergence.
The current area offers a potential continuation setup if the former resistance holds as support.
🔹 Trade Setup
Entry: 0.4412
Stop Loss: 0.3904
TP: 0.8198
Risk/Reward: ~1:7.4
📌 Key Points
Long-term 3D consolidation/range
Br
$SPX | 1D | BUY SETUP |Hey traders! 👋
What are your thoughts on MEXC:SPXUSDT here — is this pullback setting up a fresh leg higher, or is the rejection near $0.60 the bigger signal?
SPX has gone through a breakout followed by consolidation, and is now looking at a potential retest of a daily demand zone, a pattern that often plays out as a healthy shakeout before continuation if buyers step back in. The sharp August rally left the door open for exactly this kind of pullback.
The key level here is the $0.4786–$0.4
SPX6900/USDtOn a normal schale prce have made a beautifull rounded bottom. Accumulation is almost done and buying this meme at a cheat premium is almost over. Time to be rewarded with profit. For anyone who wants to know how to make money in crypto with trading... without taking big risks... wait for a 80-90% decline in price.. look for big volume spikes in that lows and start laddering in... then its just a waiting game.
SPX/USDtPrice is done with accumulation. Looking to go to the next level of resistance. The early buyers here will be rewarded. Enjoy!
SLong
SPX6900 at a Critical Bear Flag – Breakdown Ahead or Bull Trap?📊 Technical Analysis
💵 Coin: $SPX6900 #SPX6900
⏳ Time Frame: 1D
📉 Pattern: Bear Flag
---
🐻 Pattern Overview
A Bear Flag is a classic bearish continuation pattern that typically forms after a strong impulsive decline (the flagpole), followed by a temporary upward-sloping consolidation (the flag). This structure often signals that sellers are pausing before potentially resuming the previous downtrend.
On this chart, SPX6900 is consolidating inside an ascending channel, which represents the Be
SPX/USDT — Long at Recovery Demand [Quantum Algo]SPXUSDT Perpetual · 1h
Context:
SPX has been recovering since the bottom at 0.31. After grinding sideways through the range between 0.32 and 0.36, price has now pushed through to 0.378 and is pulling back to retest the 0.3499 demand zone. A fresh Buy signal has fired right at this pullback support.
Why this setup works — three confluences:
Higher low structure intact — the recovery from 0.31 has built a clear sequence of higher lows: 0.31 → 0.32 → 0.33 → 0.34. Each pullback has bottomed at a pr
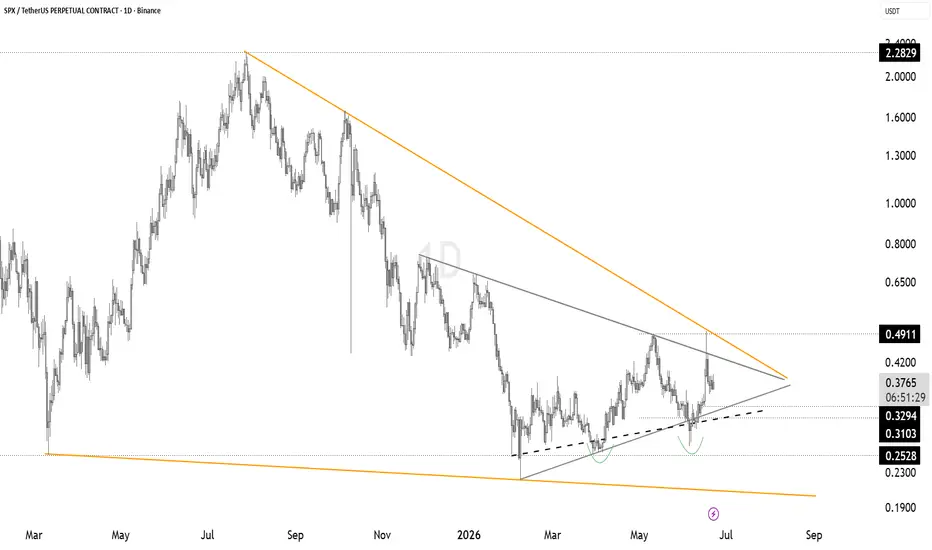
SPX Building a Large Accumulation StructureSPX is forming a clear series of higher lows while compressing beneath long-term descending resistance. The recent pullback from the upper trendline did not break structure, and buyers once again stepped in around the ascending support zone.
What stands out here is the developing double bottom formation around the 0.25 region, followed by a strong recovery and continued respect of the rising trendline. This suggests accumulation rather than distribution.
Price is now trapped inside a tightenin
SPX/USDT – Update : THE BREAKOUT TO TP 1 TP 2 AND RUNNER📊SPX/USDT – Update
The token has a confirmed trend.
The current structure suggests the correction phase may be nearing completion, with price starting to stabilize above key support. Momentum is gradually returning, increasing the probability of a continuation move if buyers maintain control.
🎯 TP 1: 0.4035
🎯 TP 2: 0.4925
🚀 TP 3: 0.6686 — Runner target open, allowing the trend to capture maximum upside potential.
👉 As long as price remains above the support zone, the bullish scenario stays ac
SPX USDT long at bullish order block — [Quantum Algo]Using Smart Money Concepts (SMC) methodology: identifying a bullish order block at the 0.3030–0.3330 demand zone on the 2H chart, with price retracing into the zone after an impulsive recovery leg from 0.3100 lows and forming a base for continuation. Multi-timeframe context: 2H structure shifted bullish after the sweep of equal lows at 0.3100 and the subsequent break of internal structure with displacement to 0.3600, reclaiming territory from the prior multi-day downtrend. Setup posted transpare
SPX Is About to Begin a Bearish Wave (8H)From the point where the green arrow was placed on the chart, the SPX has entered a bullish phase.
It appears that the first three waves of this bullish phase have been completed, and the price is now expected to enter Wave D.
Within the supply zone, we are looking for short/SELL positions. In this area, either wait for confirmation before entering a position or scale in using DCA.
The targets are marked on the chart. At the first target, either fully exit the position or take partial profits
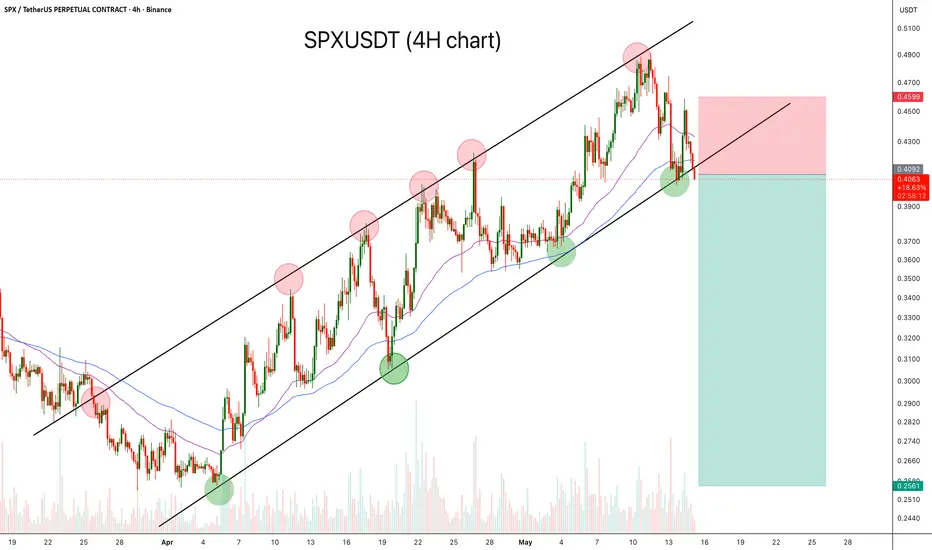
SPXUSDT 4H Rising Channel Breakdown Setup!SPXUSDT continues to respect a well-defined ascending channel on the 4H timeframe. Price recently tapped the upper resistance trendline for the fifth time and faced a strong rejection, forming a local top around the 0.49 zone.
The chart shows:
- Multiple clean reactions from both channel support and resistance
- Repeated bearish rejections at the upper boundary (red circles)
- Strong bullish defenses near trendline support (green circles)
- Price currently losing momentum below key moving av
SPX Perfect 0.618 Fib Bounce | Bullish Continuation ??SPX respected the 0.618 Fibonacci support zone perfectly and reacted exactly from the key demand area around 0.416 - 0.412. The sharp rejection from this level confirms buyers are still defending the bullish structure for now.
Price also swept liquidity below the previous range before bouncing back above the 0.5 fib level, which is generally a strong sign of support confirmation. As long as SPX continues to hold above the 0.412 region, the probability of continuation toward higher fib levels re
SPX Triple Top Formation Near Resistance|Rising Wedge BreakdownSP:SPX is currently trading inside a rising wedge/channel after a strong impulsive rally from the $0.36 region. However, the structure is now showing clear signs of exhaustion near resistance.
One major bearish signal here is the formation of a potential triple top around the $0.437-$0.441 region. Price has tested this area multiple times but failed to break through decisively, showing weakening bullish momentum.
Additional bearish confluences:
• Rising wedge/channel structure
• Repeated reje
SPX Looks Super Bullish!It appears that the price is fluctuating within a very large diametric structure, and it is currently in the middle of wave F.
Wave F is forming an ABC pattern, and it seems we are currently in the middle of wave B within F.
On higher timeframes, the price has stabilized at a key level. As long as the green zone holds, we expect positive fluctuations and a bullish move from the SPX in the coming weeks.
This is a volatile instrument, so risk management is essential.
Consider entering in the g
SPX Hits Targets, | Holding Gains Above Breakout$SPX/USDT has played out as expected from the previous analysis, moving cleanly from the 0.365 – 0.371 accumulation zone and reaching the projected upside targets.
Price has now pushed into the 0.394 – 0.400 region, showing strong continuation after the breakout above resistance.
Key Observations:
Clean move from the demand zone to the targets
Breakout above 0.3789 confirmed momentum
Strong follow-through into higher resistance
Higher lows continue to support the trend
Current Structure:
Pric
SPX Building Strength Above Support | Breakout Structure Forming$SPX/USDT is showing signs of accumulation after reclaiming key levels and stabilizing above the 0.365 – 0.371 support zone.
The structure reflects a transition from a downtrend into consolidation, followed by a gradual shift toward higher lows. Price is now holding above a key base while compressing below resistance — a classic setup for expansion.
Key Observations:
Strong reclaim of horizontal support
Formation of higher lows indicates demand
Compression below resistance (0.3789)
RSI near ne
$SPX Bulls Cooking Again…On the 1-hour timeframe, MEXC:SPXUSDT is currently showing a bullish continuation setup after a strong impulsive move to the upside. The market has been forming higher highs and higher lows, confirming that buyers are in control and momentum remains positive.
After rallying toward the recent highs near the $0.3830 resistance area, price has started to pull back slightly, which is a healthy sign of consolidation rather than weakness. This pullback is now approaching a key confluence zone betwe
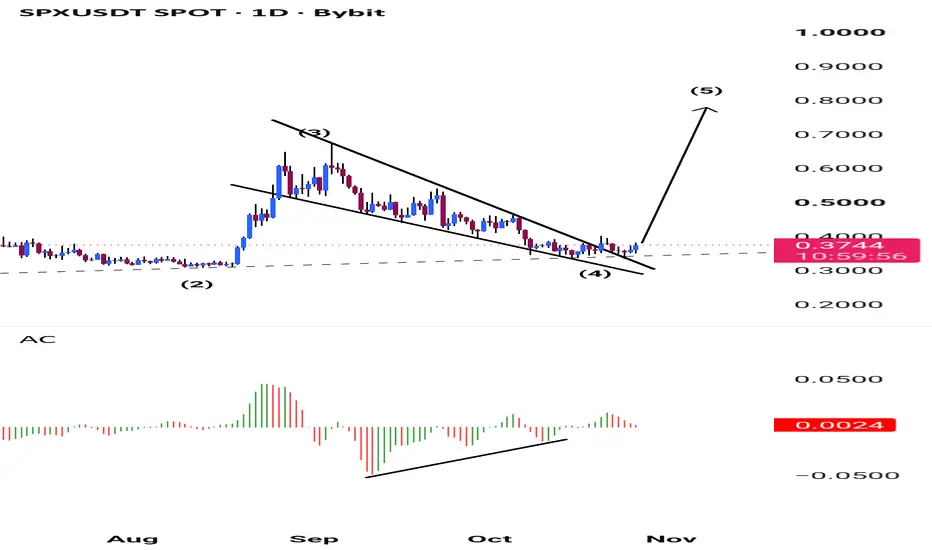
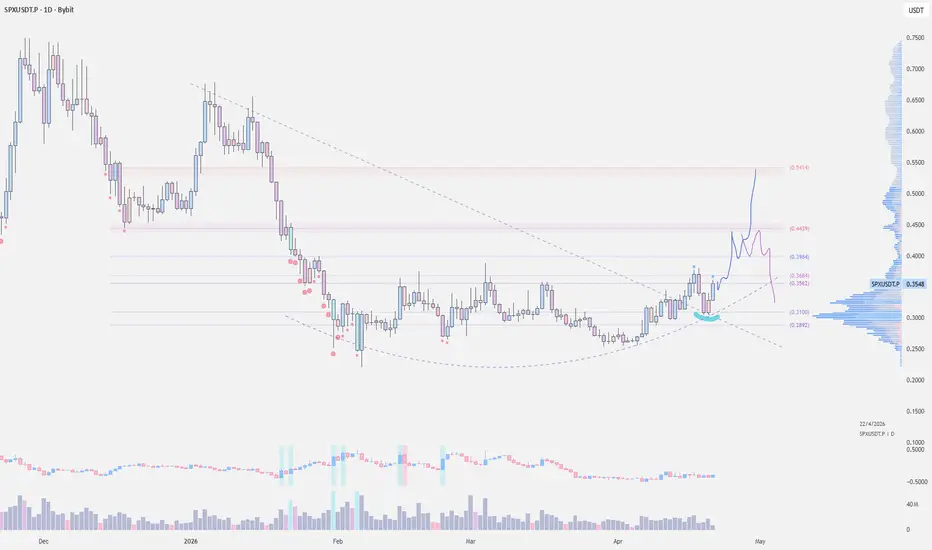
$SPX - Breakout and Retest SetupMost altcoins are starting to coil up for a breakout after nearly 2.5 months of consolidation, while BTC holding key levels gives room for alts to finally expand.
MEXC:SPXUSDT looks interesting here on the daily — price is attempting a breakout from the range and reclaiming the downtrend structure. The key level to watch is the .35 area, which lines up with strong volume support and the local POC. As long as this zone holds, continuation toward .39 first, then .44, and potentially the .54 res