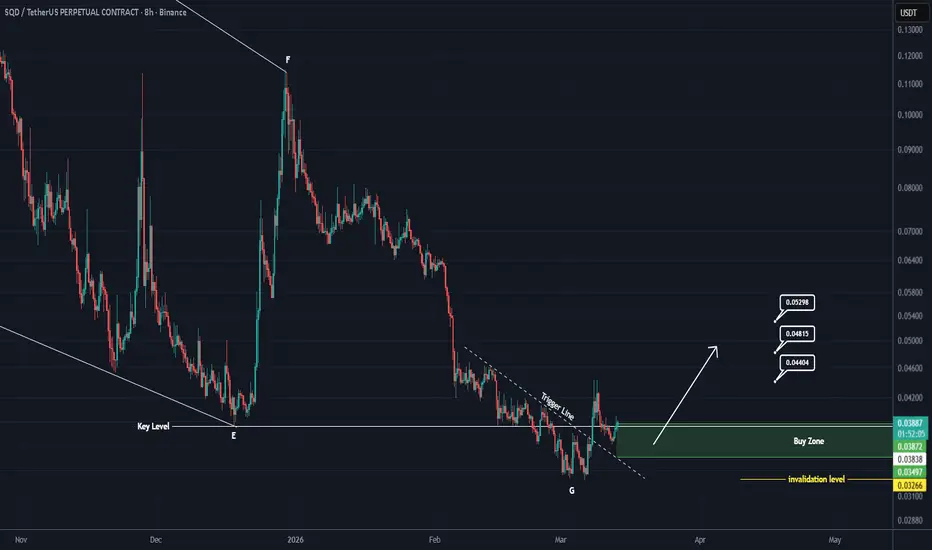
SQD is likely to turn bullish soon (8H)It seems we have a large diametric pattern forming on SQD, and we are currently in wave G.
Either wave G of this pattern has ended, or a part of this wave has completed.
The selling pressure has been absorbed by buyers, momentum has dropped, and the price is oscillating sideways, indicating the pr
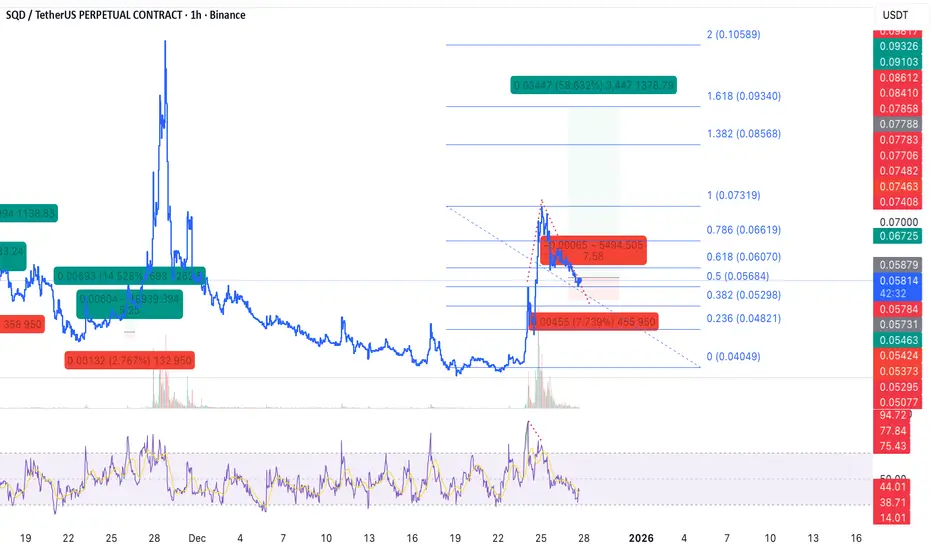
SQDUSDT Positioning for Move Toward Structure ResistanceSQDUSDT continues to trade within a descending structure, and the current plan is to focus strictly within this range. Price is now approaching a favorable buying region, offering an opportunity to accumulate with the intention of holding the position through a move toward the upper boundary of the
Bullish – SQD🐂 LONG – SQD
Price is accelerating on the 15m timeframe, accompanied by a clear expansion in trading volume—confirming strong short-term buying pressure. On the 1h timeframe, this move still appears to be a healthy pullback within a broader structure rather than a distribution phase. As long as pri
SQD USDT LONG SIGNAL
---
📢 **Trade Setup – SQD/USDT**
📈 **Position: LONG**
💰 **Entry Zone:** 0.07177 – 0.06985
🛑 **Stop-Loss:** 0.06658
🎯 **Take-Profit Targets:**
• TP1: 0.095
• TP2: 0.106
• TP3: 0.121
• TP4: 0.136
• TP5: 0.205
📊 **Timeframe:** 4H
⚖️ **Risk/Reward:** Favorable
⚙️ **Leverage:** Spot or low leverage
SQD - Entry huntingSQD rejected off of a long-term LVN, I am now looking to enter a long position at the end of the correction of this recent pump. No Target, just SL following given that we are at the low range of the All-Time Value Area I would attempt to trend-follow all the way to VAH
Here is the HTF Context: SQ
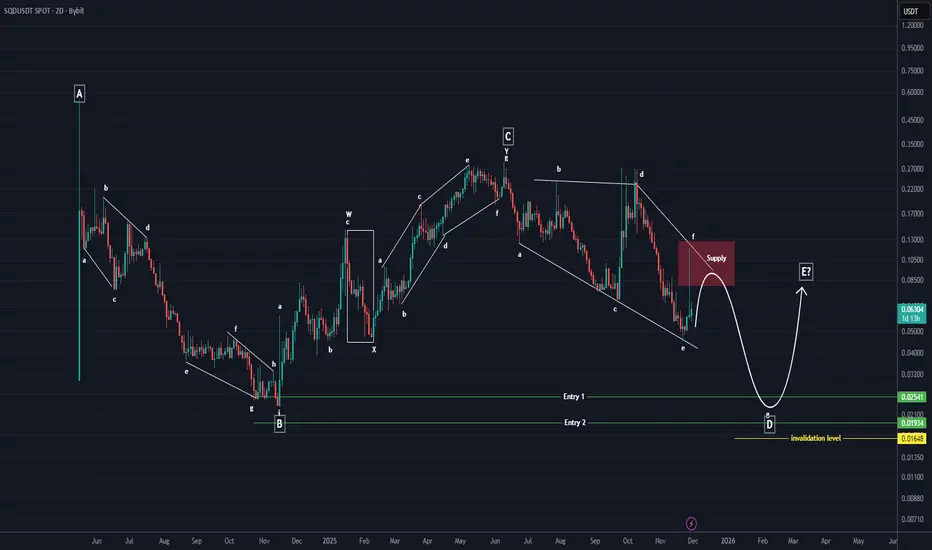
SQD New Update (2D)Based on the data we have from SQD, we can analyze this coin.
It seems that we are currently in the Diametric/Symmetrical pattern, wave D — specifically inside wave F of this structure.
In the red zone, you can look for sell/short positions.
In the green entry zones, we can look for buy/long posi
SQD Analysis (1D)First of all, pay attention to the timeframe | this is the daily timeframe.
For sell/short positions in higher timeframes and in a swing style, entries should only be taken within the red zone. However, for scalp short positions, you may enter after confirmation, but you must manage your expectatio
Scalp Long – SQD📈 Scalp Long – SQD
Price is holding firmly at a key support zone, with price action signaling a potential move to retest the local high. On lower timeframes, strong buying volume has appeared, and RSI has broken out into the bullish zone — indicating growing momentum.
🎯 Trade Setup:
Take Profit (
Scalp Long – SQD💎 Scalp Long – SQD
RSI is deeply oversold, with a bullish divergence forming, hinting at a potential recovery setup.
Wait for a confirmed breakout to validate the move — high risk, high reward opportunity.
🎯 Plan:
→ Enter after clear breakout confirmation.
→ TP: 0.09756 | SL: 0.07855 | RR: 1 : 5.2
See all ideas
Summarizing what the indicators are suggesting.
Oscillators
Neutral
SellBuy
Strong sellStrong buy
Strong sellSellNeutralBuyStrong buy
Oscillators
Neutral
SellBuy
Strong sellStrong buy
Strong sellSellNeutralBuyStrong buy
Summary
Neutral
SellBuy
Strong sellStrong buy
Strong sellSellNeutralBuyStrong buy
Summary
Neutral
SellBuy
Strong sellStrong buy
Strong sellSellNeutralBuyStrong buy
Summary
Neutral
SellBuy
Strong sellStrong buy
Strong sellSellNeutralBuyStrong buy
Moving Averages
Neutral
SellBuy
Strong sellStrong buy
Strong sellSellNeutralBuyStrong buy
Moving Averages
Neutral
SellBuy
Strong sellStrong buy
Strong sellSellNeutralBuyStrong buy
Displays a symbol's price movements over previous years to identify recurring trends.