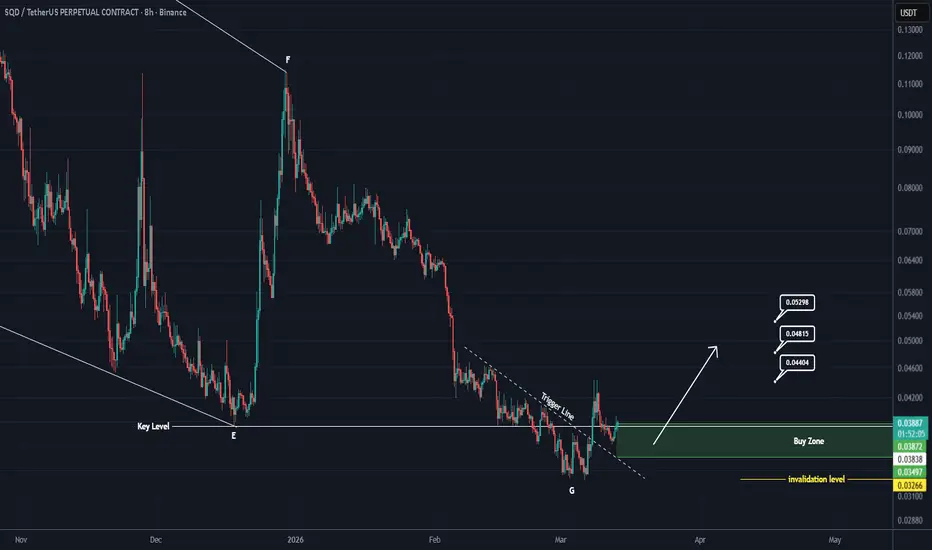
SQD is likely to turn bullish soon (8H)It seems we have a large diametric pattern forming on SQD, and we are currently in wave G.
Either wave G of this pattern has ended, or a part of this wave has completed.
The selling pressure has been absorbed by buyers, momentum has dropped, and the price is oscillating sideways, indicating the presence of buyers.
The trigger line on the higher timeframe has been broken, and the price is trading at a key level.
We will enter the position in the Buy zone using DCA.
Targets are marked on the chart; break even at the first target.
A daily candle closing below the invalidation level will invalidate this analysis.
If you have a coin or altcoin you want analyzed, first hit the like button and then comment its name so I can review it for you.
Do you also think FET is bullish?
In-depth trading ideas
SQDUSDT Positioning for Move Toward Structure ResistanceSQDUSDT continues to trade within a descending structure, and the current plan is to focus strictly within this range. Price is now approaching a favorable buying region, offering an opportunity to accumulate with the intention of holding the position through a move toward the upper boundary of the structure. If this scenario plays out as projected, the upside target remains the major supply zone, where profit taking and reaction are expected. Structure invalidation occurs on a clean loss of the demand base.
Bullish – SQD🐂 LONG – SQD
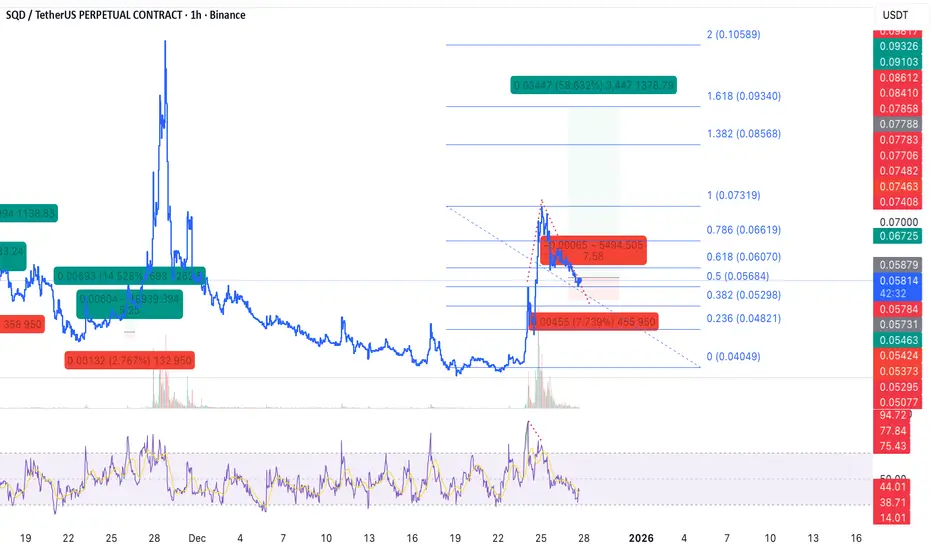
Price is accelerating on the 15m timeframe, accompanied by a clear expansion in trading volume—confirming strong short-term buying pressure. On the 1h timeframe, this move still appears to be a healthy pullback within a broader structure rather than a distribution phase. As long as price holds this level, the probability of a momentum continuation to the upside remains high.
This setup reflects a classic pullback + volume expansion scenario, where buyers are stepping in early ahead of the next impulsive leg.
🎯 TP: 0.0934
🛡️ SL: 0.05463
📊 RR: 1 : 7.58
A high-RR momentum long: intraday strength + higher-timeframe structure support → asymmetric upside potential.
SQD USDT LONG SIGNAL
---
📢 **Trade Setup – SQD/USDT**
📈 **Position: LONG**
💰 **Entry Zone:** 0.07177 – 0.06985
🛑 **Stop-Loss:** 0.06658
🎯 **Take-Profit Targets:**
• TP1: 0.095
• TP2: 0.106
• TP3: 0.121
• TP4: 0.136
• TP5: 0.205
📊 **Timeframe:** 4H
⚖️ **Risk/Reward:** Favorable
⚙️ **Leverage:** Spot or low leverage (max 3×)
🧠 **Technical Context:**
Price is reacting from a higher-low structure after a long downtrend.
Bullish breakout from short-term descending structure with volume expansion.
Targets align with key resistance and liquidity zones.
📌 **Trade Management:**
✔️ Partial profit at each TP
✔️ Move SL to BE after TP1
✔️ Trail SL on higher targets
#SQDUSDT #Crypto #Altcoins #TradingView #TechnicalAnalysis
SQD - Entry huntingSQD rejected off of a long-term LVN, I am now looking to enter a long position at the end of the correction of this recent pump. No Target, just SL following given that we are at the low range of the All-Time Value Area I would attempt to trend-follow all the way to VAH
Here is the HTF Context: SQD swept below the VAL where smart money accumulated (GG to everyone who entered here and still has longs running). SQD is currently trading at the all-time POC, its fairest price. No point in entering here. Watching reaction here.
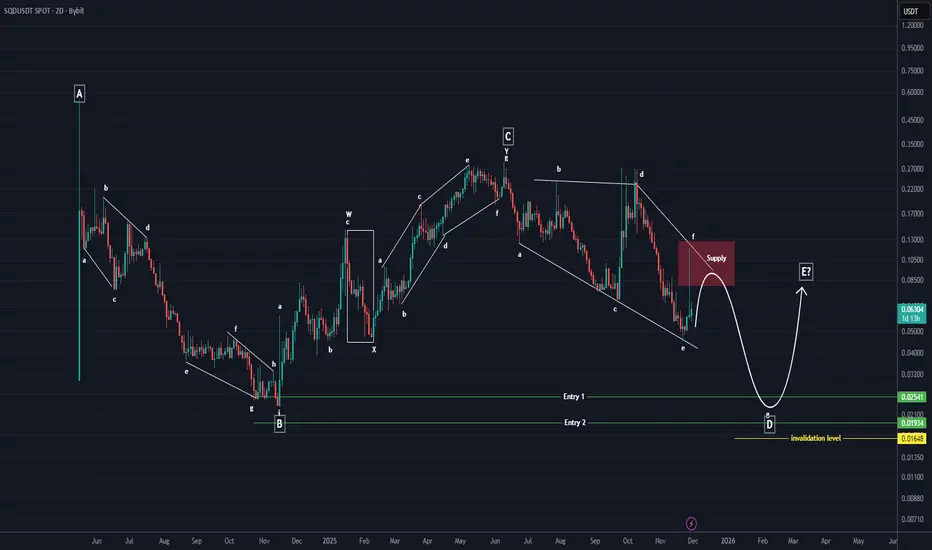
SQD New Update (2D)Based on the data we have from SQD, we can analyze this coin.
It seems that we are currently in the Diametric/Symmetrical pattern, wave D — specifically inside wave F of this structure.
In the red zone, you can look for sell/short positions.
In the green entry zones, we can look for buy/long positions.
Let’s see what will happen next.
For risk management, please don't forget stop loss and capital management
When we reach the first target, save some profit and then change the stop to entry
Comment if you have any questions
Thank You
SQD Analysis (1D)First of all, pay attention to the timeframe | this is the daily timeframe.
For sell/short positions in higher timeframes and in a swing style, entries should only be taken within the red zone. However, for scalp short positions, you may enter after confirmation, but you must manage your expectations regarding scalp trades.
On the chart, it seems that wave C has completed and the price has entered wave D. Within the green support zone, wave D may still be incomplete, and the price could enter a corrective phase of wave D, which in this case means an upward move.
The targets are marked on the chart. A daily candle close below the invalidation level will invalidate this analysis.
For risk management, please don't forget stop loss and capital management
When we reach the first target, save some profit and then change the stop to entry
Comment if you have any questions
Thank You
Scalp Long – SQD📈 Scalp Long – SQD
Price is holding firmly at a key support zone, with price action signaling a potential move to retest the local high. On lower timeframes, strong buying volume has appeared, and RSI has broken out into the bullish zone — indicating growing momentum.
🎯 Trade Setup:
Take Profit (TP): 0.08338
Stop Loss (SL): 0.06964
Risk/Reward Ratio (RR): 1 : 3.46
A high-RR long setup supported by strong buying pressure, bullish RSI breakout, and clear reaction at major support.
Scalp Long – SQD💎 Scalp Long – SQD
RSI is deeply oversold, with a bullish divergence forming, hinting at a potential recovery setup.
Wait for a confirmed breakout to validate the move — high risk, high reward opportunity.
🎯 Plan:
→ Enter after clear breakout confirmation.
→ TP: 0.09756 | SL: 0.07855 | RR: 1 : 5.26
Momentum is shifting in favor of buyers.
Keep positions light, trail SL as price strengthens.
Patience and precision — only act when the setup confirms.
SQDUSDT Ready to Explode Cup & Handle Breakout Loading!SQDUSDT has formed a clean Cup & Handle pattern on the 3-day chart, signaling a potential bullish continuation once price breaks above the neckline. Currently, the handle is shaping into a bullish pennant, showing tightening consolidation before an expected breakout.
A confirmed breakout above the neckline could trigger two key upside targets $0.9526 from the pennant projection and a major Cup & Handle target near $3.52 in the mid-term outlook.
Momentum remains constructive as long as price holds above the handle support.
Like & follow for more timely insights!
SQD PERPETUAL TRADE SELL SETUP Short from $0.22SQD PERPETUAL TRADE
SELL SETUP
Short from $0.22
Currently $0.22
Targeting $0.18200 or Down
(Trading plan IF SQD
go up to $0.24 will add more shorts)
Follow the notes for updates
In the event of an early exit,
this analysis will be updated.
Its not a Financial advice
God Candle on SQD Entering Its Next Era
After a massive breakout from sub-$0.10 levels, $SQD has rallied over 100% in 24h, fueled by growing adoption news and upcoming staking/rewards utility.
Chart Setup
Strong parabolic move with volume confirming trend.
Local top printed around $0.28 before sharp rejection → healthy cooling phase now around $0.20 support zone.
Key support: $0.20 psychological + breakout retest.
Resistance: $0.25–$0.28 range (previous rejection zone).
Scenarios
Holding above $0.20 could set up a higher low → continuation toward $0.30+.
Failure to hold $0.20 may trigger a deeper retrace into $0.16–$0.18 accumulation zone before the next leg.
Narrative Catalyst
SubSquid isn’t just hype – it’s solving blockchain data infra across Solana, Ethereum, Polkadot & more. With 100M+ daily API calls, 70+ projects, and staking about to go live, token demand could accelerate alongside ecosystem adoption.
📌 Outlook
Near term → consolidation after vertical run.
Mid term → continuation likely as adoption narrative + staking kick in.
Long term → if SubSquid becomes the “AWS of Web3 data,” today’s moves may just be the beginning.