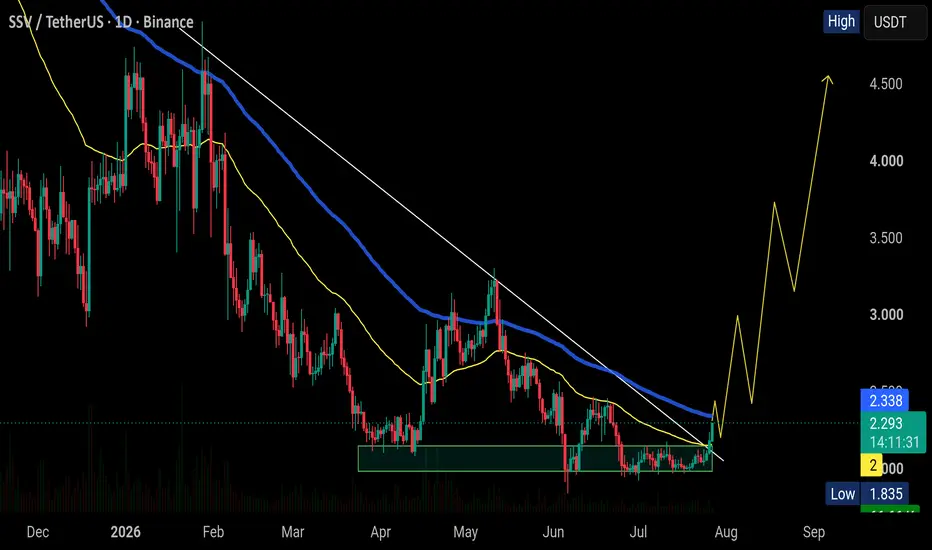
$SSV - Bullish Structure HoldingBINANCE:SSVUSDT is starting to look interesting here.
Price broke out with a strong bullish impulse and is now consolidating above the breakout zone. As long as it holds the current range, momentum remains in favor of the bulls.
The key level is $2.20. If price continues to hold above it, I think that’s when the real move begins back to $3-$4 zone.
In-depth trading ideas
$SSV update: The setup still looks good to me. Today's pullbackTSXV:SSV update:
The setup still looks good to me. Today's pullback doesn't change much as long as $2.00 continues to hold.
I'm still watching $2.34 as the key level. Once we reclaim it and turn it into support, I think the next leg up can begin.
For now, nothing has changed. As long as $2.00 holds, I'm staying bullish. 📈
$SSV is finally showing signs of life. It's starting to look inTSXV:SSV is finally showing signs of life.
It's starting to look interesting, but I'm not getting excited just yet.
If price can reclaim $2.34 and actually hold above it, I think that's when the real move begins. From there, I wouldn't be surprised to see it work its way toward the $4+ area.
Until then, I'm staying patient. I'd rather wait for confirmation than chase the price. 📈
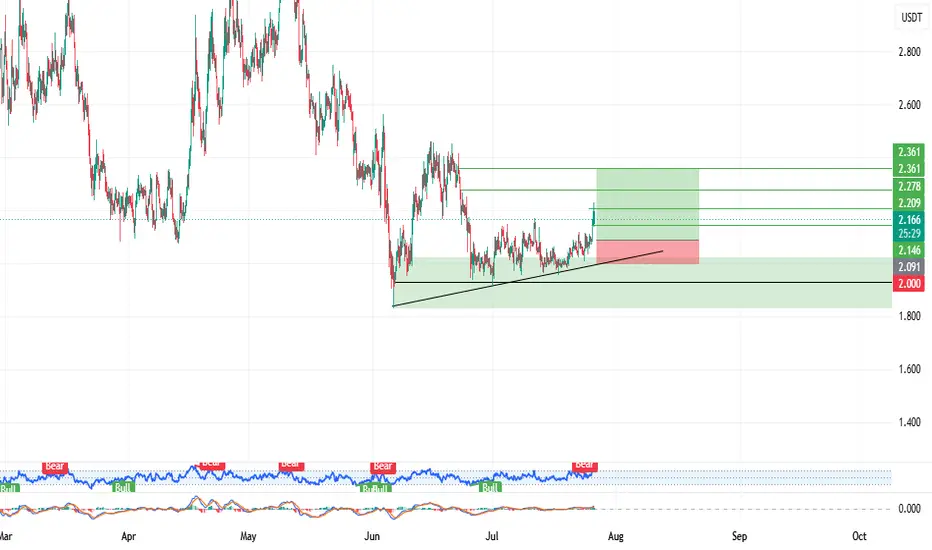
SSV USDT LONG SIGNAL#127. SSV /USDT – Trade Setup (LONG)
📈 Position Type: LONG
🕒 Timeframe: 1H
📊 Market: Futures
💰 Entry Zone:
2.090
🛑 Stop-Loss:
2
🎯 Take-Profit Targets:
• TP1: 2.146
• TP2: 2.210
• TP3: 2.278
• TP4: 2.360
⚙️ Leverage:
5 *10
▫️ After TP1, move SL to Entry + 0.2%.
▪️ Exit Plan:
• 40% at TP1
• 20% at TP2
• 20% at TP3
20..TP4
📌 Risk Management:
Risk only 1–2% of your capital per trade.
⚠️ Always check and confirm the setup on your chart before entering the trade.
SSV Enters a Bearish Wave (4H)It looks like a bullish diametric structure on SSV has likely come to an end. Price now appears to be entering a bearish phase of similar degree to the completed bullish structure, which suggests that SSV could remain in a bearish environment for several weeks.
We have identified a flip zone on the chart, which acts as a supply area. A retest of this level could trigger further downside movement in SSV, leading to additional drops.
Targets are clearly marked on the chart. At Target 1, it is recommended to move stops to breakeven to reduce risk.
In the red flip zone, entries should be taken gradually using a DCA (Dollar Cost Averaging) approach.
A daily candle closing above the invalidation level would fully invalidate this analysis.
KEEP AN EYE ON SSV🔥 Fortune AI Radar — TSXV:SSV
Fresh activity detected on TSXV:SSV today.
Data suggests increasing market interest & buyers stepping in.
Technicals currently lean bullish, with momentum trending upward.
Whales showing hints of accumulation and hype rising among traders.
This coin is flashing strong signals on short-term charts — worth keeping an eye on 👀
Not financial advice — always research before taking decisions
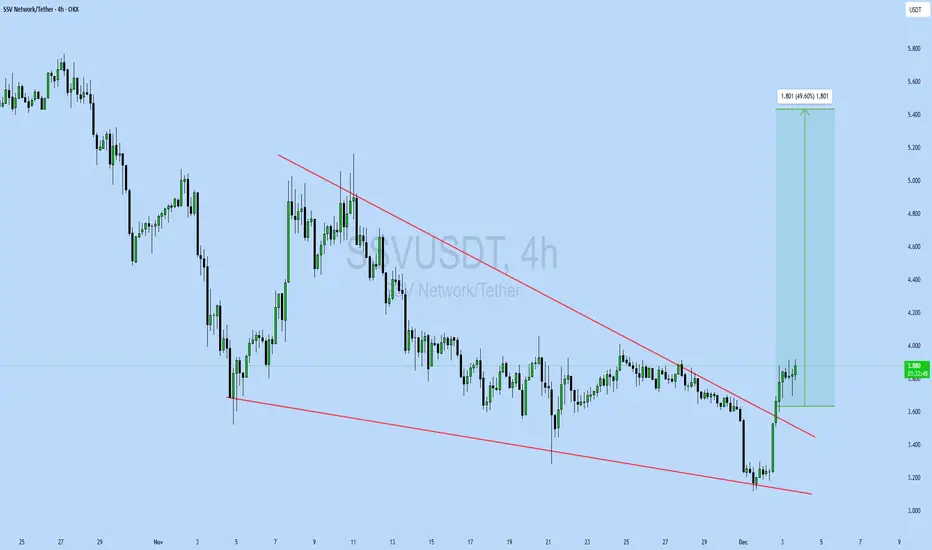
SSVUSDT Forming Falling WedgeSSVUSDT is forming a clear falling wedge pattern, a classic bullish reversal signal that often indicates an upcoming breakout. The price has been consolidating within a narrowing range, suggesting that selling pressure is weakening while buyers are beginning to regain control. With consistent volume confirming accumulation at lower levels, the setup hints at a potential bullish breakout soon. The projected move could lead to an impressive gain of around 70% to 80% once the price breaks above the wedge resistance.
This falling wedge pattern is typically seen at the end of downtrends or corrective phases, and it represents a potential shift in market sentiment from bearish to bullish. Traders closely watching SSVUSDT are noting the strengthening momentum as it nears a breakout zone. The good trading volume adds confidence to this pattern, showing that market participants are positioning early in anticipation of a reversal.
Investors’ growing interest in SSVUSDT reflects rising confidence in the project’s long-term fundamentals and current technical strength. If the breakout confirms with sustained volume, this could mark the start of a fresh bullish leg. Traders might find this a valuable setup for medium-term gains, especially as the wedge pattern completes and buying momentum accelerates.
✅ Show your support by hitting the like button and
✅ Leaving a comment below! (What is your opinion about this Coin?)
Your feedback and engagement keep me inspired to share more insightful market analysis with you!
Traders Will Miss This SSV/USDT Reversal Until It's Too LateYello, did you catch that move off support on #SSVUSD? Because what just happened could be the beginning of a major shift, and latecomers might not get a second chance.
💎#SSVUSDT has been moving inside a clean descending channel, forming lower lows with each leg down, but now the price is bouncing right from the strong support zone that's held firm before. The reaction is already showing strength, and it's happening alongside a bullish divergence on the MACD, with higher lows forming while the price was making new lows. That’s a key early signal that momentum is shifting.
💎This type of confluence doesn’t happen by accident. The market is telling us that the sellers are exhausted, and smart money may already be loading up.
💎The structure is clear: if price breaks above the descending resistance, the next logical targets sit around 4.05, then 4.30, and ultimately 4.70 if momentum really kicks in. On the flip side, a clean break below 3.70–3.60 invalidates this reversal scenario and opens the path back toward 3.50.
Be patient, wait for structure to confirm, and stick to your plan. That’s what keeps you consistent while others chase.
MyCryptoParadise
iFeel the success🌴
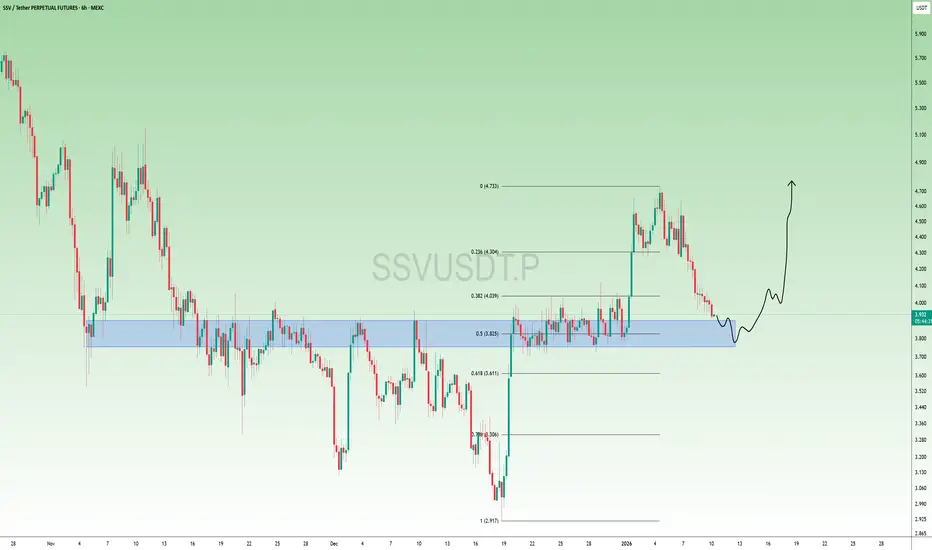
$SSV looks set for another move !!TSXV:SSV looks set for another move 🚀
Price is pulling back into a major support zone around $3.80–$3.90, which previously acted as resistance and now lines up with Fib 0.5, strong horizontal demand, and prior consolidation.
This dip could offer a solid buy-the-dip opportunity if support holds.
A clean bounce from this area opens the door for a push back toward $4.70+, and potentially new highs if momentum returns.
Patience here, support reaction is key 👀
#SSV
SSVUSDT Forming Falling WedgeSSVUSDT is forming a clear falling wedge pattern, a classic bullish reversal signal that often indicates an upcoming breakout. The price has been consolidating within a narrowing range, suggesting that selling pressure is weakening while buyers are beginning to regain control. With consistent volume confirming accumulation at lower levels, the setup hints at a potential bullish breakout soon. The projected move could lead to an impressive gain of around 140% to 150% once the price breaks above the wedge resistance.
This falling wedge pattern is typically seen at the end of downtrends or corrective phases, and it represents a potential shift in market sentiment from bearish to bullish. Traders closely watching SSVUSDT are noting the strengthening momentum as it nears a breakout zone. The good trading volume adds confidence to this pattern, showing that market participants are positioning early in anticipation of a reversal.
Investors’ growing interest in SSVUSDT reflects rising confidence in the project’s long-term fundamentals and current technical strength. If the breakout confirms with sustained volume, this could mark the start of a fresh bullish leg. Traders might find this a valuable setup for medium-term gains, especially as the wedge pattern completes and buying momentum accelerates.
✅ Show your support by hitting the like button and
✅ Leaving a comment below! (What is your opinion about this Coin?)
Your feedback and engagement keep me inspired to share more insightful market analysis with you!
SSVUSDT UPDATE#SSV
UPDATE
SSV Technical Setup
Pattern: Falling Wedge Pattern
Current Price:
Target Price:
Target % Gain: 60.00%
Technical Analysis: SSV is breaking out of a falling wedge pattern on the 1D chart, signaling a potential bullish reversal after a prolonged corrective phase. Price action is beginning to push above the descending resistance trendline, suggesting increasing buyer strength and a possible momentum shift. If the breakout is sustained, continuation toward higher resistance zones becomes likely as volume supports the move.
Time Frame: 1D
Risk Management Tip: Always use proper risk management.
SSVUSDT Forming Falling WedgeSSVUSDT is forming a clear falling wedge pattern, a classic bullish reversal signal that often indicates an upcoming breakout. The price has been consolidating within a narrowing range, suggesting that selling pressure is weakening while buyers are beginning to regain control. With consistent volume confirming accumulation at lower levels, the setup hints at a potential bullish breakout soon. The projected move could lead to an impressive gain of around 90% to 100% once the price breaks above the wedge resistance.
This falling wedge pattern is typically seen at the end of downtrends or corrective phases, and it represents a potential shift in market sentiment from bearish to bullish. Traders closely watching SSVUSDT are noting the strengthening momentum as it nears a breakout zone. The good trading volume adds confidence to this pattern, showing that market participants are positioning early in anticipation of a reversal.
Investors’ growing interest in SSVUSDT reflects rising confidence in the project’s long-term fundamentals and current technical strength. If the breakout confirms with sustained volume, this could mark the start of a fresh bullish leg. Traders might find this a valuable setup for medium-term gains, especially as the wedge pattern completes and buying momentum accelerates.
✅ Show your support by hitting the like button and
✅ Leaving a comment below! (What is your opinion about this Coin?)
Your feedback and engagement keep me inspired to share more insightful market analysis with you!
SSVUSDT 1D#SSV is moving inside a falling wedge on the daily chart. The price has bounced off the wedge support and is now on the verge of breaking out above the pattern. If that happens, the potential targets are:
🎯 $4.352
🎯 $5.119
🎯 $5.738
🎯 $6.358
🎯 $7.240
🎯 $8.363
⚠️ Always remember to use a tight stop-loss and maintain proper risk management.
SSV Looks Bullish (12H)A supply zone has been highlighted on the chart. This supply has been consumed many times, yet no lower low has been formed. Also, from the point where we marked it on the chart, a bullish move started. After this bullish move, the price is currently forming a range. It seems that the initial move is wave A of the new pattern, and the ranging move is wave B.
As long as the green zone holds, the price can move toward the targets. Once the trigger line is broken, we will have further confirmations.
A daily candle closing below the invalidation level will invalidate this analysis.
For risk management, please don't forget stop loss and capital management
When we reach the first target, save some profit and then change the stop to entry
Comment if you have any questions
Thank You
Technical Analysis (SSV/USDT – 4H)1. Pattern
The chart is showing a descending triangle / falling wedge structure (A–B–C–D).
Price has moved up strongly from point C → D, now testing the upper trendline resistance.
If breakout happens above 9.20–9.30, bullish momentum can accelerate.
2. Key Levels
Immediate Resistance: 9.20 – 9.30 (trendline + supply zone).
Next Targets:
TP1 → 9.60
TP2 → 10.20
TP3 → 11.00 (extended breakout target).
Support Levels:
9.00 (short-term EMA + round number).
8.95 (200 EMA).
8.60 (lower wedge support).
3. Indicators
EMA Structure:
Price is trading just above 50 EMA (orange) and 200 EMA (blue) → early bullish signal.
If 50 EMA crosses 200 EMA, trend confirmation will strengthen.
Momentum: Recent bullish candles show strength; watch for volume confirmation.
4. Scenarios
Bullish (High Probability):
Break and close above 9.30 → opens the way to 9.60 → 10.20 → 11.00.
Bearish (Low Probability):
If rejection occurs, price may retest 9.00 → 8.95 support, possibly even 8.60.
📌 Trading Plan
Entry (Aggressive): Current zone (9.15–9.20), anticipating breakout.
Entry (Conservative): Wait for 4H candle close above 9.30.
Stop Loss: Below 8.85 (safe zone under support).
Targets:
🎯 TP1: 9.60
🎯 TP2: 10.20
🎯 TP3: 11.00
✅ Summary:
SSV/USDT is at a decisive point near resistance. A breakout above 9.30 will likely confirm a bullish move toward 10+. Until then, caution advised with a stop below 8.85 to manage risk.
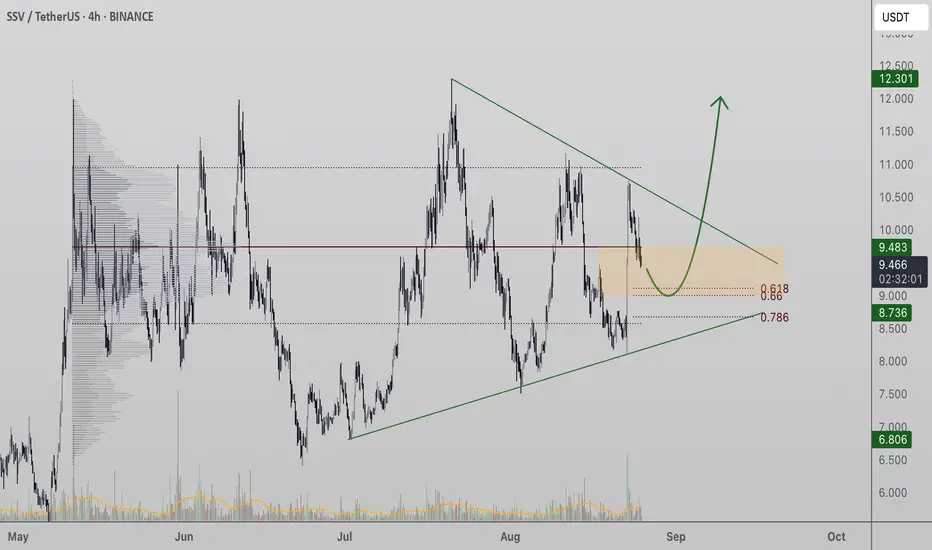
SSV continues to trade within a high timeframe equilibriumSSV continues to trade within a high timeframe equilibrium, with dynamic support and resistance levels gradually converging near the point of control. This compression has formed an apex zone where price action is coiling, setting the stage for a decisive breakout. Despite the tightening range, the broader structure maintains a bullish bias, with consecutive higher highs and higher lows still intact.
Key Technical Points:
- Equilibrium Structure: Dynamic support and resistance levels are converging at the point of control, creating an apex zone.
- 0.618 Fibonacci Support: Price must hold above this retracement level to maintain the higher-low projection.
- Volume Influx: Strong volume activity is occurring at the apex, suggesting accumulation before expansion.
SSV’s current consolidation highlights a balanced battle between buyers and sellers, but the high timeframe structure leans in favor of the bulls. The repeated formation of higher lows and higher highs indicates that demand continues to step in at key levels, while supply is being gradually absorbed at resistance. This equilibrium around the point of control is compressing into an apex — a classic signal that volatility expansion is imminent.
The 0.618 Fibonacci retracement has emerged as a crucial pivot for maintaining the bullish trajectory. If price remains above this support on pullbacks, the integrity of the uptrend will hold, allowing for another rotation higher. Even in the case of a deeper retracement, as long as the dynamic support and high-low projection are respected, the structural bullish case remains intact.
From a volume perspective, strong influxes are already present around the apex, hinting at active accumulation. However, for continuation to the upside and a potential retest of the all-time highs, a decisive breakout must be backed by sustained bullish volume. Without that, the risk of prolonged consolidation remains, but the larger structure still favors eventual continuation higher.
Overall, the price action and market structure are aligned, with technical confluences supporting the case for bullish continuation. The apex compression should soon resolve, and given the prevailing higher timeframe trend, probabilities lean toward an upward breakout.
What to Expect in the Coming Price Action:
SSV is preparing for a breakout from its current apex formation. As long as the 0.618 Fibonacci support and dynamic structure are respected, the bias remains bullish. A volume-backed breakout to the upside would likely target a retest of the all-time highs, while a pullback into dynamic support should be viewed as a potential accumulation opportunity before continuation higher.
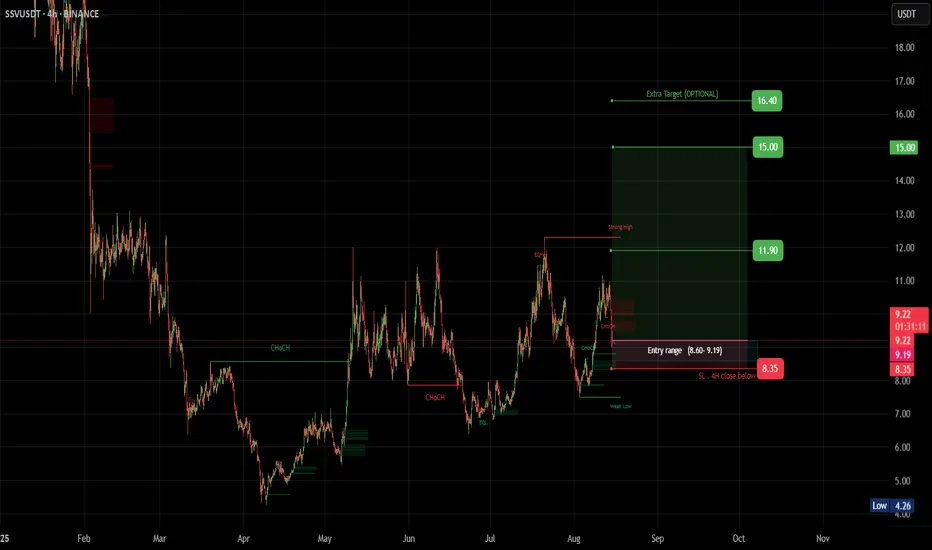
SSV (SPOT)BINANCE:SSVUSDT
#SSV/ USDT
Entry range (8.60- 9.19)
SL 4H close below8.35
T1 11.90
T2 15.00
_______________________________________________________
Golden Advices.
********************
* collect the coin slowly in the entry range.
* Please calculate your losses before the entry.
* Do not enter any trade you find it not suitable for you.
* No FOMO - No Rush , it is a long journey.
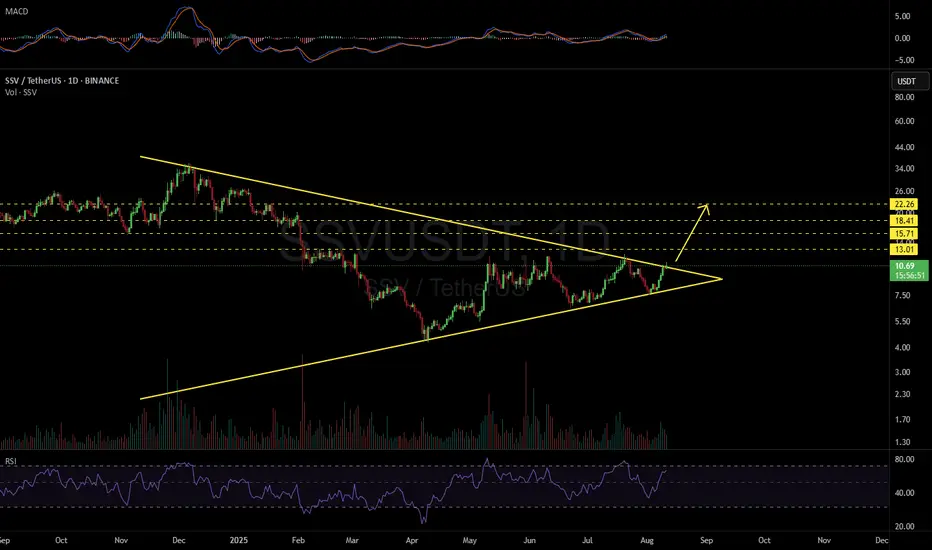
$SSV/USDT has broken out$SSV/USDT has broken out of a key ascending triangle on the daily chart, clearing resistance around $11.90 with strong momentum.
The breakout targets an 84% potential upside toward the $21+ zone.
As long as it holds above the breakout level, the trend remains bullish with further gains likely.
Watch for a retest for possible entry.
DYRO, NFA
SSV | Bullish Market Structure Shift in PlayTSXV:SSV is showing strong bullish momentum. The key resistance line has been broken and successfully retested, confirming a shift in market structure.
Now, price is testing the major resistance zone. For further upside confirmation, it's important to wait for a clear daily close above this resistance zone.
If the breakout holds, this could open the door for the next leg higher. One to keep on your watchlist.
DYOR, NFA
SSV/USDTKey Level Zone: 8.000 - 8.700
HMT v8.1 detected. The setup looks promising, supported by a previous upward/downward trend with increasing volume and momentum, presenting an excellent reward-to-risk opportunity.
HMT (High Momentum Trending):
HMT is based on trend, momentum, volume, and market structure across multiple timeframes. It highlights setups with strong potential for upward movement and higher rewards.
Whenever I spot a signal for my own trading, I’ll share it. Please note that conducting a comprehensive analysis on a single timeframe chart can be quite challenging and sometimes confusing. I appreciate your understanding of the effort involved.
Important Note :
Role of Key Levels:
- These zones are critical for analyzing price trends. If the key level zone holds, the price may continue trending in the expected direction. However, momentum may increase or decrease based on subsequent patterns.
- Breakouts: If the key level zone breaks, it signals a stop-out. For reversal traders, this presents an opportunity to consider switching direction, as the price often retests these zones, which may act as strong support-turned-resistance (or vice versa).
My Trading Rules
Risk Management
- Maximum risk per trade: 2.5%.
- Leverage: 5x.
Exit Strategy
Profit-Taking:
- Sell at least 70% on the 3rd wave up (LTF Wave 5).
- Typically, sell 50% during a high-volume spike.
- Adjust stop-loss to breakeven once the trade achieves a 1.5:1 reward-to-risk ratio.
- If the market shows signs of losing momentum or divergence, ill will exit at breakeven.
The market is highly dynamic and constantly changing. HMT signals and target profit (TP) levels are based on the current price and movement, but market conditions can shift instantly, so it is crucial to remain adaptable and follow the market's movement.
If you find this signal/analysis meaningful, kindly like and share it.
Thank you for your support~
Sharing this with love!
HMT v2.0:
- Major update to the Momentum indicator
- Reduced false signals from inaccurate momentum detection
- New screener with improved accuracy and fewer signals
HMT v3.0:
- Added liquidity factor to enhance trend continuation
- Improved potential for momentum-based plays
- Increased winning probability by reducing entries during peaks
HMT v3.1:
- Enhanced entry confirmation for improved reward-to-risk ratios
HMT v4.0:
- Incorporated buying and selling pressure in lower timeframes to enhance the probability of trending moves while optimizing entry timing and scaling
HMT v4.1:
- Enhanced take-profit (TP) target by incorporating market structure analysis
HMT v5 :
Date: 23/01/2025
- Refined wave analysis for trending conditions
- Incorporated lower timeframe (LTF) momentum to strengthen trend reliability
- Re-aligned and re-balanced entry conditions for improved accuracy
HMT v6 :
Date : 15/02/2025
- Integrated strong accumulation activity into in-depth wave analysis
HMT v7 :
Date : 20/03/2025
- Refined wave analysis along with accumulation and market sentiment
HMT v8 :
Date : 16/04/2025
- Fully restructured strategy logic
HMT v8.1 :
Date : 18/04/2025
- Refined Take Profit (TP) logic to be more conservative for improved win consistency