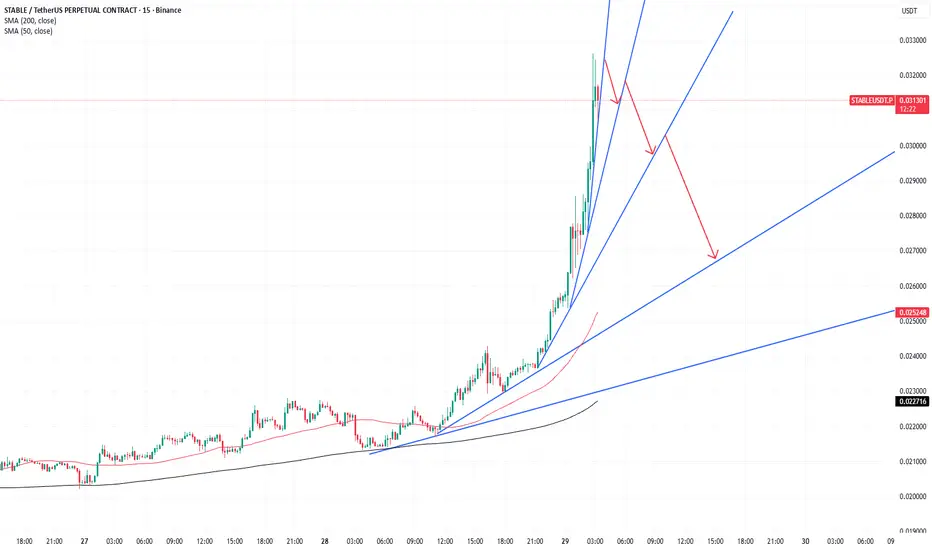
STABLE Price Prediction: Ascending Channel Hints Breakout 🚀 STABLE/USDT Technical Analysis (4H)
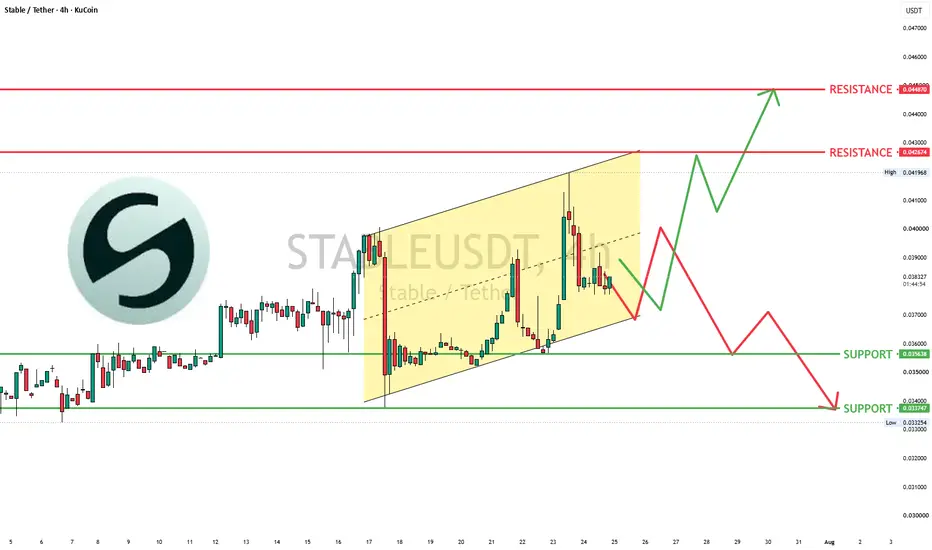
BYBIT:STABLEUSDT is currently trading around $0.03843, down nearly 7.3% over the past 24 hours, but the technical structure still suggests that buyers remain active.
Price continues to respect an ascending channel on the 4-hour timeframe while a larger symmetrical triangle is forming on the daily chart. As long as the rising trendline remains intact, bulls still have an opportunity to regain momentum.
📈 Bullish Scenario
Price continues to hold above the ascending channel support.
A breakout above $0.04267 could trigger fresh buying pressure.
Next upside target sits near $0.04487.
Daily triangle breakout could extend the rally even further if volume increases.
📉 Bearish Scenario
A decisive 4H close below $0.03564 would invalidate the bullish structure.
Sellers could then push price toward $0.03375.
🔍 Key Technical Levels
Support
• $0.03564
• $0.03375
Resistance
• $0.04267
• $0.04487
📊 Market Insight
Price: $0.03843
24H Change: -7.3%
Market Cap: $951.8M
Trading Volume: $11.0M
Despite today's correction, the ascending channel remains technically valid. Bulls need to defend support and reclaim resistance to confirm the next leg higher.
⚠️ Trade with proper risk management. This analysis is for educational purposes only and is not financial advice.
#STABLE #STABLEUSDT
In-depth trading ideas
STABLEUSD UPDATEBYBIT:STABLEUSDT Looks Ready for a Big Move ??? 👀
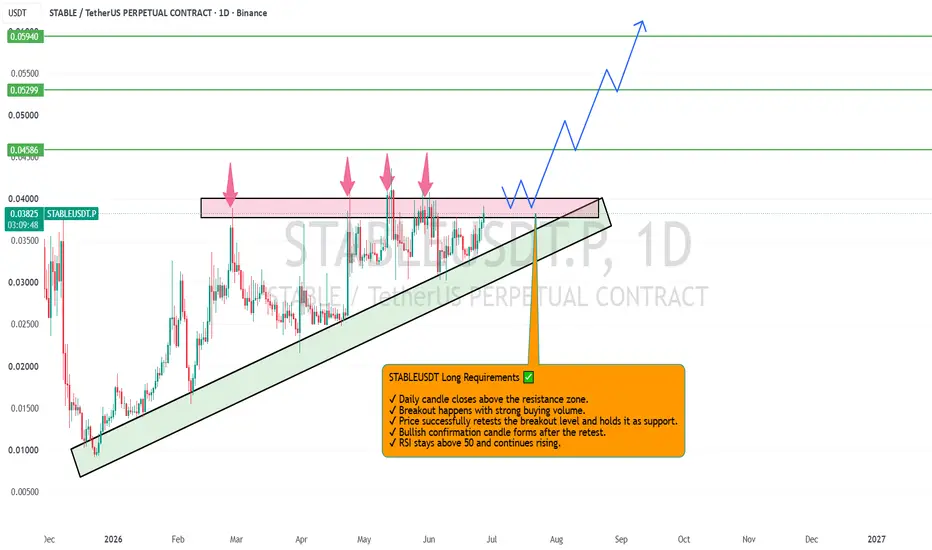
For the past few months, STABLEUSDT has been trading inside a strong ascending structure while repeatedly testing the same resistance zone. Every rejection has become weaker, showing that buyers continue to absorb the selling pressure. This is often the type of price action seen before a breakout.
If the resistance finally breaks with strong volume and a daily candle closes above it, the next move could be much larger than most traders expect. The chart already suggests that momentum is building, and a successful breakout could open the door toward 0.0458, 0.0530, and even 0.0594 in the coming weeks.
I'm not buying before confirmation. I'll wait for a clean breakout or a successful retest before entering. Let the market prove the move first—patience usually pays better than chasing green candles.
#STABLE #Crypto #Binance #Breakout #Altcoins
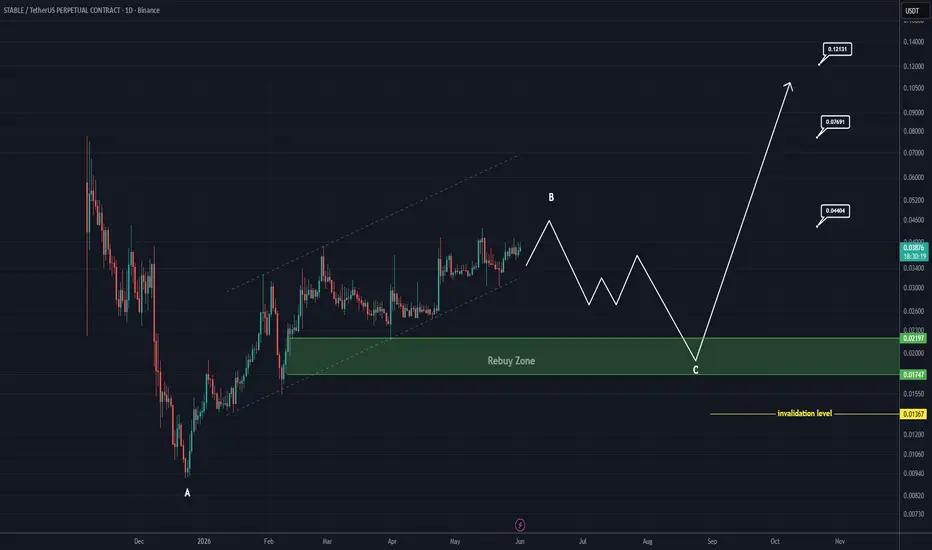
STABLE Roadmap (1D)A flat pattern appears to be forming on STABLE.
Once this pattern is completed, the market may reverse and move in the opposite direction of the pattern. After Wave C is completed within the green zone, price could potentially rebound to the upside.
We are looking for buy/long opportunities within the green zone.
The targets are marked on the chart.
A daily candle close below the invalidation level will invalidate this analysis.
If you have a coin or altcoin you want analyzed, first hit the like button and then comment its name so I can review it for you.
Do you also think STABLE is bullish?
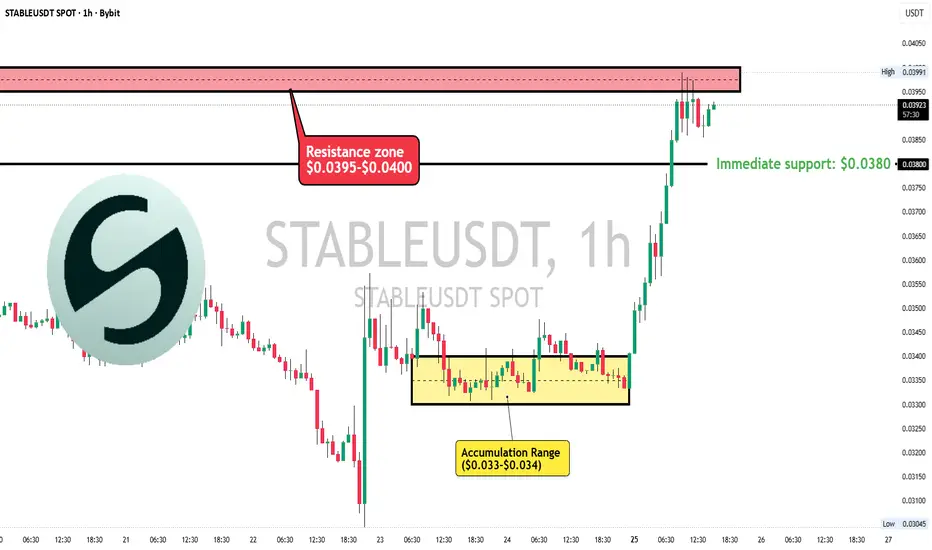
$STABLEUSDT sends through $0.04 next…BYBIT:STABLEUSDT just printed a clean momentum breakout after holding the $0.033-$0.034 accumulation range for multiple sessions 📈
The chart structure shifted bullish once buyers reclaimed the local range highs and pushed price aggressively into the $0.039 resistance level. Momentum expanded fast with strong consecutive green candles, showing clear breakout participation and possible short liquidations near the range top.
Right now, price is consolidating just under the local high around $0.0399, which is important. Bulls are trying to turn previous resistance into support instead of instantly giving back the move — that’s usually a strong sign after impulsive breakouts.
Key levels visible on the chart
• Resistance: $0.0395-$0.0400
• Immediate support: $0.0380
Market structure now favors bulls unless price loses the breakout region and falls back into the old range. The move also came after a long period of choppy sideways trading, which often leads to aggressive expansion once liquidity is taken.
Momentum still looks strong, but traders should watch for short-term cooling after such a vertical push. A healthy retest above $0.038 could build the base for continuation higher 🚀
BYBIT:STABLEUSDT sends through $0.04 next… or do bulls reload on a breakout retest first? 👀
$STABLE Respecting HTF Demand While Compression Continues 🚨 STABLE Respecting HTF Demand While Compression Continues 👀
STABLE continues holding above the rising HTF trendline while price compresses inside the 0.027–0.032 accumulation range. Multiple reactions from the ascending support and repeated defense of discount liquidity suggest buyers are still active despite recent volatility. The chart structure still looks constructive overall, but current price is sitting near mid-range — not the safest place for aggressive longs yet.
The strongest opportunity still comes from a deeper liquidity sweep into the 0.0319–0.0309 discount zone. That area aligns with the trendline support, previous accumulation reactions, and stronger HTF demand. If price flushes lower into that region and quickly reclaims structure with bullish displacement, the probability of continuation toward higher premium liquidity increases significantly.
RSI momentum is cooling while price remains above the main invalidation region, which often supports another expansion leg after liquidity is taken. Current structure looks more like controlled accumulation than bearish continuation, but confirmation still matters before positioning heavily.
For now:
❌ No chasing mid-range
❌ No tight stoploss setups
✅ Deep liquidity entry preferred
✅ Confirmation + reclaim only
Analysis by Leo524.
#STABLE #STABLEUSDT #Crypto #Trading #Leo524
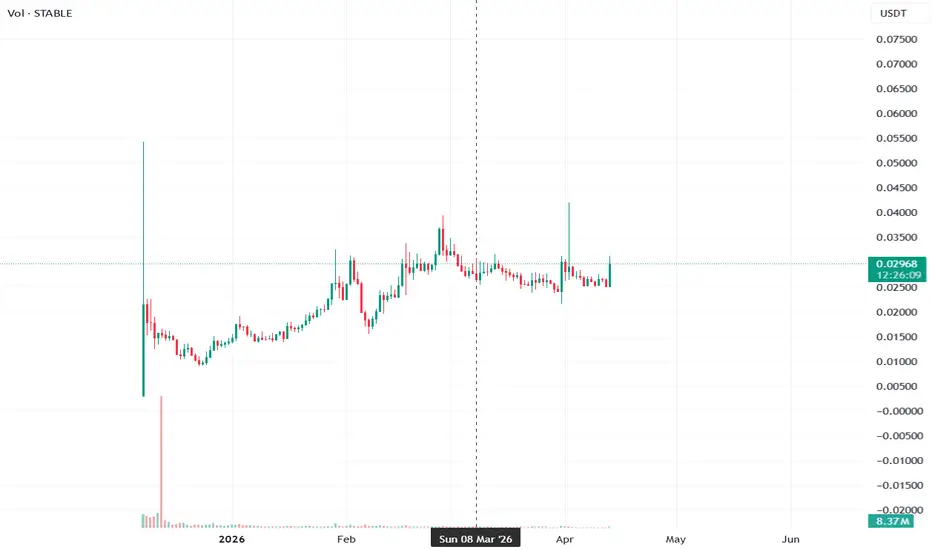
STABLEUSDT- Tight BullSTABLEUSDT is trading at 0.02968 spot against 0.02966 futures with 8.37M volume. Spot flow reads 244.5M against 1.19B futures — roughly a 4.9x ratio — with dollar depth at 7.26M spot versus 35.45M futures. Spot:Fut reads Normal, no manipulation flag, but the futures side is clearly carrying the weight of this market.
25 green to 30 red out of 112 puts the signal board net bearish with bull at only 13.73% at 1.32x and clarity at 49.11%. Bear at 1.3 confirms there is no directional conviction here. EMA is bearish at 2 green to 7 red, Ichimoku TK heavily red at 2 green to 9 red, C>T at 3 green to 10 red. Candle structure is the only relative bright spot at 10 green 4 red. DD/SS reads 2 demand to 1 supply, slight demand edge, but the overall signal board is dominated by red. Squeeze has been building for 42 bars IMMINENT with momentum flipping Bear Up and bandwidth at 23.34% coiling. That is a bear-biased squeeze about to release.
Spot Z at -0.50 steady, futures Z at -0.49 steady, combined at -0.51 quiet. The 5-bar spot trajectory is barely rising from -0.55 to 0.05 — essentially flat. MeanZ at -0.69σ Drift Minus confirms price is drifting below mean with no recovery impulse. Bull:Bear Z at -0.16 to -0.45 is neutral but leaning bear. Spot momentum reads Consolidation Up at 413.6% but flagged Blowoff — meaning the momentum reading is a statistical artifact of low volatility compression, not genuine buying.
Leverage at 4.88x is rising and sitting at 54.5% percentile Mid. Price is at 52% of its full historical range, also Mid. Neither leverage nor price is anywhere near a washout floor — this is a mid-range asset in mid-range leverage conditions with no structural setup forming. AT Max was 8.68x just 51 bars ago, so leverage has partially flushed but not completely.
OBV Z at 0.07 with a flat 5-bar drift from 0.07 to 0.01 is the most honest read on the board — buyers and sellers are exactly balanced, neither side has conviction. No whale activity, no liquidations, no squeeze divergence. The premium is neutral at -0.07% with yield at -74% APY paying longs a mild incentive, but not enough to signal a structural long setup.
The honest read: STABLEUSDT has almost nothing actionable here. A 42-bar squeeze coiling into a bear-biased signal board with flat OBV, mid leverage percentile, mid price percentile, and declining EMA and Ichi structure is not a setup — it is a warning to stay out. The 29.3% retrace risk is real if the squeeze releases to the downside, and the 37.5% bounce at 1.3x balanced is the upside case if buyers materialise. Until the squeeze fires with a clear directional volume catalyst, this is a wait-and-watch chart with no edge in either direction.
Is That Crypto Pump Real? Data Says No. Here's Why.
Stop Losing Money to Fake Volume. Find Real Moves Now.
Trade the REAL Crypto Volume. Stop Getting Faked Out.
Is $STABLE Preparing a Silent Reversal? Price is currently sitting in a discounted region after a pullback from its recent high, but the higher timeframe structure still leans bullish following a previous break of structure. This looks more like a corrective phase rather than a full trend reversal.
Liquidity below the recent lows has already been taken, and the reaction from that zone shows early signs of stabilization. Instead of continuation to the downside, price is holding, suggesting that sell-side pressure may be weakening.
On the positioning side, open interest dropped during the sell-off, indicating that weaker hands were flushed out. This kind of behavior often creates the conditions for a potential rebound if demand steps back in.
I’m mainly watching for a strong reclaim above the mid-range levels. If price shows acceptance and momentum builds, this could transition into a bullish continuation rather than just a temporary bounce.
Analysis by Leo524.
#STABLE #Crypto #Leo524
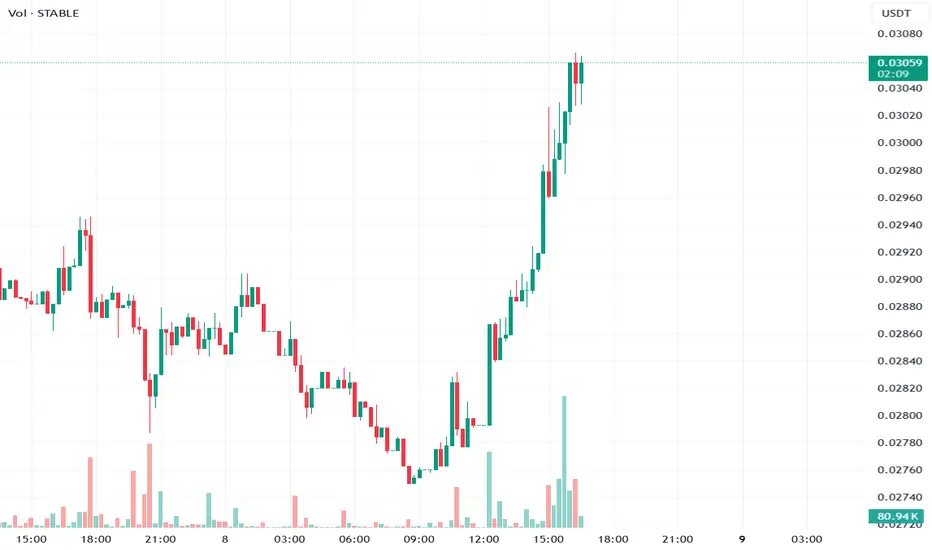
STABLEUSDT Extreme Bull Signal Price is at 0.03058 with futures at 0.03051, a near-flat basis. The directional reading is the highest on the board today — extreme bull at 75.34% at 7.11x with 87.7% green across 112 signals. EMA row is 6 green zero red. Candle signals 12 green versus 2 red. Pattern total 4 green zero red. 3Sold 4 green zero red. On signal strength alone this is about as one-sided as it gets.
The squeeze is elevated at 6 bars with a spot squeeze divergence reading of Spot Fire Real — meaning the spot squeeze specifically has fired while futures has not. That split is meaningful. It points to spot-driven pressure building without futures speculation layering on top. The 96.8% bounce at 4.3x is a breakout attempt in progress.
Now the volume reality. Spot Z at -0.67 quiet. Futures Z at -0.78 quiet. Combined at -0.78 quiet. Momentum is zero falling. OBV at 0.06 with outflow. Bull Bear Z both negative at -0.44 and -0.50. The entire volume stack is below average and falling. Squeeze momentum contracting at 309%.
This is the sharpest signal-versus-volume divergence in today's scan. 88% bull signals on zero volume. The spot squeeze firing real is a spark with no fuel behind it yet. Leverage at 23.7% floor is clean, liquidations clear, no structural risk — the setup is not in danger of collapsing. It simply has not been discovered yet.
When volume arrives on a setup with 88 green signals already aligned, the move tends to be fast. The trigger to watch is spot Z crossing above 1.0 with OBV flipping to inflow. Until then this is the most loaded gun on the board with nobody pulling the trigger.
Is That Crypto Pump Real? Data Says No. Here's Why.
Stop Losing Money to Fake Volume. Find Real Moves Now.
Trade the REAL Crypto Volume. Stop Getting Faked Out.
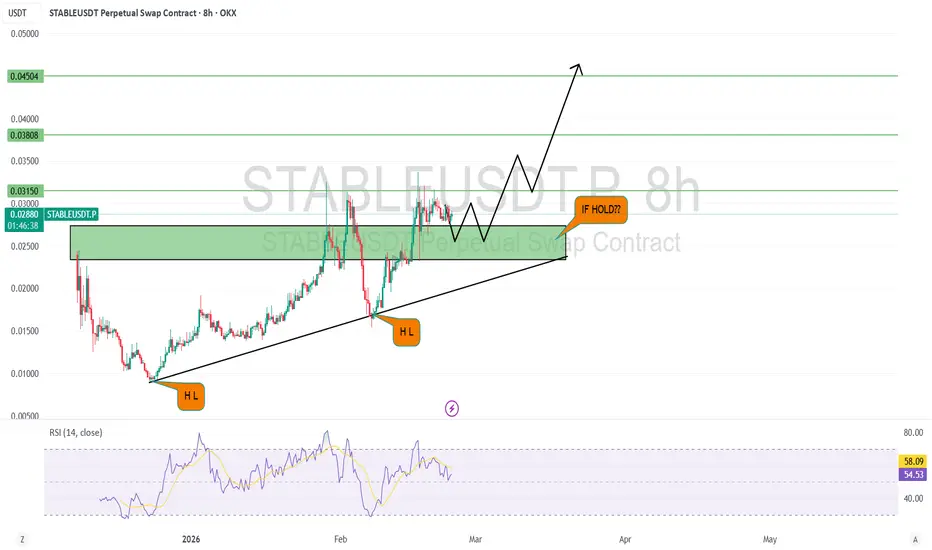
$STABLE 8H — Higher Lows + Demand Hold, Upside Building?
📌On the higher timeframe, price structure is forming consistent higher lows — early sign of bullish trend development ✅
📌On 4H/8H, the market is consolidating above a key demand zone, showing buyers are defending this level strongly ✅
📌This consolidation phase looks like accumulation rather than distribution, with price holding structure well ✅
📌RSI is neutral, giving enough room for a potential upside expansion without being overbought ✅
📌No visible bearish pressure or breakdown signals at the moment — market stability supports continuation potential ✅
📌If the demand zone continues to hold, a move toward higher resistance levels becomes increasingly likely ✅
📌Final outlook: Structure bullish + demand hold = strong probability of upside continuation 🔥📈
STABLE is getting ready for a breakoutThe cup&handle pattern is a bullish one and so am I.
If STABLE is capable of taking the resistance (currently around 0.033), it opens the path to a speedy pump. The bulls need to take the challenge and get more aggressive or else a deeper correction will wipe out a lot of the profits here.
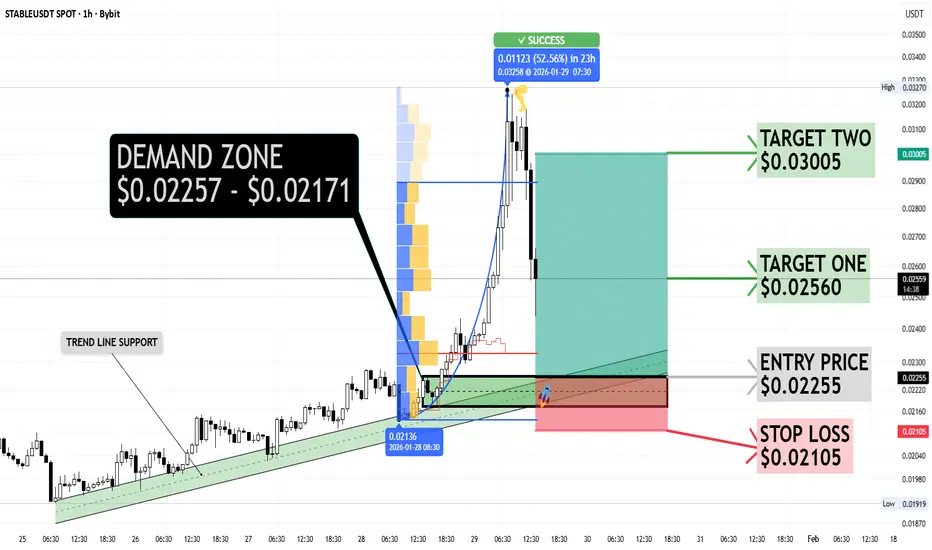
STABLEUSDT QUICK ANALYSIS (1H)BYBIT:STABLEUSDT (1H) respected a well-defined ascending trendline before launching into a strong impulsive rally (~52%), backed by heavy trading volume ($106M)—a clear sign of strong buyer interest. The move is now followed by a healthy pullback, not a trend breakdown.
Price is currently retracing into a high-confluence demand zone at $0.02257 – $0.02171, aligning with prior structure and trendline support.
With only 17.6B of 100B tokens in circulation, price remains highly reactive to order flow—holding this zone favors continuation higher, while a breakdown could open the door for a deeper retracement.
🎯 Key Levels
Entry Zone: ~$0.02255
Demand Zone: $0.02257 – $0.02171
Stop Loss: $0.02105 (below structure & demand)
Upside Targets:
🏹 Target 1: $0.02560
🏹 Target 2: $0.03005
$STABLE/USDT (4H) update: Price flipped the script. The 50 EMA $STABLE/USDT (4H) update:
Price flipped the script. The 50 EMA that was acting as a ceiling near 0.0115 got cleanly reclaimed, and that breakout triggered an aggressive move. Momentum followed through fast, sending price up more than 64%.
This is a classic structure shift. What was resistance is now likely to act as support. As long as price holds above the former EMA zone, the breakout remains valid and dips are corrective, not bearish.
STABLEUSDT | Perfect C&H FormationHello traders,
A perfect C&H formation is always welcome to see on our charts. Pretty simple with a very good R:R
What you want to look for as a TP target is the same depth of the cup.aka.distance from SH to SL.
Good Luck!
All our analysis is shared with honesty, care, and real effort. If you find value in it, a like or comment means a lot to show your support🙏📊
STABLE Looks Bullish (4H)A large portion of the trading wick has been filled. The price has moved back upward and is now trading on a key level. A bullish CH (Change of Character) has also formed.
Alongside these bullish signals, a 3D pattern is visible, indicating the liquidation of sellers.
We have identified two entry points; if the price pulls back to these levels, we will enter the position using DCA.
Targets are marked on the chart.
Do not enter the position without capital management and stop setting
Comment if you have any questions
thank you
$STABLE/USDT (4H) Price is trading below the 50 EMA$STABLE/USDT (4H) Price is trading below the 50 EMA, which is acting as a strong resistance around 0.0115. As long as this level caps price, upside remains limited. On the downside, 0.0091 is the key support zone. Holding above this support keeps the structure intact, while a breakdown would signal further weakness.