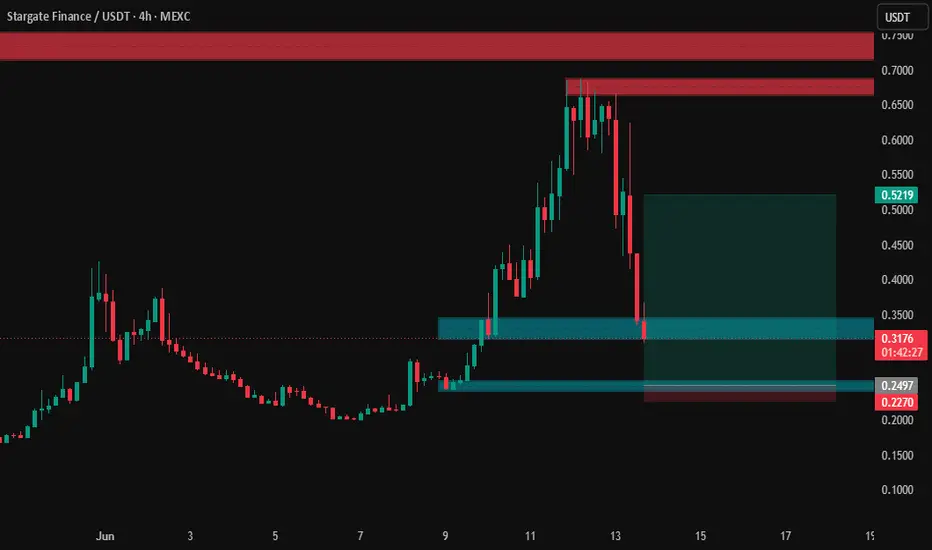
STG/USDT (30M) Short Idea | Major Displacement & Imbalance Retes📊 Asset: STG/USDT (30m)
🐻 Direction: Short
Analyzing the 30M timeframe, we observe a significant downward displacement (Displacement Core) on STG. This sharp bearish drive invalidated market structure and created multiple substantial Key Imbalances (Fair Value Gaps).
Following the displacement, th
Compare with STG/USDT
STG USDT LONG SIGNAL#75. STG/USDT – Trade Setup (LONG)
📈 Position Type: LONG
🕒 Timeframe: 1H
📊 Market: Futures
💰 Entry Zone:
0.1358
🛑 Stop-Loss:
0.13
🎯 Take-Profit Targets:
• TP1: 0.1411
• TP2: 0.1464
• TP3: 0.1519
• TP4: 0.1565
⚙️ Leverage:
10
▫️ After TP1, move SL to Entry + 0.2%.
▪️ Exit Plan:
• 40
STGUSDT - Bear Flag, Continue the Downtrend or Rebound?STGUSDT is currently trading within a Bear Flag, a classic bearish continuation pattern formed after a sharp decline (flagpole), followed by a temporary consolidation inside an ascending channel. 📉📈
This pattern suggests that the current upward movement is likely just a temporary retracement before
STG near unbreakable resistanceHello Traders!
STG is at very strong resistance level and its very hard to break this level for now. So it is ready for a dive.
Target 0.1732 (+8%)
Stoploss 0.1908(-1.3%)
My goal is to be recognized as one of the highest win-rate traders in the TradingView community. :)
Trade Analysis Based on
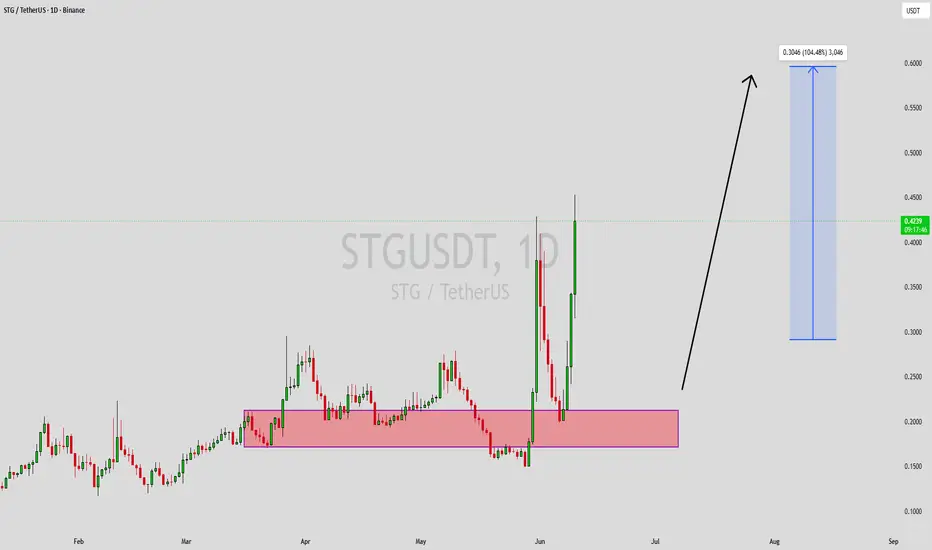
STGUSDT Forming Bullish MomentumSTGUSDT is forming a clear bullish momentum pattern, a classic bullish wave signal that often indicates an upcoming breakout. The price has been consolidating within a tightening range, suggesting that selling pressure is gradually weakening while buyers are beginning to regain control. With steady
STGUSDT Forming Bullish MomentumSTGUSDT is forming a clear bullish momentum pattern, a classic bullish wave signal that often indicates an upcoming breakout. The price has been consolidating within a narrowing range, suggesting that selling pressure is weakening while buyers are beginning to regain control. With consistent volume
STG/USD: Strong Positive Divergence Against Market DowntrendAnalysis Period: Jan 21 - Jun 10 (140 Days)
Position Status: Active / Highly Profitable (+115.18% ROI)
Performance Summary
Entry Price (Cost Basis): $0.1666
Current Market Price: $0.3585
Holding Period: 140 Days (~4.5 Months)
Net Absolute Change: +$0.1919 per token
Total Return on Investment: +115
See all ideas
Summarizing what the indicators are suggesting.
Oscillators
Neutral
SellBuy
Strong sellStrong buy
Strong sellSellNeutralBuyStrong buy
Oscillators
Neutral
SellBuy
Strong sellStrong buy
Strong sellSellNeutralBuyStrong buy
Summary
Neutral
SellBuy
Strong sellStrong buy
Strong sellSellNeutralBuyStrong buy
Summary
Neutral
SellBuy
Strong sellStrong buy
Strong sellSellNeutralBuyStrong buy
Summary
Neutral
SellBuy
Strong sellStrong buy
Strong sellSellNeutralBuyStrong buy
Moving Averages
Neutral
SellBuy
Strong sellStrong buy
Strong sellSellNeutralBuyStrong buy
Moving Averages
Neutral
SellBuy
Strong sellStrong buy
Strong sellSellNeutralBuyStrong buy
Displays a symbol's price movements over previous years to identify recurring trends.
Frequently asked questions
The current price of Stargate Finance / USDT (STG) is 0.1188 USDT — it has fallen −0.56% in the past 24 hours. Try placing this info into the context by checking out what coins are also gaining and losing at the moment and seeing STG price chart.
Stargate Finance / USDT price has fallen by −9.39% over the last week, its month performance shows a −28.30% decrease, and as for the last year, Stargate Finance / USDT has decreased by −29.07%. See more dynamics on STG price chart.
Keep track of coins' changes with our Crypto Coins Heatmap.
Stargate Finance / USDT (STG) reached its highest price on Apr 2, 2022 — it amounted to 4.3380 USDT. Find more insights on the STG price chart.
See the list of crypto gainers and choose what best fits your strategy.
Stargate Finance / USDT (STG) reached the lowest price of 0.1044 USDT on Dec 31, 2025. View more Stargate Finance / USDT dynamics on the price chart.
See the list of crypto losers to find unexpected opportunities.
The safest choice when buying STG is to go to a well-known crypto exchange. Some of the popular names are Binance, Coinbase, Kraken. But you'll have to find a reliable broker and create an account first. You can trade STG right from TradingView charts — just choose a broker and connect to your account.
Crypto markets are famous for their volatility, so one should study all the available stats before adding crypto assets to their portfolio. Very often it's technical analysis that comes in handy. We prepared technical ratings for Stargate Finance / USDT (STG): today its technical analysis shows the strong sell signal, and according to the 1 week rating STG shows the sell signal. And you'd better dig deeper and study 1 month rating too — it's sell. Find inspiration in Stargate Finance / USDT trading ideas and keep track of what's moving crypto markets with our crypto news feed.
Stargate Finance / USDT (STG) is just as reliable as any other crypto asset — this corner of the world market is highly volatile. Today, for instance, Stargate Finance / USDT is estimated as 5.49% volatile. The only thing it means is that you must prepare and examine all available information before making a decision. And if you're not sure about Stargate Finance / USDT, you can find more inspiration in our curated watchlists.
You can discuss Stargate Finance / USDT (STG) with other users in our public chats, Minds or in the comments to Ideas.