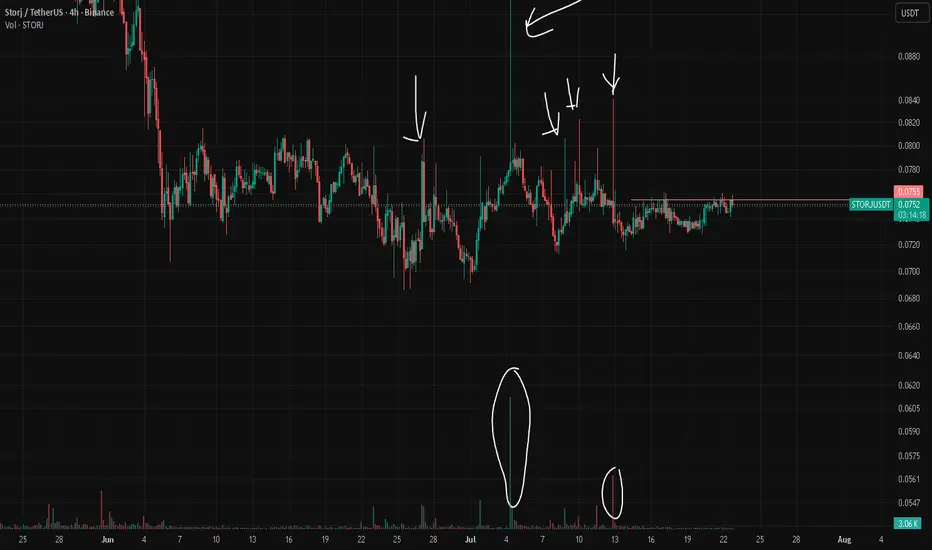
Coin STORJ for position, but …STORJ looks like a potential long after a breakout above 0.0756 on the 4H timeframe.
If that level gets cleared, we could see bullish continuation and a move to the upside.
Suggested stop-loss: around 0.0740.
However… this coin is a special case.
I don’t recommend trading coins like this, especially if you’re managing larger capital.
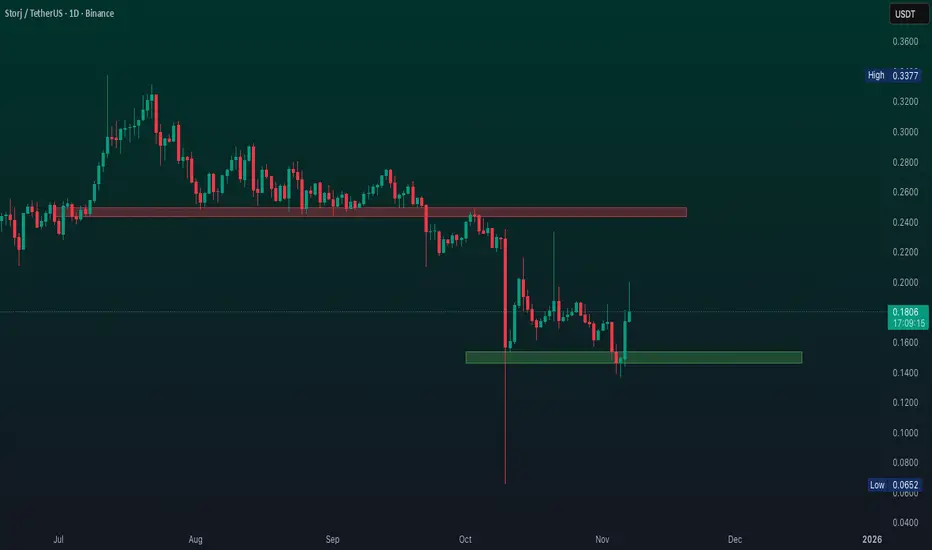
On my chart, I’ve marked some very unusual wicks and volume spikes—and there’s even more of that behavior. It’s quite clear that market makers are actively manipulating this asset.
Because of that, the probability of getting stopped out—or even liquidated—is very high on this coin.
So it’s better to avoid trading assets like this altogether.
But if you still decide to trade it:
Make sure your position is isolated
Always use a stop-loss
Keep your position size relatively small
You can compensate with leverage (that’s what leverage is for 😄)
Also, pay close attention to your liquidation level.
You don’t want to get liquidated before your stop-loss is triggered—that completely breaks your risk management and can lead to bigger losses than expected.
Make sure your stop-loss order is set to market, so your position actually closes when triggered.
In-depth trading ideas
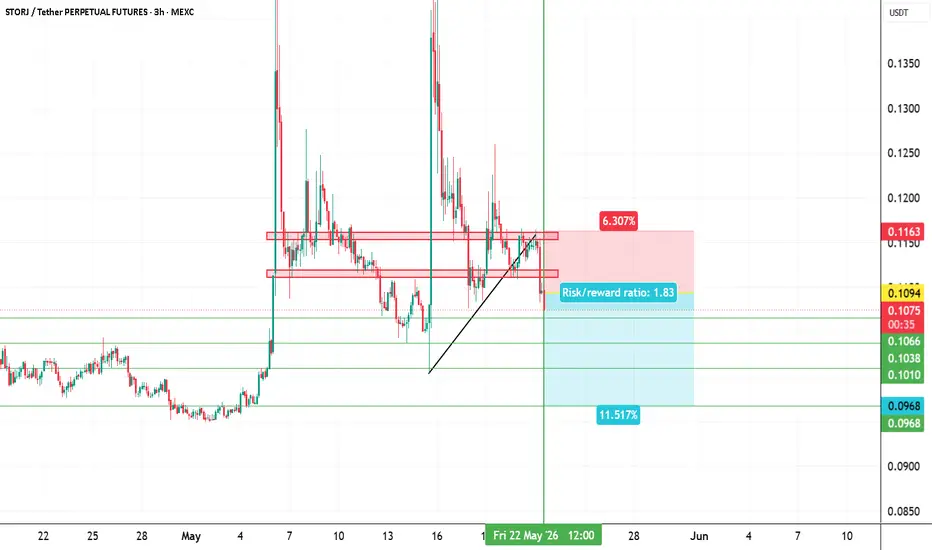
storjusdt short Roddy01-SIGNALSPROVIDERInstructions:
Entry point: yellow
Stop loss: red
Take profit: green
👉Leverage x 5-10-20 for crypto
👉Leverage x 20-50-100 for commodities, stocks, indices, and forex
👉Margin 1-5% max.
Always practice risk and money management.
Invest a maximum of 5% on any trade or across all your trades.
Invest only what you can afford to lose, as no one is in control of the market.
👉Our analyses are primarily based on:
breakouts: two trend lines (ascending and descending) and a line indicating a horizontal breakout.
chart patterns: shoulders and head, triangle parttern, elliott impulse, etc etc.
We don't always have the time to track them at all times or to represent them visibly, given the numerous signals, the number of channels to manage, and especially because of the often rapid pace of market movements.
indicators: We associate at least two indicators with this technique.
👉Depending on the circumstances, we use specific indicators, often setting 3 or more take profit levels.
👉Indeed, there are good days in trading and also bad days. No one can promise to win every trade, and like all traders worldwide, we also experience stop-loss orders. However, we win more than we lose and remain positive.
👉You can close the position before or after the take profit orders indicated by the green lines if you are personally satisfied; the same applies to stop loss orders.
👉We must stay positive, clear-headed, and humble.
we cannot provide all instructions or all trades here on this channel.
Good luck to us all, and may God guide us. Amen.
STORJ/USDT — Breakout or Rejection?The STORJ/USDT 2D timeframe chart is still moving within a major downtrend structure since its previous peak around 0.73 USDT 📉. A clear descending trendline continues to pressure the price for months, indicating that sellers are still dominating the market in the medium to long term ⚠️
However, things are starting to get interesting 👀 as the price is now approaching a key area and attempting to push back toward the trendline resistance. This movement could become the early phase of a structural reversal if a breakout gets confirmed 🚀
━━━━━━━━━━━━━━━━━━
📉 Pattern Formation
🔻 Descending Resistance Trendline
The yellow descending trendline drawn from previous highs represents the main dynamic resistance zone 📐
As long as price remains below this line:
- 🔴 The primary trend remains bearish
- 🐻 Sellers still control the market
- 📉 Any upside move could only be a relief rally
But if a breakout occurs:
- 🟢 It could become an early trend reversal signal
- 📈 The lower-high structure may start breaking
- 🚀 Bullish momentum could increase significantly
━━━━━━━━━━━━━━━━━━
🟢 Bullish Scenario
✅ Bullish Confirmation If:
Price manages to break out and close strongly above:
- 📌 The 0.1220 area
- 📌 The main descending resistance trendline
If a valid breakout occurs, the next upside targets could potentially be:
🎯 Bullish Targets:
- 🚀 0.1450
- 🚀 0.1610
- 🚀 0.1867
- 🚀 0.2270
- 🚀 0.2508
These areas are important horizontal resistance zones that previously acted as supply and rejection levels ⚠️
📌 Bullish momentum would become stronger if:
- 📊 Volume increases during the breakout
- 🕯️ Breakout candles remain solid without major rejection wicks
- 🔄 Price successfully retests the trendline and holds above it
━━━━━━━━━━━━━━━━━━
🔴 Bearish Scenario
❌ Bearish If Breakout Fails
If price gets rejected again at the trendline resistance and fails to break above it:
- 📉 The downtrend will likely continue
- 🐻 Sellers may push the price back toward lower support levels
🎯 Downside Targets:
- 🔻 0.1000
- 🔻 0.0860
- ⚠️ Potentially creating a new lower low if the crypto market weakens further
📌 Watch out for fake breakouts or strong rejection around the 0.1220 area, as this zone is becoming the key decision point for the next major move 🚨
━━━━━━━━━━━━━━━━━━
🔍 Conclusion
STORJ is currently at a very crucial phase after experiencing a prolonged bearish trend 📉
The chart structure shows potential for a breakout from the major descending trendline, but confirmation is still needed ⚠️
✅ A valid breakout could open opportunities for a medium-term reversal with significant upside potential
❌ Meanwhile, a failed breakout would maintain the long-standing bearish dominance
📌 The trendline area and the 0.1220 resistance level are key zones traders should closely monitor in the next few candles 👀🔥
━━━━━━━━━━━━━━━━━━
#STORJ #STORJUSDT #Crypto 🚀 #Cryptocurrency #TradingView #Altcoin #TechnicalAnalysis 📊 #CryptoTrading #Breakout #Bullish 📈 #Bearish 📉 #PriceAction #SupportResistance #Trendline #Altseason #Trader #ChartAnalysis #CryptoMarket #Bitcoin #Altcoins 🔥
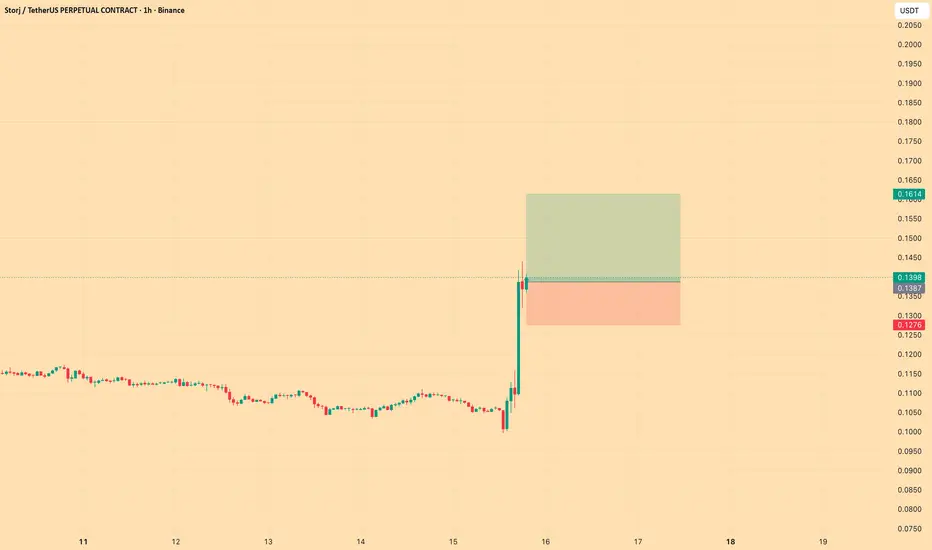
storjusdt long Roddy01-SIGNALSPROVIDERInstructions:
Entry point: yellow
Stop loss: red
Take profit: green
👉Leverage x 5-10-20 for crypto
👉Leverage x 20-50-100 for commodities, stocks, indices, and forex
👉Margin 1-5% max.
Always practice risk and money management.
Invest a maximum of 5% on any trade or across all your trades.
Invest only what you can afford to lose, as no one is in control of the market.
👉Our analyses are primarily based on:
breakouts: two trend lines (ascending and descending) and a line indicating a horizontal breakout.
chart patterns: shoulders and head, triangle parttern, elliott impulse, etc etc.
We don't always have the time to track them at all times or to represent them visibly, given the numerous signals, the number of channels to manage, and especially because of the often rapid pace of market movements.
indicators: We associate at least two indicators with this technique.
👉Depending on the circumstances, we use specific indicators, often setting 3 or more take profit levels.
👉Indeed, there are good days in trading and also bad days. No one can promise to win every trade, and like all traders worldwide, we also experience stop-loss orders. However, we win more than we lose and remain positive.
👉You can close the position before or after the take profit orders indicated by the green lines if you are personally satisfied; the same applies to stop loss orders.
👉We must stay positive, clear-headed, and humble.
we cannot provide all instructions or all trades here on this channel.
Good luck to us all, and may God guide us. Amen.
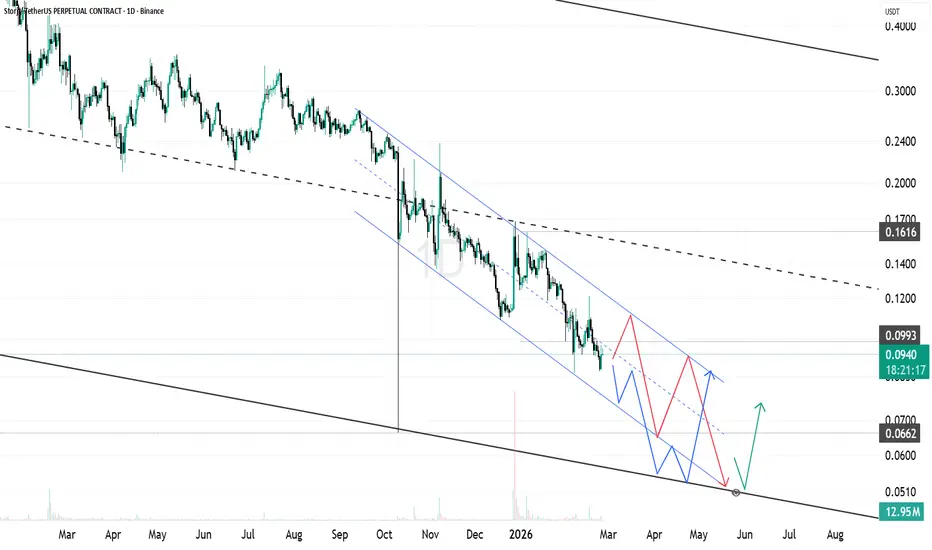
STORJ Deep in Descending Channel, Approaching Major SupportSTORJ continues to respect a well defined macro descending channel on the daily timeframe. Price has been printing consistent lower highs and lower lows, confirming that the dominant trend remains bearish.
Currently, price is trading inside a smaller falling channel within the broader structure. This layered bearish formation increases the probability of one more downside sweep before any meaningful recovery.
The key reaction zone sits around 0.051 to 0.055, which aligns with the lower boundary of the macro channel. If price taps this area, it could act as a liquidity sweep and potential exhaustion point.
Immediate resistance stands near 0.093, followed by 0.1616, which aligns with the dashed higher timeframe trendline. A clean breakout and reclaim of 0.099 would be the first sign of structural shift and open room for a move toward 0.12 and beyond.
However, as long as price remains inside the descending channel and below 0.093, rallies are technically corrective within a larger downtrend.
Right now, structure favors continuation until proven otherwise.
Major support is near.
Reaction there will determine whether STORJ forms a base or extends the bearish cycle.
STORJ 1W — From $1 Dump to Bottom Zone… Reversal Loading?
📌STORJ has faced two major rejections from the long-term descending trendline, dropping sharply from the $1 region down to the $0.10 range ✅
📌After the heavy sell-off, price is now consolidating inside a strong weekly support zone where selling pressure is slowing down ✅
📌This area is acting as an accumulation range, showing signs that the market is trying to form a base ✅
📌If the support zone continues to hold and price breaks above the descending trendline, it could trigger a strong bullish recovery move ✅
📌Next upside targets would be the mid resistance levels first, followed by a potential retest of higher HTF zones if momentum builds ✅
📌Final outlook: Support hold + trendline breakout = high probability upside reversal for STORJ 🔥📈
STORJ : Retail is Shorting, Whales are Buying. Squeeze Incoming🔥 Fortune AI Radar — CRYPTOCAP:STORJ
Fresh activity detected on CRYPTOCAP:STORJ today.
Data suggests increasing market interest & buyers stepping in.
Technicals currently lean bullish, with momentum trending upward.
Whales showing hints of accumulation and hype rising among trader
STORJ READY FOR 10X🔥 Fortune AI Radar — CRYPTOCAP:STORJ
Fresh activity detected on CRYPTOCAP:STORJ today.
Data suggests increasing market interest & buyers stepping in.
Technicals currently lean bullish, with momentum trending upward.
Whales showing hints of accumulation and hype rising among traders.
This coin is flashing strong signals on short-term charts — worth keeping an eye on 👀
Not financial advice — always research before taking decisions
$STORJ at a Long-Term Patience Zone
📌This is a weekly (1W) long-term chart, showing the bigger picture
📌Price has seen a massive dump from around $1.00 → $0.14 over the last 2 years 📉
📌After a long downtrend:
✔️ Price is now sitting inside a strong green support zone 🟩
✔️ This zone is acting as major demand
📌Important things to watch 👀
👉 Support must hold to avoid further downside
👉 Price needs a clear breakout above the descending trendline for bullish confirmation
📌If support holds + trendline breaks:
✔️ Gradual upside move possible 📈
✔️ Trend reversal structure can start forming
📌Final thought:
This is a patience zone, not FOMO.
Long-term setups always take time ⏳
STORJUSDT Forming Falling WedgeSTORJUSDT is forming a clear falling wedge pattern, a classic bullish reversal signal that often indicates an upcoming breakout. The price has been consolidating within a narrowing range, suggesting that selling pressure is weakening while buyers are beginning to regain control. With consistent volume confirming accumulation at lower levels, the setup hints at a potential bullish breakout soon. The projected move could lead to an impressive gain of around 90% to 100% once the price breaks above the wedge resistance.
This falling wedge pattern is typically seen at the end of downtrends or corrective phases, and it represents a potential shift in market sentiment from bearish to bullish. Traders closely watching STORJUSDT are noting the strengthening momentum as it nears a breakout zone. The good trading volume adds confidence to this pattern, showing that market participants are positioning early in anticipation of a reversal.
Investors’ growing interest in STORJUSDT reflects rising confidence in the project’s long-term fundamentals and current technical strength. If the breakout confirms with sustained volume, this could mark the start of a fresh bullish leg. Traders might find this a valuable setup for medium-term gains, especially as the wedge pattern completes and buying momentum accelerates.
✅ Show your support by hitting the like button and
✅ Leaving a comment below! (What is your opinion about this Coin?)
Your feedback and engagement keep me inspired to share more insightful market analysis with you!
STORJUSDT UPDATESTORJ
UPDATE
STORJ Technical Setup
Pattern: Bullish Wave Pattern
Current Price: $0.1510
Target Price: $0.3050
Target % Gain: 102.65%
Technical Analysis: STORJ is showing a bullish wave pattern forming on the 1D chart, indicating potential upside momentum. After holding above recent support levels around $0.11–$0.12 and showing strength in moving averages and technical readings, price could continue climbing toward the projected target zone. Volume expansion and tightening price action suggest buyers may be accumulating near structural levels.
Time Frame: 1D
Risk Management Tip: Always use proper risk management.
STORJUSDT 1D#STORJ has spiked to the long-term descending resistance with strong volume on the daily chart, but has faced a rejection for now. Keep an eye on it — it looks promising. Consider buying only after a solid breakout. In that case, the potential targets are:
🎯 $0.2601
🎯 $0.2922
🎯 $0.3242
🎯 $0.3697
🎯 $0.4278
⚠️ Always remember to use a tight stop-loss and maintain proper risk management.
STORJ/USDT — Decisive Zone: Reversal or Breakdown?Current Situation:
STORJ/USDT is trading around 0.2523 USDT, sitting right on top of a multi-year support zone (0.17 – 0.33 USDT).
This is not just any technical level—it has acted as a foundation for price action multiple times since 2019.
Every dip into this zone has historically triggered demand and rebounds. However, this time things look different:
Price has been consolidating at support for a longer time.
Lower highs since the 2021 peak signal ongoing seller pressure.
The market is now at a critical decision point: Will STORJ bounce strongly, or will it finally lose its historical support?
---
🔹 Price Structure & Pattern
Base/Accumulation Zone: The yellow area (0.17 – 0.33) is a long-term demand zone. Holding here could lead to a major reversal.
Bearish Pressure: Larger structure still points to a long-term downtrend.
Confirmation: A weekly close above 0.3328 would be the first real bullish signal.
---
🔸 Bullish Scenario (Bounce from Support)
1. Condition: Weekly candle closes above 0.3328 with solid volume → sign buyers are back.
2. Targets:
0.4532 (first resistance)
0.7160 (psychological target)
1.0442 (major resistance, trend reversal zone)
3. With strong momentum, higher levels are possible: 2.1956 → 3.2388.
📈 Upside potential from 0.2523:
to 0.3328 → +31.9%
to 0.4532 → +79.6%
to 0.7160 → +183.8%
to 1.0442 → +313.9%
(These can be used as staged profit targets for swing/position traders.)
---
🔸 Bearish Scenario (Breakdown of Support)
1. Condition: Weekly close below 0.17 → signals a breakdown of the historical support.
2. Implication: Likely continuation of the long-term downtrend, targeting 0.12 → 0.0451 (all-time low).
3. Be cautious of breakdown + retest: price may dip below support, retest the zone (0.17–0.20) as new resistance, and continue lower.
📉 Downside potential from 0.2523:
to 0.17 → −32.6%
to 0.12 → −52.4%
to 0.0451 → −82.1%
---
🔹 Key Insights
The 0.17 – 0.33 zone is the "golden area": either the base of a multi-month reversal or the floor that gives way to new lows.
Conservative traders should wait for confirmation above resistance before entering aggressively.
Aggressive traders may accumulate at support with a tight SL below 0.17.
Risk management is crucial: the potential rewards are large, but so are the risks.
---
📌 Conclusion
STORJ is at a make-or-break level.
If support holds → rally potential toward 1.0+ USDT and beyond.
If it fails → downside continuation opens targets at 0.12 and possibly 0.0451.
The market is waiting to see who wins: buyers defending historical accumulation or sellers pressing for a deeper breakdown.
---
#STORJ #STORJUSDT #Crypto #Altcoin #PriceAction #SupportResistance #TechnicalAnalysis #Breakout #Bearish #Bullish
storjusdt buy opportunitySTORJUSDT is forming a classic double bottom within a symmetrical triangle structure. Price is currently reacting from the highlighted accumulation zone, which aligns with a strong demand area. The immediate objective is a move toward $0.525, the triangle’s upper boundary, where minor rejection is anticipated. A successful breakout above this level will shift focus to the double bottom neckline, with the final target aligning with the full measured move as illustrated on the chart.
STORJ/ USDT - SHORT SET-UP 📊 Key Technical Insights
1. Price Structure
Price recently rejected near 0.2550–0.2575 zone (supply/resistance).
Lower highs forming, indicating bearish market structure.
Current price (~0.2444) is just under minor resistance, which may confirm the start of a new leg down.
2. Risk-Reward Ratio
Risk: ~0.0131 (from 0.2444 to 0.2575)
Reward: ~0.0258 (from 0.2444 to 0.2186)
RRR: ~1:2 — Good risk-to-reward ratio.
3. Support Zones
Minor support: 0.2330–0.2300 area — could act as TP1.
Major support (TP2): 0.2186 — aligns with historical price reaction.
4. Candlestick Behavior
Rejection wicks seen near the 0.2550 zone, confirming supply presence.
Recent candles show selling pressure dominating.
---
📉 Trade Plan Summary
Component Level
Sell Entry ~0.2444
Stop Loss 0.2575
TP1 ~0.2300
TP2 (Main) 0.2186
Trend Bearish
---
✅ Confluences Supporting the Short Setup
Double/triple top formation around 0.2570.
Lower highs and bearish market structure.
Price rejected strongly from resistance zone.
Clean support zones below offer logical targets.
---
🚨 Caution
If price breaks and closes above 0.2575 with strength, the bearish setup becomes invalid.
Watch for fakeouts or consolidation between 0.2400–0.2500.
$STORJ – Testing Descending Trendline Support📊 GATEIO:STORJUSDT.P STORJ is testing the descending trendline support on the daily timeframe, and it’s holding firm for now.
⚠️ This level is crucial — will it act as a springboard for a bullish reversal or let the bears take over?
👀 Watch price action closely for clues!