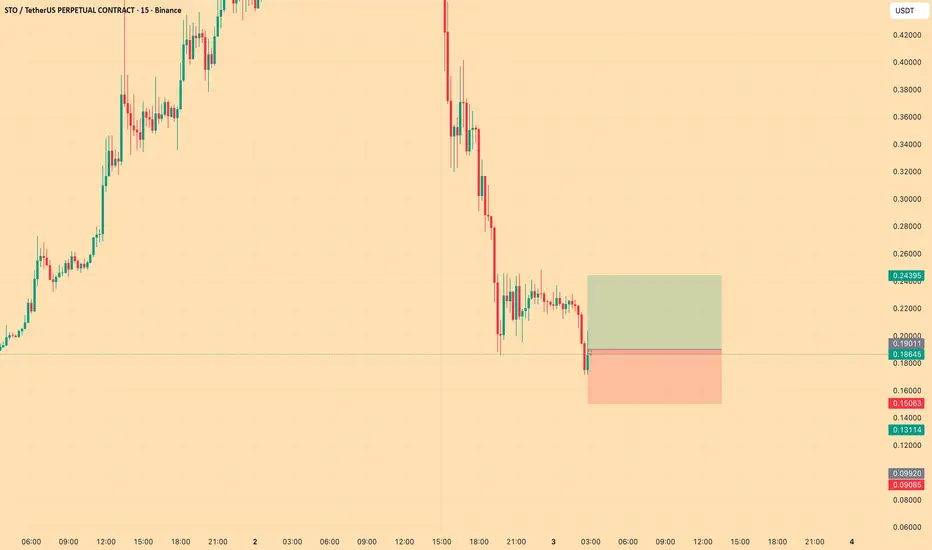
stousdt longInstructions:
Entry point: yellow
Stop loss: red
Take profit: green
👉Leverage x 5-10-20 for crypto
👉Leverage x 20-50-100 for commodities, stocks, indices, and forex
👉Margin 1-5% max.
Always practice risk and money management.
Invest a maximum of 5% on any trade or across all your trades.
Invest only what you can afford to lose, as no one is in control of the market.
👉Our analyses are primarily based on:
breakouts: two trend lines (ascending and descending) and a line indicating a horizontal breakout.
chart patterns: shoulders and head, triangle parttern, elliott impulse, etc etc.
We don't always have the time to track them at all times or to represent them visibly, given the numerous signals, the number of channels to manage, and especially because of the often rapid pace of market movements.
indicators: We associate at least two indicators with this technique.
👉Depending on the circumstances, we use specific indicators, often setting 3 or more take profit levels.
👉Indeed, there are good days in trading and also bad days. No one can promise to win every trade, and like all traders worldwide, we also experience stop-loss orders. However, we win more than we lose and remain positive.
👉You can close the position before or after the take profit orders indicated by the green lines if you are personally satisfied; the same applies to stop loss orders.
👉We must stay positive, clear-headed, and humble.
we cannot provide all instructions or all trades here on this channel.
Good luck to us all, and may God guide us. Amen.
In-depth trading ideas
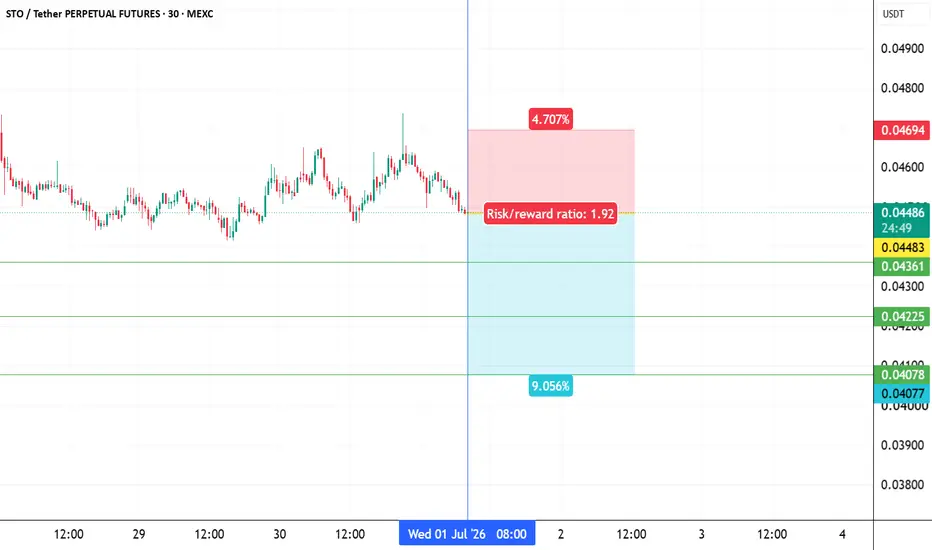
STOUSDT SHORTInstructions:
Entry point: yellow
Stop loss: red
Take profit: green
👉Leverage x 5-10-20 for crypto
👉Leverage x 20-50-100 for commodities, stocks, indices, and forex
👉Margin 1-5% max.
Always practice risk and money management.
Invest a maximum of 5% on any trade or across all your trades.
Invest only what you can afford to lose, as no one is in control of the market.
👉Our analyses are primarily based on:
breakouts: two trend lines (ascending and descending) and a line indicating a horizontal breakout.
chart patterns: shoulders and head, triangle parttern, elliott impulse, etc etc.
We don't always have the time to track them at all times or to represent them visibly, given the numerous signals, the number of channels to manage, and especially because of the often rapid pace of market movements.
indicators: We associate at least two indicators with this technique.
👉Depending on the circumstances, we use specific indicators, often setting 3 or more take profit levels.
👉Indeed, there are good days in trading and also bad days. No one can promise to win every trade, and like all traders worldwide, we also experience stop-loss orders. However, we win more than we lose and remain positive.
👉You can close the position before or after the take profit orders indicated by the green lines if you are personally satisfied; the same applies to stop loss orders.
👉We must stay positive, clear-headed, and humble.
we cannot provide all instructions or all trades here on this channel.
Good luck to us all, and may God guide us. Amen.
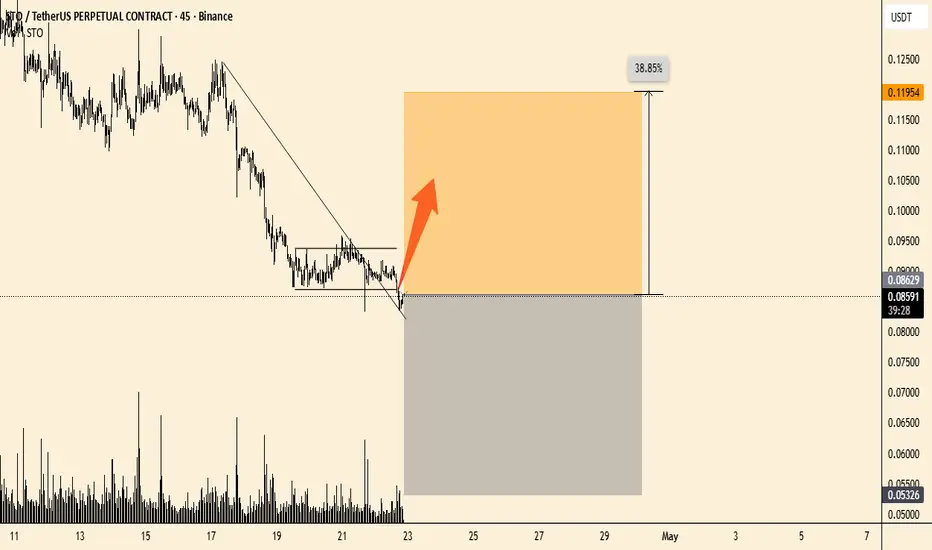
Stousdt longInstructions:
Entry point: yellow
Stop loss: red
Take profit: green
👉Leverage x 5-10-20 for crypto
👉Leverage x 20-50-100 for commodities, stocks, indices, and forex
👉Margin 1-5% max.
Always practice risk and money management.
Invest a maximum of 5% on any trade or across all your trades.
Invest only what you can afford to lose, as no one is in control of the market.
👉Our analyses are primarily based on:
breakouts: two trend lines (ascending and descending) and a line indicating a horizontal breakout.
chart patterns: shoulders and head, triangle parttern, elliott impulse, etc etc.
We don't always have the time to track them at all times or to represent them visibly, given the numerous signals, the number of channels to manage, and especially because of the often rapid pace of market movements.
indicators: We associate at least two indicators with this technique.
👉Depending on the circumstances, we use specific indicators, often setting 3 or more take profit levels.
👉Indeed, there are good days in trading and also bad days. No one can promise to win every trade, and like all traders worldwide, we also experience stop-loss orders. However, we win more than we lose and remain positive.
👉You can close the position before or after the take profit orders indicated by the green lines if you are personally satisfied; the same applies to stop loss orders.
👉We must stay positive, clear-headed, and humble.
we cannot provide all instructions or all trades here on this channel.
Good luck to us all, and may God guide us. Amen.
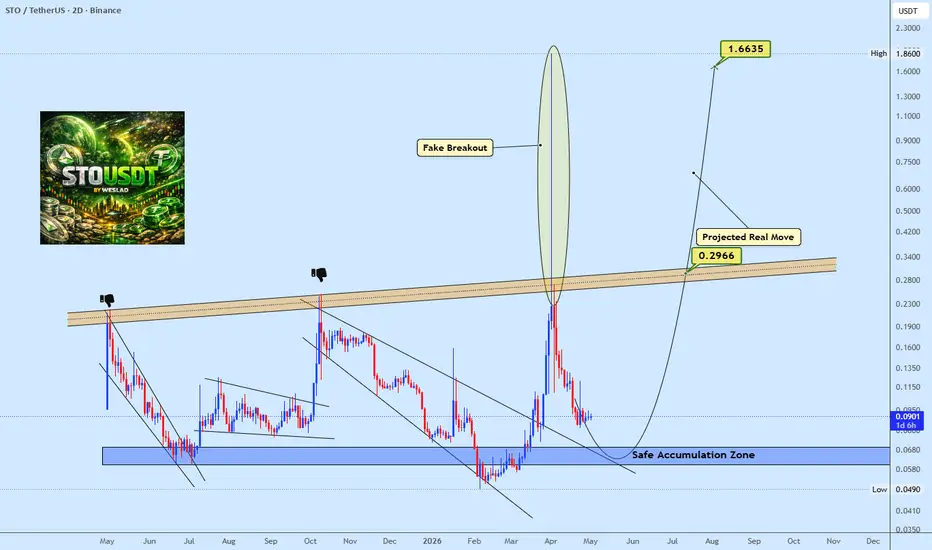
STO Retesting Demand Zone Before ExpansionSTO recently pushed above the major horizontal resistance region but failed to sustain the breakout, resulting in a fakeout and sharp rejection back below the resistance zone. Price is now gradually rotating back into the key accumulation area, which remains the most important support region for bullish continuation.
As long as this accumulation zone continues to hold, the structure still favors another expansion toward the main resistance region, where a larger breakout move is expected to develop.
The current zone remains a favorable area for gradual accumulation while patiently positioning for the potential macro upside expansion ahead.
STO / USDT.PBINANCE:STOUSDT.P
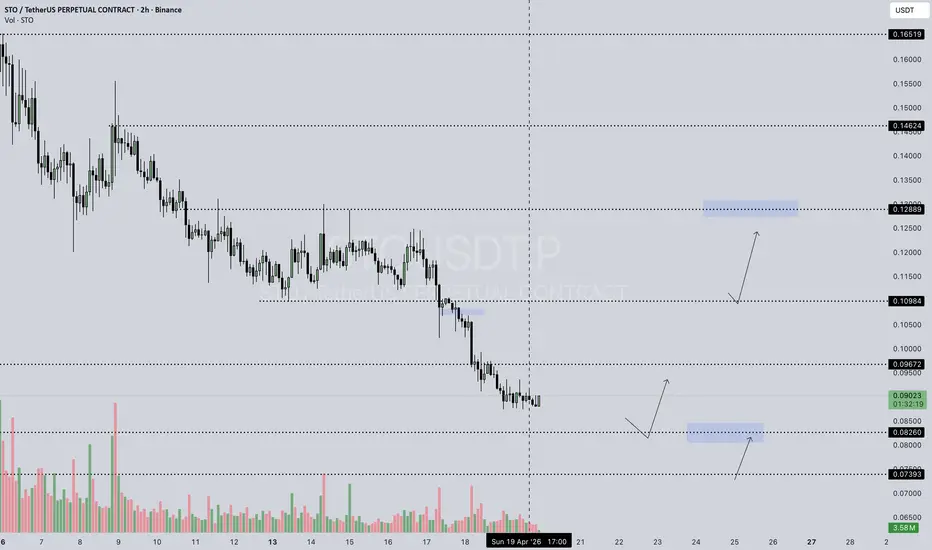
## 🟢 **SUPPORT** (your levels)
- 🧱 **0.14624** → first support / old pivot
- 🧱 **0.14233** → minor bounce zone 🟡
- 🧱 **0.12889** → stronger historical support 🟢
- 🧱 **0.10984** → deeper demand zone
- 🧱 **0.09672** → weak support (likely to crack) ⚠️
- ✅ **0.08938** → **main current support** / buy interest zone
- 🧊 **0.08260** → your BUY limit / liquidity below main support
## 🔴 **RESISTANCE** (your levels)
- 🚫 **0.16519** → major resistance / range top 🧱
- 🚫 **0.16000–0.15500** → overhead supply zone
- 🚫 **0.15000** → psychological resistance
- 🚫 **0.14624** → now acting as resistance (flipped)
- 🚫 **0.14233** → first rejection zone if price rallies
---
## ⚠️ **Disclaimer**
*Not financial advice. Crypto is highly volatile, and levels can fail. Always use risk management and confirm with your own analysis before trading.*
$STOUSDT (1H) — Momentum Pullback into Key DemandPrice just had a massive impulsive move up, printing higher highs and holding above key EMAs. Now we’re seeing a healthy correction after that vertical push — this looks like a standard cooldown, not a bearish shift yet.
What’s happening now:
Price has tapped into a strong demand/support zone: $0.3650 – $0.3353
This zone aligns with previous consolidation and the 0.618 Fibonacci level, giving strong confluence
Initial bounce reaction shows buyers are active in this area
Trade Setup:
Entry: Around $0.3649 (zone retest)
Stop Loss: $0.2649 (below structure, invalidation level)
Targets:
TP1: $0.7613 — first key resistance and profit-taking zone
TP2: $1.7649 — extended target if bullish momentum continues
Structure Insight:
Market structure remains bullish unless this demand zone breaks
This is a classic buy-the-dip setup within an uptrend
Holding this zone increases probability of continuation
Breakdown below the zone opens risk of trend reversal
Summary:
Strong trend combined with a clean pullback into demand creates a high-probability bounce setup. This is typically where buyers look to re-enter.
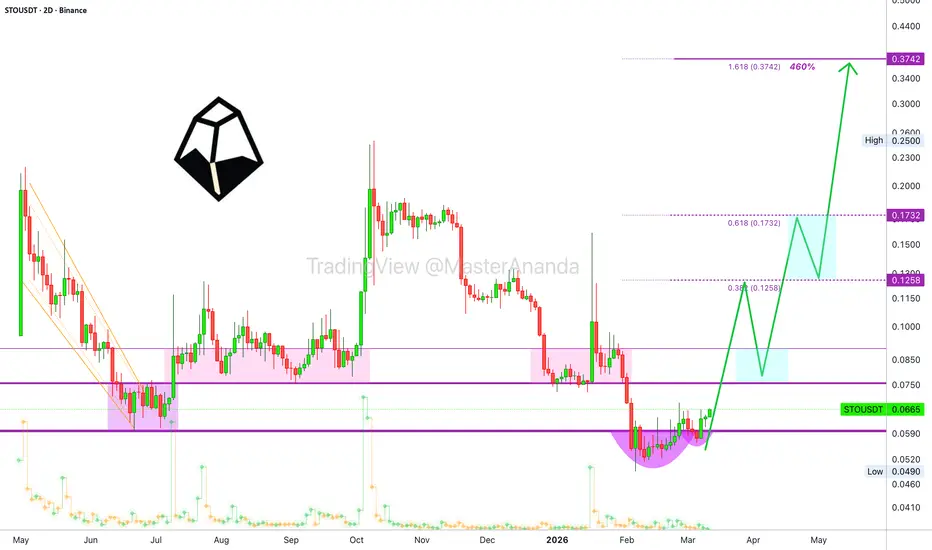
StakeStoke 460% profits potentialSome projects, as they turn bullish, the first two days can see 100-200% total growth. Day one and day two. Something massive. Altcoins season.
The chart is for STOUSDT—StakeStoke.
Looking at the last target, it might seen a little far-fetched. When considering how the other projects are doing, those breaking up with high bullish momentum, then it seems possible and do-able in the weeks ahead.
Instead of 200% in 2 days, we can see 200% within 10-20 days followed by additional growth.
The truth is that the first few days can result in very strong bullish action but a complete cycle takes time to unravel, it can take months.
STOUSDT hit a new all-time low recently when it moved below the late June 2025 low. This move has been recovered and the chart is now back within the bullish zone.
This stop-loss hunt event reveals the end of a cycle, a bearish trend and the start of a new move. A very strong, and likely fast, rise.
Many altcoins are set to grow really strong.
Bitcoin's rise is not over... When in doubt, zoom out—look at the weekly chart.
Bullish action is only getting started. Patience is key.
Namaste.
STOUSDT — Shorts LiqSpot volume printed 137.79M against only 1.4B on the futures side, with spot dollar volume at 34.99M versus 355.41M futures — a 10.14x High leverage ratio trending up. The critical read here is Spot:Futures classified as Divergent. Spot Z sits at just 0.14 Average while Futures Z is at 2.35 Spike. That separation is the warning flag embedded inside an otherwise bullish signal stack. Futures are running this move. Real spot participation is not confirming it at the same intensity.
Signal count reads 39 green to 14 red out of 112, with 10 green to 4 red on close-versus-Tenkan showing mixed higher timeframe alignment. EMA trend is clean at 10 green to zero red — every timeframe EMA stack is bullish. Candle bias flips the picture at 8 green to 6 red, showing the recent candles are losing conviction. Ichimoku TK at 9 green to 1 red remains structurally supportive. Supply-demand shows 1 demand to zero supply — no overhead resistance mapped. Spread reads 74.5% Extreme conviction on the weighted score. Squeeze is None with BBW at 176.95% Blowoff — expansion is already deep in progress. Pattern signals show 2 Three Soldiers, 1 Evening Star bearish, 2 total bullish against 1 bearish — the Evening Star on a higher timeframe is a reversal warning worth noting.
Spot Z at 0.14 Average. Futures Z at 2.35 Spike. Combined F+S Z at 2.00 Spike. SpotZ 1:5 reads 0.14 against -0.46 five bars ago — the reading is +0.6 Accel with double-down arrows, meaning acceleration is present but already fading. Spot:Futures is Divergent, the only classification in the suite that flags futures running without equivalent spot backing. Bull:Bear Z at 2.36 to -0.48 shows bull dominance but the bear Z is not zero, some distribution is present. OBV Z at 0.56 with Strong ↑ slope — accumulation is building but the 0.56 reading is modest relative to the price move, which itself is a mild divergence between OBV and price action. OBV Div reads Normal, no active divergence alert triggered. Liquidation status is Shorts Liq, confirming a short squeeze component is driving futures volume.
Leverage at 10.14x High trending up, percentile at 79.5% Upper — this is approaching ceiling territory. AT Max hit 12.75x only 3 bars ago, meaning leverage peaked at the volume event and is pulling back. AT Min is 0.046x at 355 bars ago, the historical floor. Price percentile at 92% Upper is the loudest warning on this panel — price is in the top 8% of its entire range. Retrace from prior high reads -6.5% Deep. Bounce from lows is 285.7% at 43.7x ratio, Parabolic classification. Bull Cascade active at 8 bars with a 5-bar cumulative move of 238.2%. Premium reads -0.17% Bkwd at Z 0.3 — mild backwardation, not extreme. Yield at -190% APY at 0.3 sigma Bull is modest, not the structural short-squeeze fuel seen in BLUR.
The honest read: STO has a clean EMA stack and parabolic bounce metrics, but the Divergent Spot:Futures classification combined with price at 92% of its range and leverage at 79.5% Upper percentile makes this a distribution risk setup, not an accumulation entry. The move is largely futures-driven — spot at 0.14 Average Z while futures print 2.35 Spike is exactly the ghost market pattern with insufficient F/S ratio to trigger the formal classification, but the structure is the same. Bull Cascade at 8 bars and 238% in 5 bars means the easy money is already taken. A reversion toward the demand zone below is the higher-probability next move than continuation at these levels.
Is That Crypto Pump Real? Data Says No. Here's Why.
Stop Losing Money to Fake Volume. Find Real Moves Now.
Trade the REAL Crypto Volume. Stop Getting Faked Out.
STOUSDT — Compression Near Breakout ZoneMarch 29, 2026
⚡ STOUSDT — Compression Near Breakout Zone
STO is moving within the microcap / late-cycle rotation narrative, where quieter assets begin to wake up after long periods of inactivity.
These setups often precede fast, liquidity-driven expansions.
🧠 Stage 1 (Perspective)
STO is building a solid Stage 1 base:
✔ Downtrend → completed
✔ Base formation → established
✔ Accumulation → extended
✔ Breakout pressure → increasing
Price has been ranging between ~$0.078–$0.16, showing:
Tight consolidation
Repeated support holds
Gradual higher lows
A classic compression structure.
🔍 Current Setup
Price: ~$0.16
STO is now:
Testing range highs around $0.16
Pushing into resistance with momentum
Showing early volume expansion
This is where pressure builds before resolution.
🧱 Key Levels
Support:
$0.078 → macro base
Resistance:
$0.16 → key breakout level
$0.21 → next supply zone
$0.36 → major liquidity area
🎯 Scenario
✅ Bullish Case (Stage 2 Trigger)
If STO:
Breaks and holds above $0.16
Builds structure above resistance
Continues with volume
→ Transition into Stage 2 becomes likely
⚠️ Weak Case
Rejection at $0.16:
→ Return to range
→ Continued compression
(No structural damage unless $0.078 breaks)
🚀 Final Thought
STO is not trending yet —
but it’s approaching a critical point:
👉 Compression at resistance after long accumulation
These are the moments where moves are decided.
If confirmed:
➡ accumulation → expansion
And that’s where momentum accelerates.
5.6x Futures Ratio, Spot Z Low, OBV Spread DivergenceSTOUSDT spot volume 36.36M against futures 203.78M — a 5.6x futures-to-spot ratio. Dollar value 4.91M spot versus 27.51M futures. Futures are running this instrument at more than five times the organic spot participation. That ratio matters significantly when reading the signal stack conviction below.
57 of 112 signals green, 3 red. Extreme BULL at 87.14% conviction, 14.56x. EMA 10 green zero red. Candle 14 green zero red. Ichi TK 11 green 2 red. C>T 13 green 1 red. Engulf 2 green zero red. Pattern total 7 green zero red. The structural sweep is near-clean across every timeframe alignment. The one internal contradiction: SS/DD reads 1 to 3 bear — supply and demand structure has not confirmed the signal board. Spread at 87.1% Extreme. No squeeze active. Momentum Bull up, bandwidth 62.17% Expanding. 5-Bar Move 36.6% — this instrument has already moved hard. Cascade Weak Bull at 4. Retrace -2.7%, bounce 85.2% at 31.3x Para.
Spot Z at -1.15, Low. Futures Z -0.03, steady. Combined Z -0.27, steady. SpotZ 1:5 reads -1.15 current, -0.34 mid, -0.82 decel with downward arrow. Bull:Bear Z 0.19 to -0.44, neutral. Spot momentum contracting at 140.3%. The volume engine behind the 36.6% five-bar move is not present in the spot Z — futures drove this, spot is trailing.
Leverage at 5.6x down, Elevated. Percentile 50.2% Mid — neither flush nor extreme. All-Time Max 11.12x just 46 bars ago, meaning leverage was nearly double current levels very recently. Price percentile 79.2% Upper. Hi/Lo range 0.15769 to 0.04885. OBV Spread Divergence flag is active — this is the structural warning in the panel.
OBV Z at 1.07 inflow with upward arrow is the lone volume positive worth noting, but the Spread Divergence tag on OBV Div is the key read. Spread Divergence means OBV is rising while price-volume spread is moving in an inconsistent direction — a classic sign of distribution masking as accumulation. No whale activity, liquidations clear. No squeeze divergence. The signal board says extreme bull; the OBV internals say the price action and volume are telling different stories.
The honest read: 57 green signals and a near-clean EMA/Candle/Ichi sweep are hard to argue with on structure alone, but at 5.6x futures-to-spot with Spot Z at -1.15 Low, OBV Spread Divergence active, and SS/DD 1 to 3 bear, this move is futures-led and unconfirmed by real spot conviction. The 36.6% five-bar move already happened — chasing entry here means buying into a futures-driven extension with volume not present. Leverage at 50th percentile mid means no clean flush has reset the risk. Watch for Spot Z to recover above zero and OBV Spread Divergence to clear before treating the 57-signal bull stack as an actionable long. Until then the signal board is reading a futures narrative, not a spot one.
Is That Crypto Pump Real? Data Says No. Here's Why.
Stop Losing Money to Fake Volume. Find Real Moves Now.
Trade the REAL Crypto Volume. Stop Getting Faked Out.
STO/USDT Extreme Bull Signals — But Who Is Actually Buying?STO trades at 0.09470 spot against 0.09460 futures, a slight backwardation with -0.11% premium. Spot volume sits at 58.2M versus 277.97M futures, meaning futures are running nearly 5x the spot dollar flow. S/F dollar spread at 5.51M versus 26.3M tells the same story.
43 of 112 signals green at Extreme Bull 73.23% spread. EMA clean at 8-0, Ichi TK 11-2, Candle 10-4, C>T 9-5. No squeeze active on the indicator, momentum Bull expanding with BW at 43.71% and still widening. Pattern total 2-0 with Para bounce at 56.2% and 43.8x magnitude.
Spot Z -0.87 Quiet, Futures Z 0.26 Average, Combined F+S Z 0.03 Average. SpotZ multi-frame range -0.87 to -1.33 with 0.46 divergence flagged Rising. Spot:Fut confirmed Normal. Spot momentum expanding hard at 313.8% with Mkt Normal.
Leverage 4.77x declining, rated Normal. Percentile 40.5% Lower — no crowding or euphoria here. AT Max 11.11x recorded 26 bars ago, AT Min 0.46x at 186 bars ago. Price at 54.1% Mid of historical range. Bull:Bear Z 0.54 versus -0.49 sitting Neutral.
OBV Z 0.44 Inflow with no divergence — quiet but accumulating underneath. Liquidations clear, no whale activity detected. Spot squeeze FIRED real while futures squeeze shows None — Sqz Div flagged Spot Fire Real. Bull:Bear Z near neutral confirms neither side has full conviction yet.
The honest read: structure is cleanly bullish with 43 green signals, EMA and Ichi fully aligned, and momentum expanding. The problem is the volume split — spot Z quiet at -0.87 while futures run 5x the spot dollar flow. Spot squeeze firing without futures participation is actually a real signal, not noise, and leverage is declining rather than building. This sets up as a genuine spot-driven move in early formation, not a leveraged pump. If spot volume accelerates to confirm, this has meaningful upside. Without that follow-through, it stays a futures-led attempt that could fade fast.
*Is That Crypto Pump Real? Data Says No. Here's Why.*
*Stop Losing Money to Fake Volume. Find Real Moves Now.*
*Trade the REAL Crypto Volume. Stop Getting Faked Out.*