STRK: Tight Bearish Compression at Triangle ApexSTRK: Tight Bearish Compression at Triangle Apex – Optimal Trend-Following Short Setup
STRK is drawing exceptionally close to a decisive breakdown moment as the price action converges into the final apex of a consolidation triangle. The current market structure leans heavily toward a bearish conti
STRK at macro floor: base recovery toward $0.0351The Macro Picture 🗺️
STRK unwound the whole move from the $0.06367 high down to the $0.02717 macro floor and has stopped falling right on it. RSI is pressed near 40 and the steep selling has flattened — the shape of exhaustion, not continuation.
The Setup ⚙️
The Accumulation Zone 🟢
$0.02717–0.028
STRKUSDT: long setup from daily resistance at 0.0597Symbol: BINANCE:STRKUSDT.P
WHAT I WANT TO SEE:
volatility contraction on approach
impulse absorption at the level
precise level testing
price compression (Squeeze)
at-level close
extreme close WHAT I DON'T LIKE:
distant retest Where would you place your stop loss in this situation
Starknet STRK price analysisIt’s alive… IT’S ALIIIIVE 😄
Yep, we’re talking about #STRK
After a long “coma phase”, the price finally started moving and looking interesting again.
But getting too excited too early might be risky — because OKX:STRKUSDT is approaching some very important levels 👇
📈 First major zone:
the upper
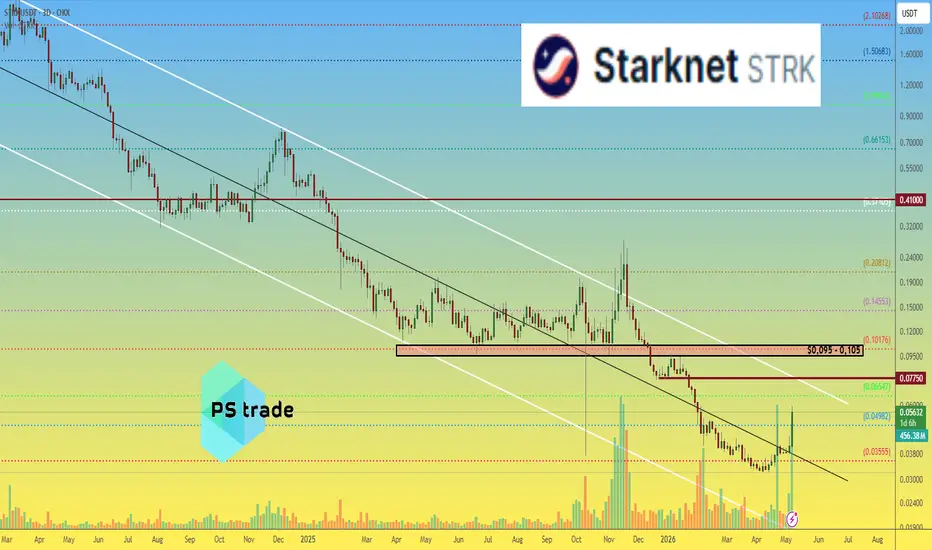
Starknet (STRK) Can Grow 1,500% Mid- to Long-termAnother bottomed out project. Here we have the highest volume and biggest green candle since the November 2025 high, six months ago.
STRKUSDT (Starknet) started to crash after November 2025 with no stops until very recently, last month. The trading pair produced the classic pattern, a rounded botto
STRK: Massive Descending Wedge Formation, Breakout Objections!Hello There,
welcome to my new analysis about STRK from a weekly timeframe perspective. In recent times, I have spotted interesting altcoins in the cryptocurrency market that have the potential to transform into a strong trading opportunity with the subsequent volatility increase. Especially with
STRKUSDT 1D#STRK has formed an inverse head and shoulders pattern on the daily chart. In case of a breakout above the daily SMA100 and the neckline of the pattern, the potential upside targets are:
🎯 $0.0466
🎯 $0.0512
🎯 $0.0557
🎯 $0.0621
🎯 $0.0703
⚠️ Always remember to use a tight stop-loss and maintain prop
STRK – A Zombie L2 Slowly DyingEven though NASDAQ:STRK is dumping horribly to its all-time low of ~$0.036 (down >99% from ATH $3.66–$4.41 in 2024), the StarkWare team + investors (VCs) are still making bank because:
- Huge allocations: Early Contributors ~20% (2B STRK), Investors ~18.2% (1.82B #STRK), StarkWare ~10.8% → total
Starknet: navigating the pump? key levels to watch for todayStarknet
Who’s farming this narrative pump and who’s actually trading the chart? After the recent mainnet and ecosystem headlines, according to the market there’s fresh attention on L2 names and Starknet is back in rotation. Today we saw a fast spike into that orange supply zone and an equally fas
See all ideas
Summarizing what the indicators are suggesting.
Oscillators
Neutral
SellBuy
Strong sellStrong buy
Strong sellSellNeutralBuyStrong buy
Oscillators
Neutral
SellBuy
Strong sellStrong buy
Strong sellSellNeutralBuyStrong buy
Summary
Neutral
SellBuy
Strong sellStrong buy
Strong sellSellNeutralBuyStrong buy
Summary
Neutral
SellBuy
Strong sellStrong buy
Strong sellSellNeutralBuyStrong buy
Summary
Neutral
SellBuy
Strong sellStrong buy
Strong sellSellNeutralBuyStrong buy
Moving Averages
Neutral
SellBuy
Strong sellStrong buy
Strong sellSellNeutralBuyStrong buy
Moving Averages
Neutral
SellBuy
Strong sellStrong buy
Strong sellSellNeutralBuyStrong buy
Displays a symbol's price movements over previous years to identify recurring trends.