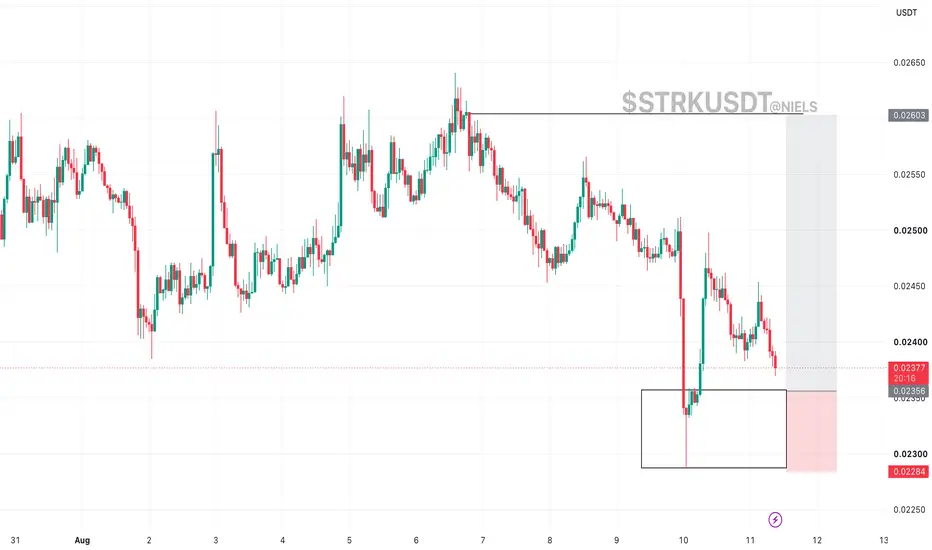
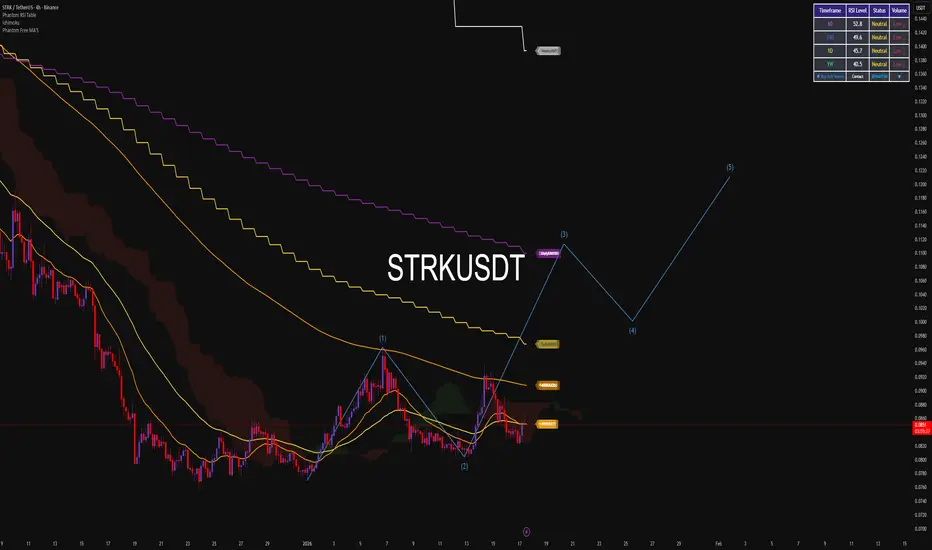
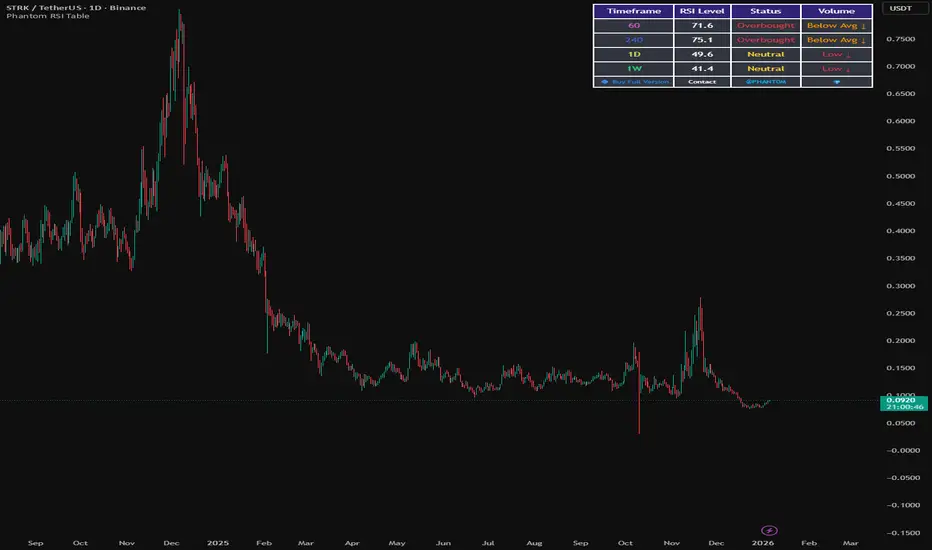
STRKUSDT 4H: Liquidity Sweep + Demand Reclaim | Bullish SetupSTRKUSDT has recently experienced a sharp downside move into a previously identified demand/liquidity zone around 0.02320–0.02356
Price swept below the zone, printed a strong rejection, and quickly recovered back above the 0.02356 level. This type of reaction can indicate that sell-side liquidity has been taken and buyers are beginning to defend the area.
Trade idea:
Entry zone: Above 0.02356 after confirmation/retest
Key support: 0.02320–0.02356
Invalidation: Below 0.02284
Upside target: 0.02603
Risk: Wait for confirmation rather than entering during the initial volatility.
The key level to watch is 0.02356. If STRK continues to hold above this level and establishes a higher low, the probability of a move back toward 0.02603 increases.
However, a clean break and close below 0.02284 would invalidate the bullish setup and suggest that the sweep was not followed by a sustainable reversal.
Plan: Let price confirm the zone before entry. No confirmation, no trade.
This is a technical analysis idea, not financial advice. Always manage risk according to your own strategy.
In-depth trading ideas
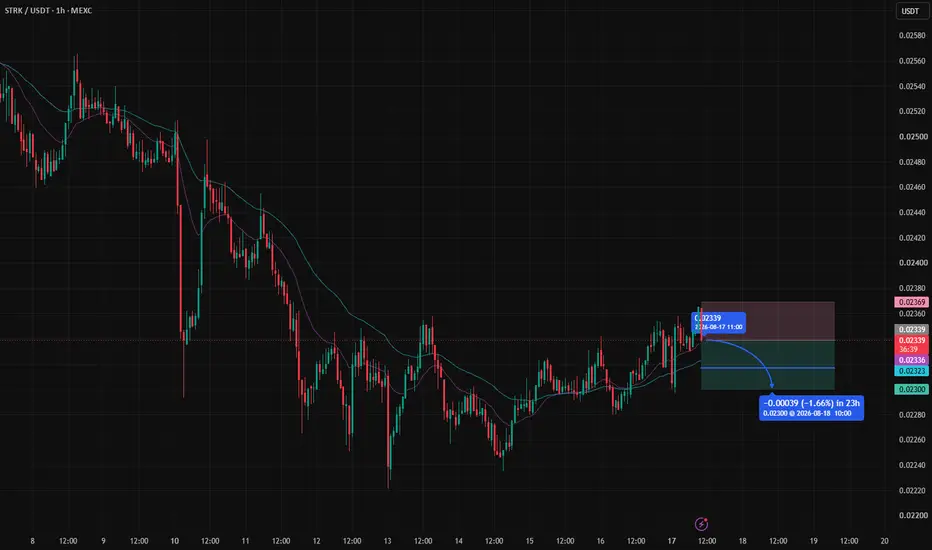
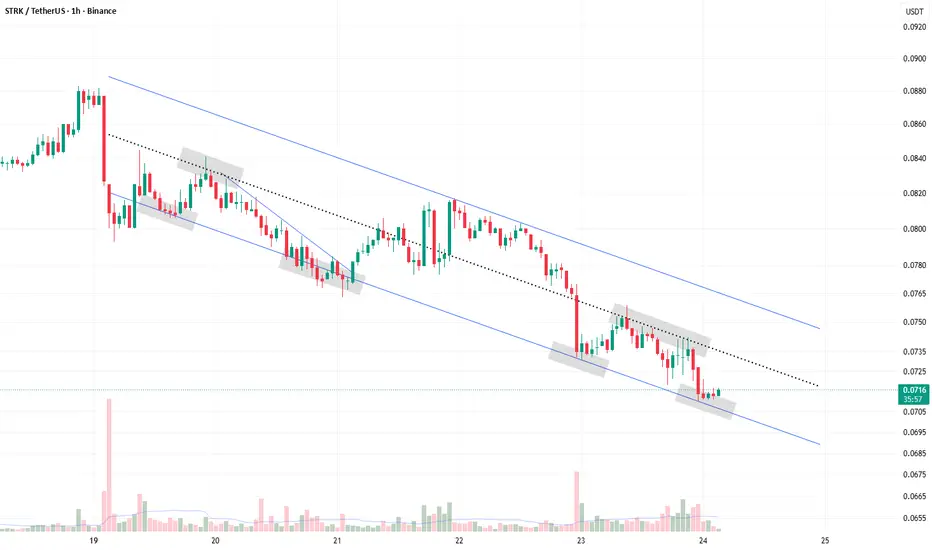
STRK/USDT H1: Weak bullish impulse against flat background🎯 TP1: $0.023168 (+0.74%) │ TP2: $0.022996 (+1.47%)
🛑 SL: $0.023653 (-1.34%) │ R/R: 1 : 1.1
⚠️ SL is placed beyond the nearest candle wicks to reduce the risk of accidental triggering
FUNDAMENTAL BACKGROUND
STRK is trading without its own catalysts, following the general sentiment of the crypto market. The Fear & Greed Index remains in the fear zone, limiting risk appetite. The US Consumer Price Index (CPI) data published on 12.08.2026 did not trigger a strong reaction as it matched expectations. The next significant event is the Federal Reserve (FOMC) Meeting Minutes on 19.08.2026, but it is still 2 days away.
TECHNICAL PICTURE
The price is fluctuating in the range of $0.022320–$0.023630, showing a weak trend (ADX 18.4). The EMA 20 and EMA 50 converge at $0.02, forming a consolidation zone. MACD shows zero values, confirming the lack of a clear impulse. VWAP $0.02 acts as the balance price of the current session.
PROBABILITY MODEL
Probability of continued growth — 40%, flat — 32%, reversal — 28%. The model's confidence coefficient of 50% reflects uncertainty. Expected volatility is medium (ATR 0.000195).
DIRECTION
🔴 SELL — Weak trend and resistance at the upper range create potential for a correction.
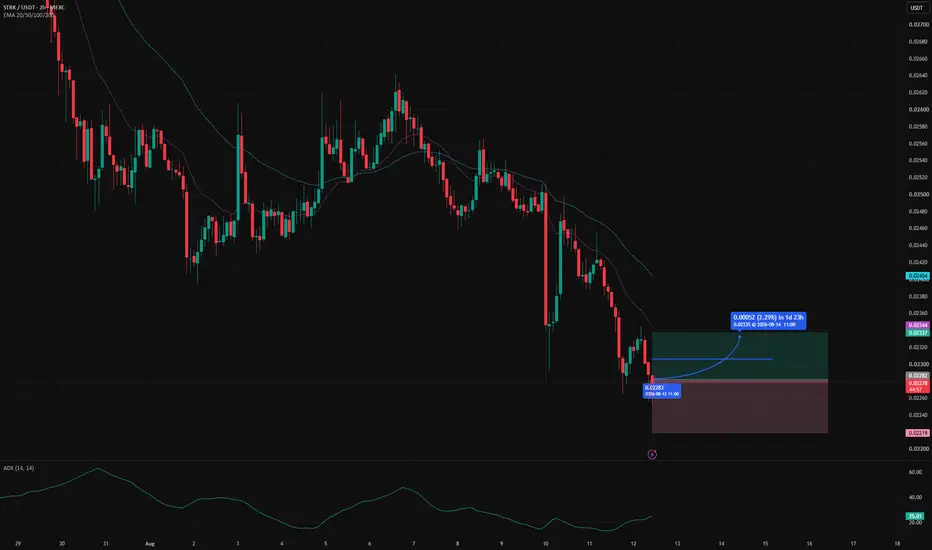
STRK/USDT H2: Breakout of the lower range boundary🎯 TP1: $0.023061 (+1.37%) │ TP2: $0.023372 (+2.73%)
🛑 SL: $0.022185 (-2.48%) │ R/R: 1 : 1.1
⚠️ SL is placed beyond the nearest candle tails to reduce the risk of accidental triggering.
FUNDAMENTAL BACKGROUND
STRK is trading without its own catalysts, following the general sentiment of the crypto market, remaining dependent on technical factors. Strong seller dominance amid a broader decline in risk appetite for altcoins is increasing downward pressure.
TECHNICAL PICTURE
ADX 25.5 confirms a strong downtrend with seller dominance. The price has broken below the EMA 20 level ($0.02), reinforcing the bearish momentum. VWAP ($0.02) now acts as resistance. The current price of $0.022750 is in the lower quantile of the last 100 candles' range ($0.022440–$0.026370), testing a local low.
PROBABILITY MODEL
The probability of the bearish trend continuing is 47%, supported by strong ADX and price positioning near the lower range boundary. The probability of a rebound is 30%, requiring confirmation via a VWAP breakout.
DIRECTION
🟢 BUY on a rebound from the $0.022440 level with volume confirmation.
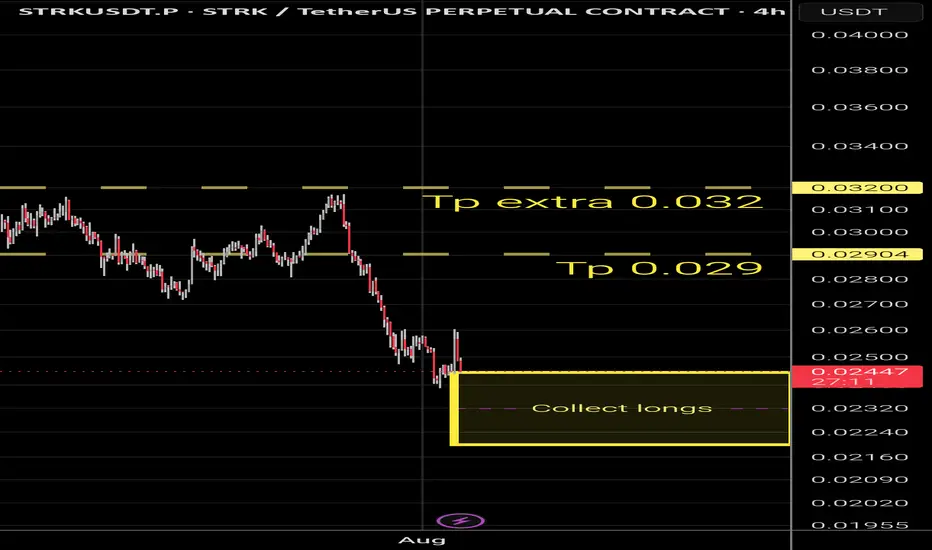
StrkAnd the stone descended into the lower chamber, where fearful hands surrendered what patient hands were sent to gather. Yet the fall was not the end; it was the preparation.
From the valley of 0.023, the path may reopen toward 0.029. And if the gate yields, 0.032 shall stand as the higher altar.
Blessed are those who collect in silence, for they shall be heard when the stone rises.
STRK: Tight Bearish Compression at Triangle ApexSTRK: Tight Bearish Compression at Triangle Apex – Optimal Trend-Following Short Setup
STRK is drawing exceptionally close to a decisive breakdown moment as the price action converges into the final apex of a consolidation triangle. The current market structure leans heavily toward a bearish continuation scenario, with selling pressure clearly asserting its dominance. Following a period of narrowing volatility, the price is currently hugging the upper boundary of the triangle, which directly overlaps with the dynamic resistance of the MA100 trend moving average.
Based on the visual data from the 4-hour chart , two consecutive H4 candles have printed long upper wicks, highlighting a strong price rejection from the market. The probability of a downside continuation far outweighs any recovery scenario due to two key supporting factors: the macro trend remains firmly bearish, and the broader market lacks any clear signs of liquidity recovery.
The complete exhaustion of buying demand at this technical barrier creates a highly favorable edge for the bears. Triggering a Short position at current levels substantially optimizes the risk-to-reward (RR) profile. Traders can proactively place an exceptionally tight stop-loss order just above the $0.03 psychological round number zone to protect capital effectively, while extending the take-profit target down toward the $0.02 support floor.
Disclaimer: This is not financial advice, DYOR.
STRK at macro floor: base recovery toward $0.0351The Macro Picture 🗺️
STRK unwound the whole move from the $0.06367 high down to the $0.02717 macro floor and has stopped falling right on it. RSI is pressed near 40 and the steep selling has flattened — the shape of exhaustion, not continuation.
The Setup ⚙️
The Accumulation Zone 🟢
$0.02717–0.02823 is where the selling has dried up. The macro floor has held, and this is the demand shelf a recovery would build from.
The Decision Point 🔴
$0.06367 (Local High) is the bigger structural gate. Before it, the $0.03508 measured-move target is the first objective — reclaiming it proves buyers are stepping back in.
The Roadmap 🛣️
Hold the $0.02717 floor → recover toward $0.03508 → then work toward $0.06367. Invalidation is a clean daily close below $0.02717 — that voids the accumulation thesis.
This is a textbook DCA Accumulation Zone setup: scale in across the $0.02717–0.02823 band and let the base do the work.
More setups in profile.
#STRK #Starknet #crypto #trading #TA #3Commas #DCA
STRKUSDT: long setup from daily resistance at 0.0597Symbol: BINANCE:STRKUSDT.P
WHAT I WANT TO SEE:
volatility contraction on approach
impulse absorption at the level
precise level testing
price compression (Squeeze)
at-level close
extreme close WHAT I DON'T LIKE:
distant retest Where would you place your stop loss in this situation?
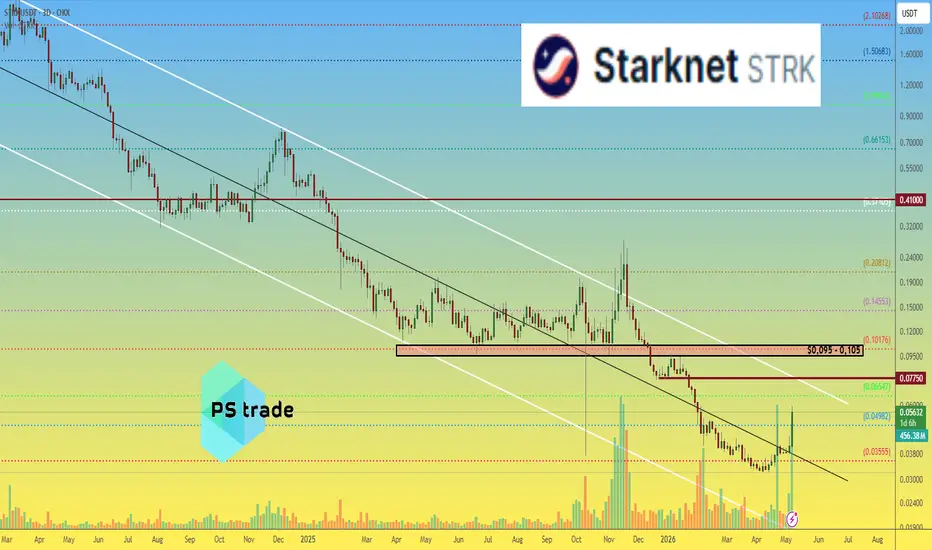
Starknet STRK price analysisIt’s alive… IT’S ALIIIIVE 😄
Yep, we’re talking about #STRK
After a long “coma phase”, the price finally started moving and looking interesting again.
But getting too excited too early might be risky — because OKX:STRKUSDT is approaching some very important levels 👇
📈 First major zone:
the upper boundary of the long-term falling channel around $0.075
And above that:
💰 a heavy liquidity zone at $0.095–0.105
That’s probably where we’ll find out: is this just another hype pump or the market actually starting to believe in #Starknet again.
Because the move from $0.03 back to the old $3 highs still sounds like crypto sci-fi 😅
But let’s be honest — crypto has surprised us before.
______________
◆ Follow us ❤️ for daily crypto insights & updates!
🚀 Don’t miss out on important market moves
🧠 DYOR | This is not financial advice, just thinking out loud
Starknet (STRK) Can Grow 1,500% Mid- to Long-termAnother bottomed out project. Here we have the highest volume and biggest green candle since the November 2025 high, six months ago.
STRKUSDT (Starknet) started to crash after November 2025 with no stops until very recently, last month. The trading pair produced the classic pattern, a rounded bottom, to signal the end of the downtrend.
Bearish momentum died down, several weeks went sideways then the action turns green. Then we see rising volume, many indicators start to flash bullish signals and the final confirmation comes as price action. A huge green candle with rising volume as the week reaches its end.
Let's say we get a very good close this week and this momentum carries over for us to see even better next week and the weeks that follow. May is turning out to be a great month. Buy in May and hold. Buy in May and stay around. Double-down in May because the market is hyper-bullish.
While this is all really good it is still early on this project. The minimum target to be hit short-term, high probability and fast, is the recovery range. That's a price tag around 0.618 Fib. extension at $0.185. Opening up some 215% total growth. There tends to be some consolidation after the recovery is complete followed by additional growth. So it gets better.
Patience is key.
Wishing you good profits, peace of mind, good health, wealth and great sleep. You deserve it.
Namaste.
STRK: Massive Descending Wedge Formation, Breakout Objections!Hello There,
welcome to my new analysis about STRK from a weekly timeframe perspective. In recent times, I have spotted interesting altcoins in the cryptocurrency market that have the potential to transform into a strong trading opportunity with the subsequent volatility increase. Especially with the initial confirmations ongoing, STRK is already showing strong signs of formation confirmation and target activation.
As when looking at my chart, we can watch there how STRK formed this massive descending wedge formation. Within this formation, STRK already completed the matching wave count. Currently, it is already breaking out above the upper boundary of the descending wedge formation. The settlement above the 50-EMA marked in green and the upper boundary are already strong confirmations.
Furthermore, it is also building this bullish ascending channel in which the price action is likely to accelerate. The bullish volume is also already confirming the breakout scenario happening now. The breakout and completion of the descending wedge has confirmed the upper target zones as marked in my chart within the 0.55 level. A breakout above the 100-EMA marked in blue is going to accelerate the target appointment.
In this manner, thank you a lot for watching!
The support is highly appreciated.
VP
STRKUSDT 1D#STRK has formed an inverse head and shoulders pattern on the daily chart. In case of a breakout above the daily SMA100 and the neckline of the pattern, the potential upside targets are:
🎯 $0.0466
🎯 $0.0512
🎯 $0.0557
🎯 $0.0621
🎯 $0.0703
⚠️ Always remember to use a tight stop-loss and maintain proper risk management.
STRK – A Zombie L2 Slowly DyingEven though NASDAQ:STRK is dumping horribly to its all-time low of ~$0.036 (down >99% from ATH $3.66–$4.41 in 2024), the StarkWare team + investors (VCs) are still making bank because:
- Huge allocations: Early Contributors ~20% (2B STRK), Investors ~18.2% (1.82B #STRK), StarkWare ~10.8% → total ~49% of supply for insiders/team/VCs (per official tokenomics).
- They received tokens at extremely low prices (near 0).
Gradual unlocks until 2027 (monthly ~127M STRK, e.g., Jan/Feb/Apr 2026 unlocks of 127M each) → they can sell at any price and still make massive profits (even at $0.036, it's dozens or hundreds of times their initial cost).
1. Adoption is disastrous – "Fake" volume, DAU horrendously low TVL: ~$258.82M (down -2.12% in 24h; DeFiLlama). Compare: Base >$4B+, Arbitrum much higher.
- DEX Volume 24h: ~$9-10M – sounds big but Chain Fees 24h only ~$4,757–$10K (very low, proving no real value generation). App Fees 24h: ~$88K.
- Perps Volume 24h: ~$395M (30d ~$11.8B) – mostly mercenary farming from incentives, not organic activity (fees captured are tiny compared to notional volume).
- DAU (Daily Active Users/Unique Addresses): ~2,000–4,000 (Dune/Starknet Foundation data); broader metrics (e.g., TokenTerminal) show ~50K, but still pathetic vs. Base ~500K+, Arbitrum ~170K+. Solana once trolled Starknet with "only 8 DAU" (old number, but the spirit is spot on: activity is weak compared to market cap/FDV).
Bitcoin staking makes up a huge chunk of TVL (~passive wrapped BTC, not vibrant DeFi/gaming).
2. Tokenomics nightmare – Endless unlocks + dumping Current STRK price: ~$0.036–$0.038 USD (all-time low hit ~$0.036 on March 19, 2026; down ~5–8% in recent 24h across sources like CoinMarketCap, CoinGecko).
- ATH: ~$3.66 (2024) → down >99%.
- Market cap: ~$206–$212M.
- Circulating supply: ~5.65B STRK (max 10B).
- Ongoing unlocks: monthly from VC/team/early contributors (vesting until 2027) → constant selling pressure (e.g., upcoming April 2026 unlock).
3. Community: Basically non-existent Social media (X/Twitter) is full of shills from project/ecosystem accounts (@StarknetEco, etc.), critics get blocked/muted or ignored.
****Worst-case scenario (highly plausible if no turnaround): Community turns its back → loses all users/devs.
- Incentives dry up → real volume collapses, TVL drops below $100M.
- Broader ETH/BTC bear market → alt L2s die off.
- STRK price:
Short-term (2026) could hit $0.01–$0.02 (another 50–70% loss).
Medium-term (2027+): If StarkWare doesn't fix reliability + adoption, drops to $0.005 or lower → zombie coin (still exists but dead volume, market cap under $50–100M).
- Extreme worst: StarkWare pivots/abandons → price near 0.
Starknet: navigating the pump? key levels to watch for todayStarknet
Who’s farming this narrative pump and who’s actually trading the chart? After the recent mainnet and ecosystem headlines, according to the market there’s fresh attention on L2 names and Starknet is back in rotation. Today we saw a fast spike into that orange supply zone and an equally fast rejection - classic “news gets you in, levels decide if you stay.”
On the 4H chart price just tapped into resistance around the upper orange band while RSI is stretched near overbought and curling down. Volume on the push up was strong, but this first touch looks more like profit taking than a clean breakout, so for now I lean short term pullback before any serious attempt higher.
My base plan: I want a dip back into the green demand area to see if buyers defend it. If we hold that zone and RSI cools off, I’ll look for a long toward the mid black zone and then a retest of the orange highs ✅ If price loses the green block and closes below it, I assume bulls fumbled the bag and I’ll stand aside or look for a deeper fade. I might be wrong, but chasing right into resistance usually ends with funding your broker’s weekend.
Fundamental Analysis - STRKSTRK
▪️Date: February 21, 2026
▪️Project: StarkNet
▪️Ticker: STRK
▪️Price: $0.0462
▪️Market Cap: $251,641,626
▪️Fully Diluted Valuation (FDV): $461,932,027
▪️Total Value Locked (TVL): $456,510,874.90
➡️ Project Description
StarkNet is a decentralized Layer 2 network for Ethereum that uses ZK-STARK technology to scale computations without compromising security or decentralization. The project solves the problem of high fees and low speed on Ethereum, enabling developers to build complex dApps at low cost. Its mission is to make Ethereum scalable for mass adoption with a focus on security and performance.
Unique Advantages: STARK provers for ZK-proofs enable high throughput (thousands of TPS), low fees, and EVM compatibility via the Cairo language. Unlike Optimistic Rollups, StarkNet offers fast finality without a challenge period and better privacy.
Uniqueness: Addresses Ethereum's scalability issue (15-30 TPS, high gas fees). The L2 solution market is valued at $50 billion TVL (2026) with growth potential to $200 billion. Audience: over 1 million unique addresses, 50k daily active users. Growth drivers: DeFi, NFT, and gaming integrations.
Team: StarkWare Industries founded in 2018 by Eli Ben-Sasson (Technion professor, ZK-STARK pioneer), Uri Kolodner, and Michael Riabzev. Strong academic background in cryptography, successes in ZK technology, but criticism for token launch delays in 2024.
Weaknesses: Dependence on Ethereum, network outages in 2025, slow decentralization progress (30% as of 2026). TVL $456M, 80+ dApps, but lagging behind leaders like Arbitrum.
➡️ Technology Analysis
Innovation: ZK-STARK-based architecture scales computations off-chain with on-chain proofs. Differs from zkSync (ZK-SNARK) with greater cryptographic security and quantum resistance. The Cairo language reduces costs by 10-100x compared to Ethereum L1.
Development Activity: GitHub: 500+ commits/month, 100 active contributors, critical bugs fixed within 24 hours, open source with excellent documentation.
Sector: L2 Scaling. Competitors:
▪️ zkSync Era (ZK) — TVL $1B
▪️ Polygon zkEVM (POL) — TVL $800M
▪️ Linea (LINEA) — TVL $500M
▪️ Scroll (SCR) — TVL $400M
▪️ Taiko (TKO) — TVL $200M
Differentiation: Quantum-safe provers and native privacy, but lags in TVL ($456M vs zkSync $1B).
Conclusion: Strong technology with high development activity, but low market share (10% of L2 sector).
➡️ Market and Competitors
Market Size: Ethereum scalability — $50B TVL market, relevance growing with DeFi projected at $200B in 2026.
Competitors:
▪️ zkSync (TVL $1B, focus on EVM compatibility)
▪️ Polygon zkEVM (TVL $800M, Polygon ecosystem integrations)
▪️ Linea (TVL $500M, ConsenSys support)
▪️ Scroll (TVL $400M, fast decentralization)
▪️ Taiko (TVL $200M, Bitcoin integrations)
Partnerships: Integrations with LayerZero and Solana. Competitors growing faster (zkSync +50% YoY).
Potential: In a bull market, L2s could reach $10 trillion market cap.
Profitability: Project generates $5M monthly from fees but loses $2M on development. Market cap $456M appears undervalued at 10x P/S vs competitors at 20x.
Conclusion: Promising market, but StarkNet lags in TVL and growth.
➡️ Investors and Partnerships
Rounds:
▪️ Seed (2018) — $6M (Vitalik Buterin, Naval Ravikant)
▪️ Series A (2019) — $30M (Paradigm)
▪️ Series B (2021) — $50M (Sequoia)
▪️ Series C (2022) — $100M (Greenoaks, Coatue)
▪️ Series D (2022) — $100M (Tiger Global)
Total raised: $287M.
Investors: Paradigm, Sequoia, a16z — top-tier funds with 100x return history (Paradigm in Solana 500x). 1-4 year vesting — positive for tokenomics.
Analysis: All investors are top-tier, strong stability signal.
Conclusions: Strong investors indicate high potential with historical 50x growth in bull markets.
➡️ Tokenomics
▪️Max Supply: 10 billion
▪️Circulating: 4.56 billion
▪️Total Supply: 10 billion
▪️Market Cap: $456M
▪️Inflation: 5% annual
▪️Distribution:
▪️ Private Sale: 10%
▪️ Public Sale: 5%
▪️ Team: 20%
▪️ Foundation: 30%
▪️ Staking/Mining: 20%
▪️ Ecosystem: 15%
▪️Chart: Private 10%, Public 5%, Team 20%, Foundation 30%, Staking 20%, Ecosystem 15%
▪️Supply/Demand: Unlocks increase supply by 500M/year. Demand from staking (10% APY) and 1% fee burn.
▪️Unlock Schedule: 2026 — 100M tokens monthly ($10M at $0.10), 20% pressure from $50M trading volume.
▪️Mechanisms: Staking, burning. Real use in DeFi.
▪️Comparison: zkSync (21B max supply, more inflation); Polygon (deflationary).
▪️Conclusion: Balanced tokenomics, but unlocks create pressure.
➡️ Community and Social Activity
Twitter: 500k followers, 10k interactions per post. Discord: 200k, high activity. Telegram: 100k. Sentiment neutral-positive. Metric: 7/10 — average audience with good engagement.
➡️ News, Events, Announcements
▪️ Dec 22, 2025 — S-two prover
▪️ Dec 2, 2025 — Integration
▪️ Feb 1, 2026 — LayerZero live
▪️ Feb 10, 2026 — Roadmap
▪️ Jan 15, 2026 — Solana access
▪️ Jan 2026 — BTC staking
▪️ Feb 2026 — Quantum upgrade
Impact: Positive for TVL (+$300M), but price under unlock pressure. Bullish market, L2 sector growing.
💡 Conclusion
Overall rating: 7/10 — strong technology and team, but lags in adoption.
Recommendation: Include in portfolio for medium-term investors with high risk (5-10% allocation). 10x potential in altseason, target market cap $5 billion.
STRK: falling knife or hidden gem? key levels to watchSTRK. Still hoping this thing suddenly moons after the airdrop hype? While the ecosystem keeps dropping “growth” headlines, the market is clearly focused on unlocks and fresh supply, and you can see it in the price action – every bounce gets sold almost instantly. According to industry sources, funds are still rotating into majors, so small caps like STRK are left to fend for themselves.
On the 4H chart we’re in a clean downtrend, and the last bounce stalled right under the main volume node around 0.050–0.052 – classic supply zone. RSI just rolled down from overbought back under 50, confirming fading momentum, so I’m leaning short, expecting continuation of the grind lower rather than a sudden reversal. I might be wrong, but right now STRK looks more like a falling knife than a hidden gem.
My base case ✅ short bias while price stays below 0.052 with targets toward 0.046 first and then 0.043 if the selloff accelerates. If buyers suddenly punch through 0.052 and hold above that on volume, the script flips and we can easily squeeze into 0.056–0.058 where the next heavy resistance sits. I’m watching for weak retests of 0.050 to build shorts, and I’ll step aside fast if that level starts acting as firm support.
STRK – Down 57% From Jan High | Key Levels AheadSTRK has pulled back 57% from its January high, showing clear bearish momentum. Price is approaching key zones that could attract bulls — or trigger further breakdowns.
🔻 Support Zones
$0.0463 – A critical confluence zone:
Rejection point on Feb 5
Midpoint of last week’s long tail
May act as support ahead of Sunday's token unlock, which increases circulating supply.
$0.0410 – If $0.0463 fails, bulls’ stops lie here (Feb 6 low).
$0.0400 – Psychological level; no strong structure below but could trigger a short-term bounce.
🔺 Resistance Zones
$0.0534–$0.0549 – Initial supply zone:
Created by Feb 5 bearish candle void
Distribution zone on Feb 2
$0.0597 – Feb 3 swing high. Break above may trigger stop runs.
$0.0618 / $0.0639 / $0.0659 – Layered bearish voids from late January. Expect increased selling pressure here.
⚠️ Outlook
Bearish short-term trend
Watch how price reacts at $0.0463
Sunday’s token unlock could be a volatility catalyst
Bulls need to reclaim $0.0549+ to shift momentum
📌 Levels in Focus
Support: $0.0463 → $0.0410 → $0.0400
Resistance: $0.0534 → $0.0549 → $0.0597 → $0.0618–$0.0659
STRK – Horizontal Accumulation, Fake Breakout & Bearish OutlookPrice has spent a long time moving inside a horizontal accumulation range. Recently, the market attempted a breakout to the upside, but the move failed and quickly returned back inside the range — a classic fake breakout / deviation above resistance.
The failed breakout shifts the market structure toward weakness. As long as price stays below the upper boundary of the range, the main scenario remains bearish.
I expect continuation to the downside, with the next liquidity zones and potential targets located in the $0.055–$0.045 area.
A reclaim of the range high would invalidate the idea, but for now momentum favors sellers.
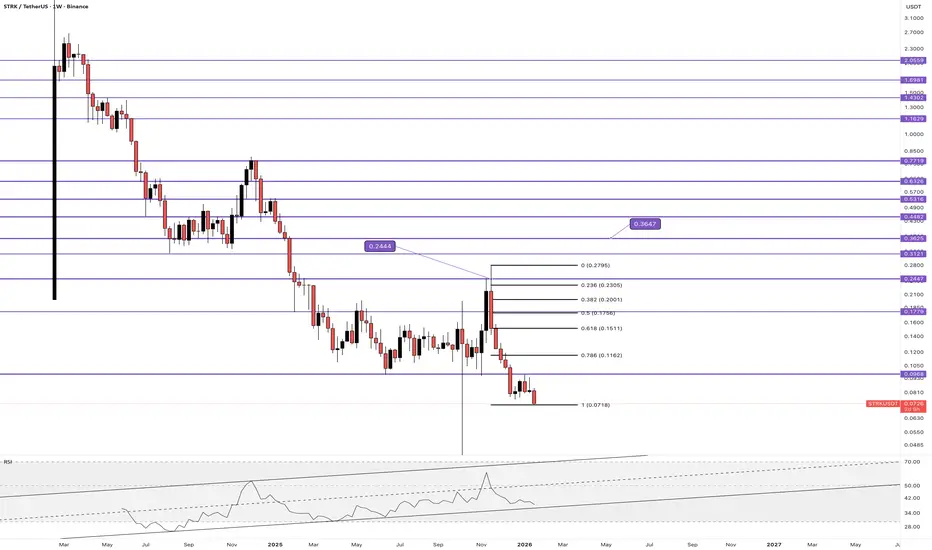
STRK/USDT — Price Breakdown With RSI Structural DivergencePrice has reached one of the targets and then resumed a sharp sell-off.
At the same time, RSI maintains a higher-low structure, creating a clear divergence with price action.
The $0.36 target becomes relevant again only after the start of a broader altcoin season.
I don’t see attractive long opportunities until price reclaims and holds above $0.10.
For now, the 1.0 Fibonacci extension from the low remains the key reference — Fibonacci levels are currently the most relevant framework for STRK.
$STRK Starknet #STRK #Starknet
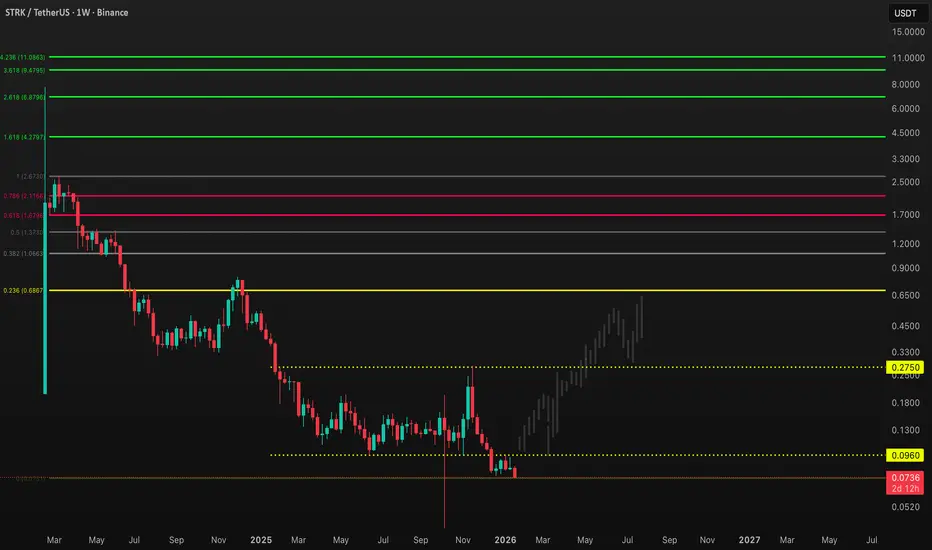
Price has swept liquidity on All time lows, Im expecting that price will return into accumulation zone $0.096 – $0.27 where price was accumulating for 360+ days and we saw positive NET Flows over last 4 months.
And waiting for breakout from accumulation zone towards first target $0.688 that also combines with 0.236 Fibonacci level
Key Levels to Watch:
Support/Accumulation : $0.096 – $0.27 accumulation zone
FirstTarget : $0.688 (0.236 Fib Level)
Market Sentiment : Bearish (Good for Long)
The Architect’s Blueprint: STRK’s Deep Value Torque PlayThe Architect’s Blueprint: Why Starknet Is The "Deep Value" Torque Play
While Bitcoin plays the role of the Emperor and Ethereum the King, Starknet (STRK) remains our "Architect"—a high-beta bet on the future of scaling that we purchased for pennies on the dollar. After catching the generational bottom in December, price action has cooled, but the structural foundation suggests this is merely the "quiet accumulation" before the violent expansion.
Here is the deep dive into the most volatile asset in our portfolio.
The Trade Anatomy: Catching the Knife Let’s be precise about our execution. Starknet didn't just correct; it capitulated, shedding 73% of its value in a straight line. We refused to panic. Instead, we identified the Major Long Signal on December 20th and entered at $0.0824, essentially catching a falling knife near the absolute bottom.
Currently, we are holding a modest gain of +3.6%. While the rapid profit we saw earlier has retraced, this consolidation is healthy. We are building a base at these levels ($0.085), effectively waiting for the rest of the market to recognize the value gap.
Institutional Data: The VC Disconnect The most important data point for STRK is what isn't happening: The selling has stopped. The brutal capitulation in December flushed out the leverage and the weak venture capital unlocks. The volume profile shows that "Smart Money" is now quietly absorbing supply in this lower range. The heavy selling pressure is exhausted, leaving a vacuum to the upside once demand returns.
The Structural Triad: Building the Base The "Architect" is currently in the construction phase, laying the groundwork for the next leg up. The Ichimoku Cloud on the 4H timeframe shows us fighting a key battle. Price is hovering right at the 4H EMA 50 ($0.085), using it as a pivot. We are consolidating just below the Cloud resistance, effectively compressing energy.
Structurally, the Wyckoff Analysis confirms we are deep in the accumulation schematic. The initial bounce was the "Automatic Rally," and the current boring price action is the "Secondary Test" of the lows. This phase is designed to transfer tokens from impatient retail holders to patient institutional hands.
Elliott Wave: The "Stress Test" Explanation For those new to this structure, what we are seeing is a classic "Deep Wave 2." Here is how it works:
The Impulse (Wave 1): We saw a clean jump from $0.075 to $0.096. This was the market proving that buyers had finally returned.
The Test (Wave 2): The market then crashed back down to $0.080. To a new trader, this looks like the trend failed. However, this is a "Stress Test." The algorithm drives price down deep—erasing 78% of the gains—specifically to scare you out of your position.
The Rule: In Elliott Wave theory, as long as the price does not drop below the starting point ($0.0756), the structure is valid. We held that level perfectly.
The Future (Wave 3): Because the test was successful, the next move is typically the strongest. This is Wave 3, where the price moves vertically because the sellers have all been shaken out.
Strategic Roadmap: The "Torque" Targets Because we entered so low, we don't need a moonshot to print massive returns. A simple mean reversion creates a massive opportunity. The immediate trigger to watch is the 4H EMA 200 at roughly $0.091, which acts as our "Line in the Sand." A close above this level confirms the stress test is over.
Once we clear that, the next major resistance is the Daily EMA 50 at $0.097. Clearing that level triggers the "Air Pocket," where very little volume history exists, allowing price to glide toward our "Fair Value" target of $0.153.
The Verdict Starknet remains the "Wildcard" in our deck. While the Majors offer safety, STRK offers pure torque. We are positioned near zero-risk, holding a bag of "Deep Value" tokens acquired at the bottom. The "Architect" takes time to build, but once the foundation is set, the vertical expansion is violent. We hold firmly for the $0.091 breach to confirm that Layer-2 season has officially begun.
The Architect’s Gamble: (STRK) & The "Deep Value" L2 PlayWhile Bitcoin is the "King" and Cardano is the "Dragon," Starknet (STRK) represents the "Architect"—a high-conviction, venture-style bet on the future of Layer-2 scaling. After a brutal capitulation event in December, the technicals confirm that the selling is exhausted, and a violent mean-reversion rally has begun.
Here is the analysis for the most volatile asset in our portfolio.
The Trade: Catching the Knife
Starknet didn't just correct; it capitulated. From the November 20th high of $0.28, it shed nearly 73% of its value in a straight line, bottoming at $0.0756 on December 23rd.
Our Entry: We identified the Major Long Signal on December 20th at approximately $0.0824. This was a contrarian entry when fear was at its peak.
Current Status: We are up ~11.2% from the signal close.
Recovery from Lows: Price is up +21.16% from the absolute bottom.
We have successfully "caught the knife" and are now building a base. Unlike the majors which are structurally sound, STRK is a Deep Value play—we bought it for pennies on the dollar, and the risk-reward ratio here is mathematically skewed in our favour (10:1).
Wyckoff Analysis: The Selling Climax
The drop to $0.075 on December 23rd bears all the hallmarks of a Wyckoff Selling Climax (SC).
The Flush: The speed of the drop (Nov-Dec) flushed out every weak hand. There is no leverage left.
Automatic Rally (AR): The current bounce to $0.091 is the first sign of life. We are essentially in Phase A/B of the accumulation structure.
The Lag: STRK is lagging the rest of the market by about 2-3 weeks. This is good. It means the "L2 Rotation" hasn't happened yet. When profits rotate from ETH to L2s, STRK is priced to move the fastest.
RSI & Momentum: The Sleeping Giant
The Daily RSI is sitting at 49.2. This is the "coiled spring" zone.
Under the Radar: While BTC and ETH are heating up (RSI 60+), STRK is dead neutral. It hasn't even started its run yet.
The Cross: A crossover above 50 (which is happening now) usually precedes the most explosive leg of a recovery rally.
Strategic Price Targets & Roadmap
Because STRK fell so hard, the Fibonacci retracement levels are massive percentage jumps away. We are trading so far below fair value that even a "dead cat bounce" yields 50% returns.
1. Immediate Resistance: $0.123 (High Probability)
The Level: The 0.236 Fibonacci Retracement.
The Play: This is our first milestone. A move to $0.12 would represent a 35% gain from current levels. This is where the first "bag holders" from November might look to exit, so expect resistance.
2. The "Fair Value" Target: $0.153 (Medium Probability)
The Level: The 0.382 Fib Retracement.
The Logic: Once the $0.12 resistance clears, there is very little volume history (air pocket) until $0.15. Price should glide through this zone quickly.
3. The "Golden" Target: $0.201 (Target for Q1)
The Level: The 0.618 Golden Pocket.
The Logic: A full recovery to the 0.618 level would be a ~120% gain from our entry. This is the power of the "Deep Value" play. We don't need a new All-Time High to double our money; we just need a standard market recovery.
The Verdict
Starknet is the "wildcard." The December 20th Signal got us in near the generational bottom. While BTC offers safety and ETH offers structure, STRK offers Torque.
We are positioned 11% in the green on an asset that is down 70% from its highs. The downside risk is negligible (we are near zero), but the upside is a 2x-3x multiple just to return to the mean.
Strategy: Hold firmly. This is not a trade to micro-manage. We wait for the $0.12 breach to confirm the L2 season has begun.