STX: local squeeze with $0.19 destinationThe Macro Picture 🗺️
STX unwound its May $0.30 highs through a steady descent, and the selling has since stalled into a base. For the past five weeks price has ground sideways in a tight $0.16–0.19 band — the trend has flattened, sellers have lost momentum, and each dip toward the lows has been met with buyers. Price now sits right on the $0.16 support with RSI holding around 40. This is the quiet, coiled part of the cycle where a floor gets built before the next move, and buying into a defended support rather than chasing offers the higher-confluence entry.
The Setup ⚙️
The Buy Area: The $0.15–0.16 band has repeatedly absorbed selling pressure. Bulls are defending this floor, and as marked on the chart, price is holding just above it with the base intact.
The Ceiling: The $0.19 decision line caps the range. A clean reclaim flips the local structure bullish and opens the path toward the $0.24 macro resistance above.
The Range Play: The zone between $0.16 and $0.19 creates a structural playground for grid-based accumulation — staggered entries across the range capture the chop while the market decides its next macro leg.
The Roadmap: Primary target sits at $0.19 — the green roadmap points there as price works up from the support toward the range top. Invalidation: a clean daily close below $0.15 would invalidate this bullish thesis and signal a structural breakdown out of the base.
More setups in profile.
#STX #CRYPTO #Stacks #Bitcoin #TechnicalAnalysis
In-depth trading ideas
STX / STXUSDT Bullish Setup | Futures Trade IdeaMARKET ANALYSIS
STX is currently reacting from a key technical area highlighted on the chart.
As long as the protected support zone remains intact, the bullish market structure remains valid and higher liquidity targets may continue to attract price action.
A breakdown below the invalidation level would weaken the current bullish scenario and require a reassessment of market conditions.
📍 Entry, Stop Loss and Take Profit levels are marked directly on the chart.
━━━━━━━━━━━━━━
⚠️ DISCLAIMER
This publication is provided solely for educational and market observation purposes.
Nothing contained in this analysis should be considered financial advice, investment advice, or a recommendation to buy or sell any financial instrument.
All trading and investment decisions remain solely the responsibility of the individual trader.
Always conduct your own research and apply proper risk management before entering any position.
━━━━━━━━━━━━━━
🎯 PARALOG
▪️Crypto Market Analysis
▪️BTC Futures Signals
▪️Bitcoin & Altcoin Market Analysis
Precision • Momentum • Timing
━━━━━━━━━━━━━━
Exchange: #MEXC Futures
#bitcoin #btc #crypto #futures #technicalanalysis
STXUSDT - Bear Flag, Breakdown or Rebound from Support?On the 2H timeframe, STXUSDT remains in a bearish trend 📉 and is currently forming a Bear Flag 🐻🚩, a classic continuation pattern that typically develops after a strong sell-off (flagpole) ⬇️, followed by a temporary upward-sloping consolidation channel 📈.
At the moment, the price has declined toward the lower trendline (support) 🔴. This area is a critical zone ⚠️ that will likely determine the next major move.
As long as the price remains inside the Bear Flag 🐻🚩 and fails to break above the upper resistance channel ⛔, selling pressure continues to dominate the market. 📉
---
🐻🚩 Bear Flag Pattern Explanation
🔻 Flagpole
📉 Formed by a sharp and aggressive decline before the consolidation phase began.
💥 This indicates strong seller dominance and bearish momentum.
🔻 Flag
📈 The price moves gradually higher within an ascending channel.
🔄 This upward movement is considered a retracement, not a trend reversal.
📊 Trading volume typically decreases during the formation of the flag.
🔻 Bearish Confirmation
✅ A valid bearish confirmation occurs when the price breaks below the lower trendline with a strong bearish candle.
⬇️ Such a breakdown could trigger another leg lower, continuing the direction of the original flagpole.
---
🟢🚀 Bullish Scenario
A bullish outlook will only gain confirmation if:
✅ The price successfully holds above the channel support.
📈 A strong rebound develops from the lower trendline.
🚀 The price breaks above the upper resistance channel with increasing trading volume.
🎯 If this breakout is confirmed, STX could continue higher toward the next resistance levels, invalidating the current Bear Flag pattern.
---
🔴📉 Bearish Scenario
The bearish scenario remains the primary outlook as long as:
❌ The price stays below the channel resistance.
📉 Selling pressure continues to increase.
⬇️ A confirmed breakdown occurs below the Bear Flag lower trendline.
🎯 If the channel support fails, the price could continue its decline toward the horizontal support around 0.1602.
⚠️ If that support is also lost, further downside toward the next support levels becomes increasingly likely based on the current market structure.
---
🎯📌 Conclusion
STXUSDT is currently trading at a critical decision point ⚠️ that is likely to determine its next major direction.
🐻🚩 The Bear Flag remains valid until a confirmed breakout above the channel occurs.
👀 Traders should wait for a clear confirmation before entering a position, as volatility is expected to increase once the price breaks out of this pattern.
🛡️ Always prioritize proper risk management, especially when trading around key support and resistance levels.
---
#STX #STXUSDT #Stacks #Crypto #Cryptocurrency #TechnicalAnalysis #ChartAnalysis #BearFlag #Bearish #PriceAction #Support #Resistance #Altcoin #CryptoTrading #SwingTrading #Breakdown #RiskManagement
Stacks (STX) Technical AnalysisSTX is still trading in a clear downtrend, with price recently slipping below a key range support area. That breakdown puts bears in control for now, but the move is happening near a high-volume zone, which means this area could become important for a reaction.
The main thing I’m watching is whether STX can reclaim the broken support and turn it back into a base. If buyers step in, we could see a relief move back toward the prior range. If price rejects and stays below, the chart remains weak and could look for another liquidity sweep.
Momentum is still soft, but the downside is starting to look stretched. That usually means patience matters here. A reclaim would be the first sign of strength. Until then, the trend is still defensive.
For now, STX is at a decision zone: reclaim and recover, or reject and continue the breakdown structure.
STX Looks Ready for a Strong Uptrend !The previous bearish cycle of STX lasted approximately 630 days. The current bearish cycle has now been in progress for more than 820 days, and a trend reversal is expected to occur soon. However, a clear support zone must also be present, as entering a position based solely on time is not a sufficient reason to buy.
We have a support zone that previously launched the price strongly to the upside. As the price revisits the marked Order Block (OB), a strong bullish reaction is expected for STX. This setup becomes even more interesting considering the liquidity pool located below the current price, which is likely to be swept first.
Consider entering a position either through DCA within the OB zone or by waiting for confirmation and a valid entry trigger.
The targets are marked on the chart.
If you would like us to analyze a coin or altcoin for you, first like this post, then comment the name of your altcoin below.
What is your opinion about Stacks?
STXUSDT.P — 14.05.2026 Phase 2 Trade Setup
Price spent an extended period consolidating within the 0.25–0.27 range before breaking out and pushing to the 0.29 resistance zone. It has since pulled back and found support at the 0.25 level — a zone that held as strong demand.
📊 Current Situation:
Price is now sitting directly on top of the EMA 50 in a flat/sideways structure. The EMA 50 itself is not yet clearly sloping upward, and MACD momentum remains weak, with the histogram and signal line showing no strong conviction yet.
🎯 What I Need to See for a Long Entry:
• A clean bullish break and hold above the 0.25 zone
• EMA 50 is beginning to slope upward with the price sustained above it
• MACD line crossing above signal line with at least 2 consecutive green histogram bars (no fading greens on entry)
• Entry candle: hammer, bullish engulfing, or two consecutive green candles, no pump candles
⚠️ No trade until full confluence is confirmed. Currently on watch only.
TP: 0.2834 area (nearest resistance)
SL: Max 3 candles below entry / just below EMA 50 (5–7% range)
Leverage: ≤ 20x
Not financial advice. Trade your own plan.
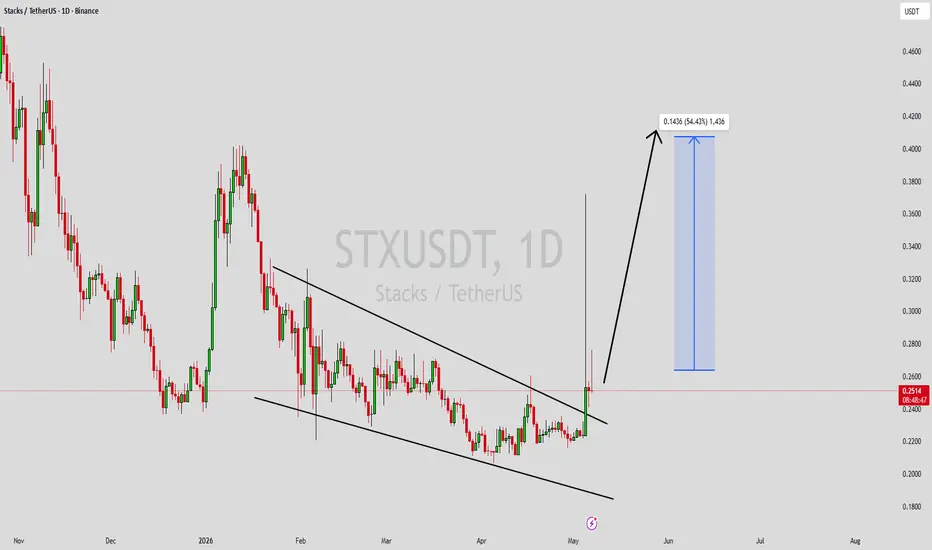
STXUSDT Forming Falling WedgeSTXUSDT is forming a clear falling wedge pattern, a classic bullish wave signal that often indicates an upcoming breakout. The price has been consolidating within a narrowing range, suggesting that selling pressure is weakening while buyers are beginning to regain control. With consistent volume confirming accumulation at lower levels, the setup hints at a potential bullish breakout soon. The projected move could lead to an impressive gain of around 40% to 50% once the price breaks above the wedge resistance.
This falling wedge pattern is typically seen at the end of downtrends or corrective phases, and it represents a potential shift in market sentiment from bearish to bullish. Traders closely watching STXUSDT are noting the strengthening momentum as it nears a breakout zone. The good trading volume adds confidence to this pattern, showing that market participants are positioning early in anticipation of a reversal.
Investors’ growing interest in STXUSDT reflects rising confidence in the project’s long-term fundamentals and current technical strength. If the breakout confirms with sustained volume, this could mark the start of a fresh bullish leg. Traders might find this a valuable setup for medium-term gains, especially as the wedge pattern completes and buying momentum accelerates.
✅ Show your support by hitting the like button and
✅ Leaving a comment below! (What is your opinion about this Coin?)
Your feedback and engagement keep me inspired to share more insightful market analysis with you!
STXUSDT Forming Falling WedgeSTXUSDT is forming a clear falling wedge pattern, a classic bullish wave signal that often indicates an upcoming breakout. The price has been consolidating within a narrowing range, suggesting that selling pressure is weakening while buyers are beginning to regain control. With consistent volume confirming accumulation at lower levels, the setup hints at a potential bullish breakout soon. The projected move could lead to an impressive gain of around 40% to 50% once the price breaks above the wedge resistance.
This falling wedge pattern is typically seen at the end of downtrends or corrective phases, and it represents a potential shift in market sentiment from bearish to bullish. Traders closely watching STXUSDT are noting the strengthening momentum as it nears a breakout zone. The good trading volume adds confidence to this pattern, showing that market participants are positioning early in anticipation of a reversal.
Investors’ growing interest in STXUSDT reflects rising confidence in the project’s long-term fundamentals and current technical strength. If the breakout confirms with sustained volume, this could mark the start of a fresh bullish leg. Traders might find this a valuable setup for medium-term gains, especially as the wedge pattern completes and buying momentum accelerates.
✅ Show your support by hitting the like button and
✅ Leaving a comment below! (What is your opinion about this coin?)
Your feedback and engagement keep me inspired to share more insightful market analysis with you!
Stacks (STX) · Bullish Breakout with Great Entry (Spot vs Lev)This is a great chart and situation in so many ways... It is hard to find this kind of chart setup and timing. It only happens every few years. The last time STXUSDT (Stacks) looked like this, it was November 2022 and December 2022. A long time ago and the previous bear market bottom.
Very interesting, it was the bear market bottom. And this time around, we also have a bear market bottom. This time it is better though. The current active session already produced a huge move and this can be seen by the long upper-wick on the candle. The bulls are in, buying is already happening, we are going up.
But, there is a retrace right away. The market doesn't grow in one single burst in one single day. It takes time and this is where the opportunity shows up.
STXUSDT retraced much of the action that it produced recently, but continues with a hyper bullish, incredibly strong chart. One that says, "Buy today and tomorrow you will be green. Buy and keep big-easy wins."
The current session has the highest volume since December 2024 and it is yet to close. As usual, the difference between December 2024 and May 2026 is huge, from heaven to earth.
In late 2024, STXUSDT was trading at a peak ready to start a major correction, trading volume was really high though. In May 2026, STXUSDT is trading at the bottom ready to start a major advance and here trading volume is super high. It is the highest in years as the bottom gets confirmed.
This is the situation that is telling me that this project right now is an easy win. The wait is over. You can approach the market in any way you can. Be careful with the leverage though, only use it when you feel 100% certain of what is going to happen next. When in doubt, go spot and secure an easy win.
Many projects will grow 500-1000% in a matter of weeks or months. With this high potential, leverage shouldn't be abused and in many cases it can even be ignored. Leverage for short-term intraday trading, or maybe even mid-term with our strategy. Spot for long-term holders, accumulators and investors. Spot for peace of mind, passive trading, sure and easy win.
In the worst case scenario, a wrong decision with spot becomes a long wait, nothing more. When it comes to leverage, a mistake can result in a huge loss. The decision is yours.
I love you. Thanks a lot for your continued support.
Namaste.
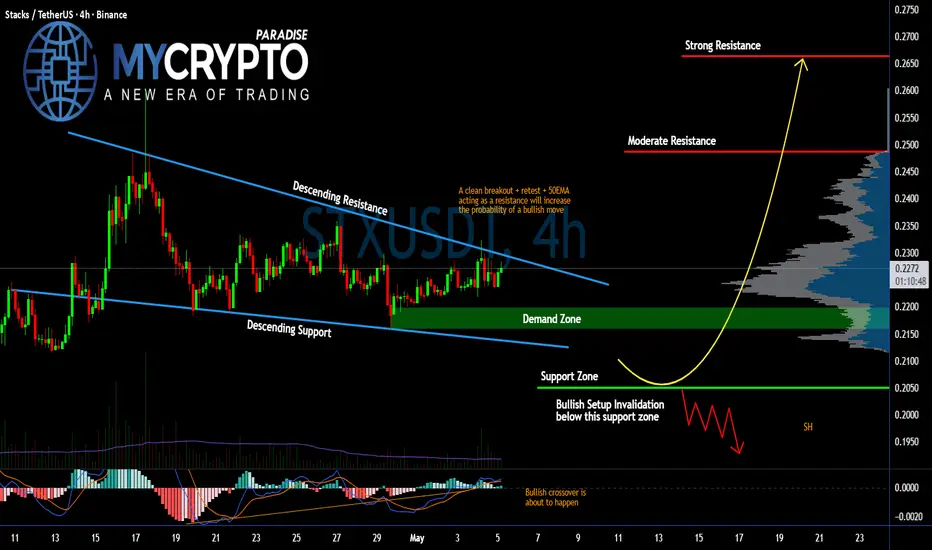
#STX Ready For a Short Term Recovery | Bears Might Retreat NowYello, Paradisers! Is #STX about to explode from this tightening structure, or is the market preparing another brutal shakeout before the real move begins? Let's view #Stacks setup:
💎#STXUSDT is currently trading inside the falling wedge. This structure reflects a controlled bearish phase, but also a potential accumulation zone as price compresses between strong support and dynamic resistance. The key demand zone around $0.22 is holding the price steady for now, acting as a critical support level. As long as #STXUSD remains above this area, the bullish scenario is still valid. This zone has already shown signs of buyer interest, making it a decision point for the next major move.
💎A breakout above the descending resistance trendline, combined with a successful retest and the 50EMA flipping into support, would significantly increase the probability of a bullish continuation. If that confirmation happens, the first target is the moderate resistance at $0.248, where some rejection is expected. A clean break above this level opens the path toward the major resistance at $0.266, which aligns with a strong supply zone and could act as the next major barrier.
💎From a momentum perspective, the MACD is showing early signs of a bullish crossover, indicating that bearish momentum is fading and buyers are slowly stepping in. However, patience is still required as price confirmation is not fully established yet.
💎On the downside, if #STXUSD loses the support zone around $0.205, the bullish setup becomes invalid. This would likely trigger further downside movement and continuation within the bearish structure, potentially trapping early buyers.
Trade smart, Paradisers. This setup will reward only the disciplined.
MyCryptoParadise
iFeel the success🌴
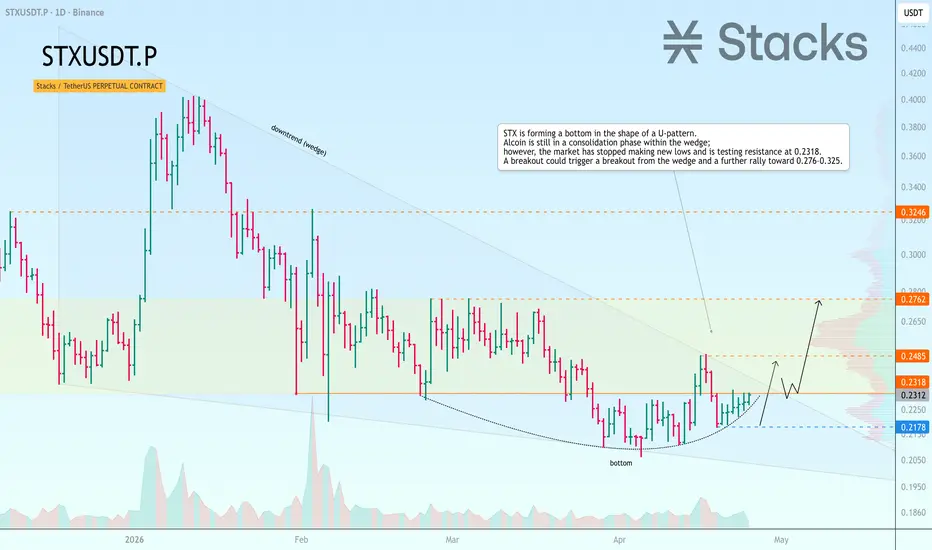
STXUSDT has formed a bottom and is poised to rise STX is forming a bottom in the shape of a U-pattern. The altcoin is still in a consolidation phase within the wedge; however, the market has stopped making new lows and is testing the resistance level at 0.2318. A breakout could trigger a breakout from the wedge and a further rally toward 0.276–0.325
If the price returns to the 0.2318–0.2762 range, it will open the way to the resistance of this neutral channel. However, there may be enough momentum to break through the resistance and continue rising toward 0.325
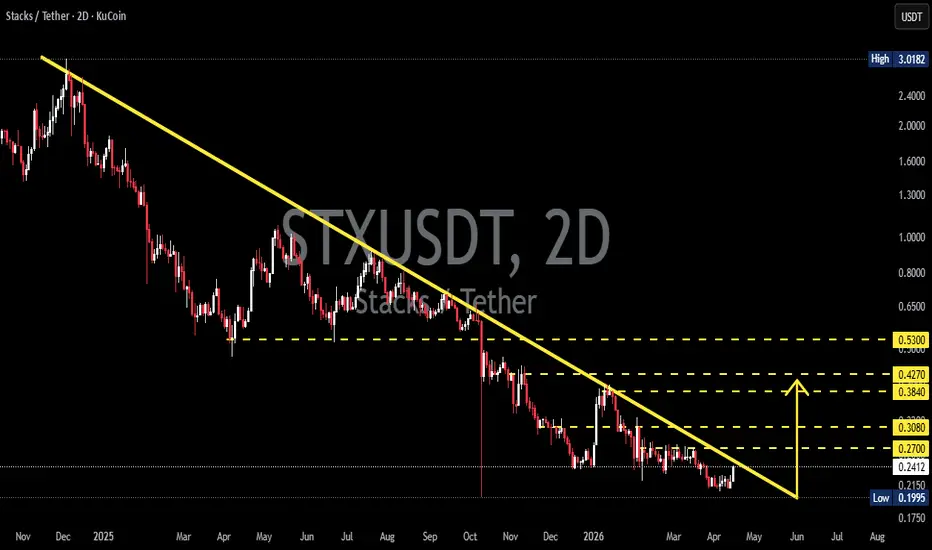
STXUSDT — Downtrend Pressure Peaks, Reversal Potential?The STX/USDT 2D timeframe clearly shows a strong downtrend since its peak around 3.0+. Price continues forming lower highs and lower lows, confirmed by a well-respected descending trendline (yellow line) acting as dynamic resistance.
Currently, price is sitting at a key support zone around 0.19 – 0.21, which could become a major reaction area.
---
📐 Pattern Structure
🔻 Descending Triangle (Bearish Continuation Pattern)
Descending trendline acting as resistance
Horizontal support at the lower range (0.19 – 0.21)
Indicates dominant selling pressure
However:
Price is now consolidating at support
Volume appears to be decreasing → possible accumulation phase
➡️ This opens the possibility of a false breakdown or reversal if support holds.
---
📊 Key Levels
Main Support: 0.19 – 0.21
Nearest Resistances:
0.27
0.30
0.38
0.42
0.53
These resistance zones previously acted as distribution areas.
---
🟢 Bullish Scenario
If price:
Holds above 0.19 – 0.21
Breaks out above the descending trendline
Then potential moves:
Rise toward 0.27 → 0.30
Continue to 0.38 – 0.42
Possibly retest 0.53 if momentum is strong
📌 Confirmation signals:
First higher high formation
Increasing volume during breakout
➡️ This would signal an early trend reversal
---
🔴 Bearish Scenario
If price:
Breaks down below 0.19 support
Then potential outcome:
Drop toward 0.17 or lower
Continuation of the lower low structure
📌 Confirmation signals:
Strong candle close below support
Failed retest (rejection from below)
➡️ This confirms continuation of the downtrend
---
⚠️ Key Insight
Price is currently at a critical decision zone
Combination of strong support + descending resistance → high probability of a major breakout move
Suitable for:
Breakout traders
Reversal traders (higher risk, higher reward)
---
🏷️ Conclusion
STX is approaching the end phase of its downtrend pressure, forming a clear descending triangle. The support zone will determine whether price continues downward or triggers a significant reversal.
#STXUSDT #CryptoAnalysis #TechnicalAnalysis #Altcoins #DescendingTriangle #Breakout #Reversal #SupportResistance #CryptoTrading #PriceAction #AltcoinSeason
STXUSDT 1D#STX has broken out above the falling wedge pattern on the daily chart and is currently facing the SMA50, which we believe it will surpass soon. The potential upside targets are:
🎯 $0.2528
🎯 $0.2813
🎯 $0.3044
🎯 $0.3275
🎯 $0.3603
🎯 $0.4021
⚠️ Always remember to use a tight stop-loss and maintain proper risk management.
$STX Down 93% From ATH: Is This The Best Entry For A 4700% ?NASDAQ:STX Down 93% From ATH: Is This The Best Entry For A 4700% Potential Return?
#STX Trapped Retailers With A Fake Inverse Head & Shoulders Setup Near The Neckline Resistance, Dumping -93% From The Highs. Everyone Was Thinking Inverse H&S Pattern Forming And Traders Got Trapped.
But Remember If Any Head & Shoulders Pattern Forms At The TOP, 90% Of The Time It's A Trap Designed To Make You Exit Liquidity For Smart Money.
Now Price Is Sitting Inside A High-Risk HTF Accumulation Zone After The Full Liquidation Phase.
Technical Structure
✅ Previous Cycle High: $3.84 Neckline Resistance (Exit Liquidity Zone)
✅ Macro Correction: -93.64% From Local Highs
✅ Fake Inverse H&S Trap: Classic Distribution At The Top
✅ HTF Bullish Order Flow / Breaker Block: $0.110 - $0.070
✅ Breakout + Retest Of Ascending Trendline Support
✅ Liquidity Sweep Below Dynamic Trendline (SSL Grab)
✅ Bullish Structure Valid Only Above $0.40 Reclaim
✅ Risk Invalidation: 2W Close Below $0.043
Pattern Psychology
⚠️ H&S Patterns At The TOP Are 90% Of The Time A Trap
⚠️ Smart Money Uses Bullish Looking Setups To Distribute Bags To Retail
⚠️ Real Opportunity Comes After The Dump, Not During The Hype
Key Levels
👉 HTF Demand: $0.110 - $0.070 (Accumulation Zone)
👉 Breakdown: 2W Close Below $0.043
👉 Trend Reclaim: $0.40 (S/R)
Bull Cycle Targets: $0.40 / $1 / $2.50 / $3.50+
Potential Upside: +2,775% To Neckline / +4,798% On Measured Move
The $0.110–$0.070 Region Represents A High-Risk HTF Accumulation Zone For STX/USDT Ahead Of A Potential Long-Term Expansion Phase.
TA Only. Not Financial Advice. Manage Risk.
Is STX at the Most Important Level in Its Entire History?Major level in play:
STX is sitting at the 0.618 retracement of its entire move — historically a key decision zone.
Strong support reaction:
Price has tapped $0.20–$0.25 multiple times, with buyers consistently stepping in.
Bearish pressure remains:
RSI below 50 and overall downtrend still intact — no confirmed reversal yet.
Critical moment:
Hold this zone → potential long-term base
Lose it → opens move toward $0.11 / cycle lows
In Summary
STX is currently trading at one of the most important levels on its entire chart, sitting at the 0.618 Fibonacci retracement of its full historical move. This $0.20–$0.25 zone has acted as strong support multiple times, with buyers stepping in on each test. However, broader momentum remains bearish, with RSI below 50 and no confirmed reversal yet. Holding this level could form a long-term base, while a breakdown would likely open the door to significantly lower prices.
Stacks: poised for breakout? key levels to monitor todayStacks
Who’s farming sats on L2 while everyone stares at the majors? Today the headlines around Bitcoin ecosystem projects heating up again are giving Stacks some attention, and according to the market, capital is slowly rotating back into BTC side plays. Price is stuck in a tight 4H range, which usually breaks hard once one side gives up.
On the 4H chart I see price bouncing cleanly from the green demand zone around 0.245 and pushing back into mid‑range, while RSI is curling up above 50, hinting at fresh momentum. As long as that 0.245 area holds, I’m leaning long, looking for a squeeze into the upper liquidity pocket near 0.265 and potentially the red supply zone above. I might be wrong, but this looks like smart money quietly loading before a move.
My plan: ✅ base case is continuation toward 0.265 then 0.27 where I’d start taking profits and watch reaction. If price loses 0.245 with a strong 4H close, I flip the bias and expect a slide back toward the lower demand near 0.235. I’m waiting for a clean retest of support and a higher low to add, no FOMO in the middle of the range.
My Investment Plan in STX for 2026Hello everyone,
I’d like to share one of my crypto investment that I have decided to make for 2026.
Fundamental Analysis :
Stacks is a project that adds smart contracts and apps to Bitcoin, allowing people to build DeFi and other services while still using Bitcoin’s strong security. One big advantage is that it is connected directly to Bitcoin, which makes it more secure and trusted than many newer blockchains. It also lets users earn Bitcoin rewards by stacking their STX tokens. Overall, Stacks benefits from Bitcoin’s popularity while adding new features that Bitcoin alone does not support.
Stacks has strong fundamentals for the coming years. The number of long-term holders is increasing, especially toward the end of 2025. Investor trust in the project remains solid, and interest could grow further with the expansion of crypto investment products such as ETFs.
Technical Analysis :
The price is currently entering a major historical accumulation zone between $0.2 and $0.3, where buyers are starting to build positions.
Risk Management :
- My first order was executed at $0.25 (spot) at the current market price.
- I will place a second order (not defined yet) in case of general market crash.
Target :
My main target is the previous ATH. This target may change depending on how the uptrend develops. I will keep this post updated as the situation evolves.
Disclaimer
This is not investment advice. I am only sharing my personal portfolio and trading plan. I am aware of the risks, and I am ready to lose all the money invested if the price goes to zero.
BINANCE:STXUSDT.P COINBASE:STXUSD COINBASE:STXUSDC BITFINEX:STXBTC BITFINEX:STXUSD
STXUSDT 12H#STX has broken above the descending resistance on the 12H timeframe and is currently interacting with the SMA 50. You can buy a small bag here and add another bag near the trendline. The potential upside targets are:
🎯 $0.2901
🎯 $0.3115
🎯 $0.3328
🎯 $0.3633
⚠️ Always use tight stop-losses and maintain strict risk management.
Stacks: poised for a drop? key levels to watch for todayStacks traders, ready for a play on the Bitcoin L2 kid that everyone watches but few actually trade? Lately headlines around Bitcoin ecosystem projects are heating up again, while Stacks is just grinding sideways under local resistance. That combo often ends with a sharp move when late money finally wakes up.
On the 4H chart price is stuck in a heavy supply zone around 0.27-0.28 with clear lower highs and a tired RSI rolling down from near 60. Volume profile shows a fat node right above, so if bulls cannot reclaim it fast, sellers usually press it back toward the next demand around 0.25 and then 0.23. I lean short here, expecting another leg down before any serious trend change.
My base plan ✅ wait for a rejection pattern in this red zone and ride a short into 0.25, maybe extend toward 0.23 if momentum stays bearish. Invalidation for me is a confident 4H close above roughly 0.285-0.29, which would open the door for a squeeze toward 0.30-0.32 instead ⚠️ I might be wrong, but until that breakout happens I prefer to stay with the prevailing downtrend.
STXUSDT Forming Bullish MomentumSTXUSDT is forming a clear bullish momentum pattern, a classic bullish reversal signal that often indicates an upcoming breakout. The price has been consolidating within a narrowing range, suggesting that selling pressure is weakening while buyers are beginning to regain control. With consistent volume confirming accumulation at lower levels, the setup hints at a potential bullish breakout soon. The projected move could lead to an impressive gain of around 90% to 100% once the price breaks above the wedge resistance.
This bullish momentum pattern is typically seen at the end of downtrends or corrective phases, and it represents a potential shift in market sentiment from bearish to bullish. Traders closely watching STXUSDT are noting the strengthening momentum as it nears a breakout zone. The good trading volume adds confidence to this pattern, showing that market participants are positioning early in anticipation of a reversal.
Investors’ growing interest in STXUSDT reflects rising confidence in the project’s long-term fundamentals and current technical strength. If the breakout confirms with sustained volume, this could mark the start of a fresh bullish leg. Traders might find this a valuable setup for medium-term gains, especially as the pattern completes and buying momentum accelerates.
✅ Show your support by hitting the like button and
✅ Leaving a comment below! (What is your opinion about this Coin?)
Your feedback and engagement keep me inspired to share more insightful market analysis with you!