Return Of The Quenn - Wave Analysis - SUI (4H)In the previous analysis we reached our targets and even beyond but one thing was missing:
Wave counting.
Today, waves and possible scenarios are very clear. Stay with me and I'll go over them one by one.
Scenario One: Leading Diagonal
In this scenario, SUI will rise even beyond the current highs. Overlaps of the waves are necessary and normal. The difference is the wave counting inside. In this scenario, inner waves must be going in harmony. Also, moves will take longer time and it will k
SUI / Tether
No trades
No trades
In-depth trading ideas
SUI: Testing Key Support Near Descending Trend BoundarySui ( BINANCE:SUIUSDT ) is currently trading at $0.86, approaching a crucial technical junction.
Technical Breakdown:
Current Setup: After getting rejected from the "Resistance & Trend Test" around the macro descending trendline originating from 2025, price has pulled back into the immediate Support 1 line ($0.89).
Trend Dynamics: The major descending resistance line continues to dictate the broader macro structure. A confirmed breakout above this trend boundary is required to shift m
Where is the SUI buy zone? (4H)UNI appears to be in Wave C of a corrective pattern. Based on the current structure, this bearish wave is expected to continue toward the green zone, where the correction could potentially come to an end. If price reacts positively from this area, we may see a reversal to the upside and the beginning of a new bullish move.
We will be looking for potential buy/long opportunities within the green zone, while waiting for price action to confirm the scenario.
The target levels are marked on the ch
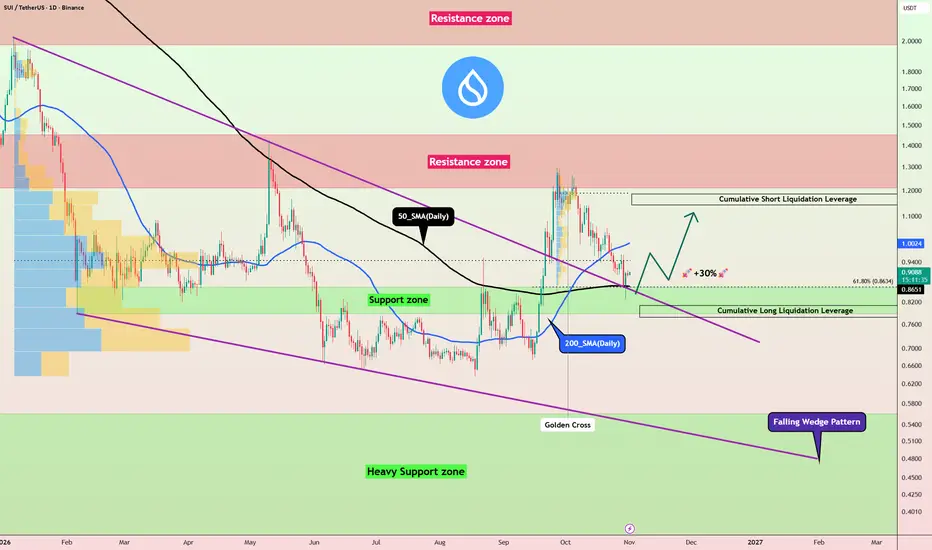
SUI Flashes a Golden Cross — Is a 25% Rally Coming?SUI is trading near a major support area after recent selling pressure, while several technical signals are beginning to favor a potential bullish recovery.
Fundamentally, Sui continues to expand through Mercado Bitcoin in Brazil, its growing DeFi ecosystem, and tokenized assets, although upcoming token unlocks and increasing circulating supply remain short-term risks.
Can SUI defend this support and break $0.95 to trigger its next major rally?
Fundamental Outlook
Sui continues to show prom
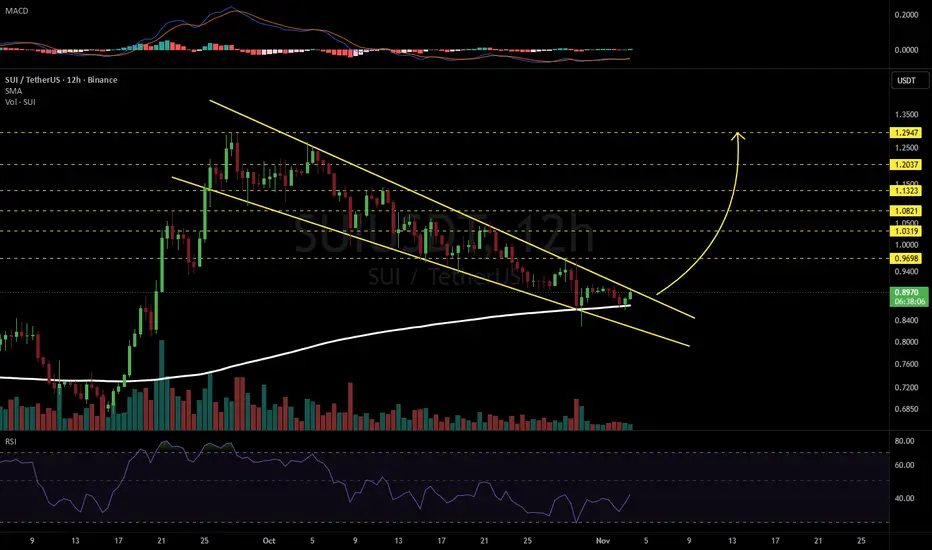
SUIUSDT 12H#SUI is moving inside a falling wedge on the 12-hour timeframe. The price is holding firmly above the 12H SMA200 and is expected to test the wedge resistance. In case of a breakout above the pattern, the potential upside targets are:
🎯 $0.9698
🎯 $1.0319
🎯 $1.0821
🎯 $1.1323
🎯 $1.2037
🎯 $1.2947
⚠️ Always remember to use a tight stop-loss and maintain proper risk management.
#SUIUSDT A Potential Bullish Reversal: Is a New Rally Ahead ?#SUI
SUI is considered one of the stronger cryptocurrencies in the market and is closely watched by traders as a potential indicator of recovery across the altcoin market.
Since May, SUI has experienced two major upward movements, both followed by price corrections within descending price channels, representing a corrective phase after the previous bullish rallies.
Currently, the price is trading within a descending channel and has reached the 200-day Moving Average (MA200), which represents
$SUI | 4H | BUY SETUP |🚨 CRYPTOCAP:SUI has a clean demand zone sitting under price.
It also has ~6B tokens that haven’t hit the market yet.
Most traders are only looking at the first part.
📊 The setup on the 4H (Binance):
Price: $0.9164
Buy order block: $0.8939–$0.8580
Range high: $0.9650
Range low: $0.8277
The common read is “-83% from the $5.35 ATH, so buy the dip at the block.”
The number I’d check first is supply. About 4.0B of 10B SUI is circulating. At this price the FDV is about $9.2B.
The Nov 1 unlock
SUI 6H – Higher Low Off Rising TrendlineSui is trading around 0.9329 on the 6H timeframe after bouncing off the ascending trendline for the second time, now pressing the horizontal level near 0.9350 after a recovery from the early November low near 0.8600.
The structure here began with the September 15 low near 0.6750, where the rising trendline originates. SUI broke out through 0.9350 and 1.0500 and reached a high near 1.2900 on September 28. A range between 1.0500 and 1.2600 followed, with a lower high near 1.2600 on October 5 befo
SUI / USDT ( BULLISH REVERSAL SETUP)Market Structure & Technical Outlook
Price has been in a bearish trend, consistently forming Lower Highs (LHs) and Lower Lows (LLs). However, bullish RSI divergence on both the 1H and 4H timeframes indicates a potential weakening of bearish momentum.
Furthermore, price is forming a Falling Wedge pattern, which is commonly associated with a potential bullish reversal. Following the bullish divergence, price entered a sideways consolidation phase, which may indicate that selling pressure is wea
IS $SUI THE NEXT 1000% CRYPTO OPPORTUNITY?SAMSUNG + $500M+ BACKING + AI… IS CRYPTOCAP:SUI THE NEXT 1000% CRYPTO OPPORTUNITY?
👉 Samsung Wallet: USDC transfers targeting 82M U.S. Galaxy devices.
👉 $30M investment in DATA Network.
👉 $500M+ committed to Hashi Bitcoin finance.
👉 Cetus brings AI agents into DeFi.
Could These Sui Network Catalysts Fuel A Rally Toward $10–$20?
BULLISH BREAKOUT OR OVERHYPED NARRATIVE? 👇 WHAT'S YOUR CRYPTOCAP:SUI TARGET?
NFA & DYOR
SUI/USDT Key Support Holds as Bullish Rebound Potential Emerges#SUI
SUI is currently trading near a major support zone at 0.9200–0.9350, following a clear downward move from the resistance area around 1.0500. The chart shows an attempt to rebound from this support zone, while the price is approaching a potential breakout above the descending trendline. A confirmed breakout could open the door for further upside.
Key Technical Levels
Major Support Zone: 0.9200–0.9350
The current price reaction zone. Holding above this area could trigger a bullish rebound.
SUIUSDT - SWING TRADE 1:3 - Bullish - Rising Wedge Pattern Market Structure — 4H Timeframe
1)Lower Highs (LH) and Lower Lows (LL) are forming.
2)Rising Wedge pattern is developing on the 4H and
3)Bullish flag Pattern on daily time frame
Trade Plan — Risk-to-Reward: 1:3
Entry: 0.9662 - or when the trend line breaks
Stop Loss: 0.8936
Take Profit: 1.1866
Trade Rationale:
The Rising Wedge pattern on the 4H and is the key structure we are monitoring. Our trade idea is based on the possibility that price will move towards the recent High on 4H and.We
Sui: Current Support Is Now Doing the Heavy LiftingWeekly Structure Weakening
CRYPTOCAP:SUI continues to pull back from the $1.2947 high, with price now trading beneath the bullishly crossed 21/8-week EMAs. Both averages are beginning to slope lower and contract, suggesting the recent recovery is losing momentum.
Initial Support Lost
The previous $0.9540 swing high has failed to provide support, with price now testing the 0.618 Fibonacci retracement at $0.8873. This leaves bulls increasingly reliant on the remaining support beneath.
Key
SUI/USDT – Trendline Pressure, Sellers Take in🔵 BINANCE:SUIUSDT remains bearish on the H3 chart, with price still below the descending trendline and Ichimoku resistance.
I’m watching the 0.9420–0.9874 sell zone. A rebound into this area followed by rejection would keep the lower-high structure intact.
🎯 Target: 0.811
A sustained H3 recovery above 0.9874 would weaken the bearish setup.
AURICVERSE View: the broader trend still favors sellers. I prefer a retest of 0.9420–0.9874 rather than selling the current low, with 0.8110 as the
SUIUSDT: Retest Open the Way to 0.80SUI remains bearish inside the descending channel, with price trading below both moving averages around 0.95 and 0.99.
The main resistance sits around 0.93–0.98. A rebound into this zone, especially near the upper channel boundary, could attract sellers again.
If rejection appears, the next downside areas are 0.86, followed by the main target around 0.80–0.81.
Macro remains cautious ahead of the Fed meeting. US 10-year yields have eased toward 4.97% and oil has pulled back, but Bitcoin and Et
SUI/USDT.P 30-Minute Swing Trading Long PlanSUI/USDT.P 30-Minute Swing Trading Long Plan
Basic Trading Parameters
• Trading Pair: SUI/USDT.P (Perpetual Contract)
• Time frame: 30 Minutes
• Trading Style: Swing Long Trade
• Entry Level: Around 0.8510 USDT (Direct market long entry)
• Hard Stop Loss: 0.8380 USDT
• Risk-Reward Ratio: 1 : 7.89
Entry Rule
Open long position directly near the current market price of 0.8510 USDT, based on the bullish swing structure on the 30-minute time frame.
Tiered Take Profit & Dynamic Risk Managem
SUI / USDT (DOUBLE BOTTOM FORMATION)Market Structure & Technical Outlook
Price is currently in a bearish trend, consistently forming Lower Lows (LLs) and Lower Highs (LHs). However, bullish RSI divergence on the 1H timeframe indicates a potential loss of bearish momentum. Additionally, a Double Bottom pattern has formed at a strong support zone, suggesting the possibility of a bullish reversal.
Price may reverse its current trend following a breakout above the previous Lower High (LH). Therefore, a Buy Stop order has been placed
SUIUSDT | Long-Term Accumulation Above Rising BaseSUI is testing a broader accumulation structure with successive higher lows and an extended consolidation near long-term demand. The 0.72–0.95 area offers a potential base for a recovery, provided downside momentum fades and price begins establishing renewed higher lows. A first upward response could encounter supply near 1.20, with the next upside objective around 1.53. A confirmed monthly breakdown below 0.71 would seriously weaken the higher-timeframe recovery thesis. Any bullish continuation
SUIUSDT 3X LONG (PP: 1900%) · Full Long-term 2029-30 Bull-MarketTrading volume has been rising since mid June 2023. The highest volume ever on a single session, 3D in this case, appeared sometime around September, last month, and now SUIUSDT is trading within a higher low.
Here I am showing the full, long-term chart to support a long-term leveraged trade. One that you can buy now with 1-3X and then hold for years to come, can be life changing if approached in the right away.
Just as volume has been rising forever, so also the bottom, Sui's base.
The lowes
Sui · An opportunity in the makingSUIUSDT is about to enter the "extreme opportunity buy-zone," if only briefly.
SUI is about to make one of those moves that tend to last only a few hours or days; a flash flush or the final drop, not that deep in size, before a major advance.
If this happens, SUIUSDT would manage to re-enter the "extreme opportunity buy-zone" highlighted green on the chart. This would be the perfect entry range in anticipation of long-term growth, years of sustained action between now and 2029 or 2030.
The sa
SUI Bears Remain in Control (4H)SUI: The Bearish Move Is Not Over Yet
Previously, we analyzed SUI and shared a trading signal from the top of Wave D toward the downside in this post. Price subsequently experienced a significant drop, following the bearish scenario.
Now, the pattern has become clearer. We appear to have a Symmetrical or Diametric pattern, with price currently moving within Wave E of this larger structure.
Wave E itself appears to be developing into a Diametric pattern, with Wave G still remaining to complete