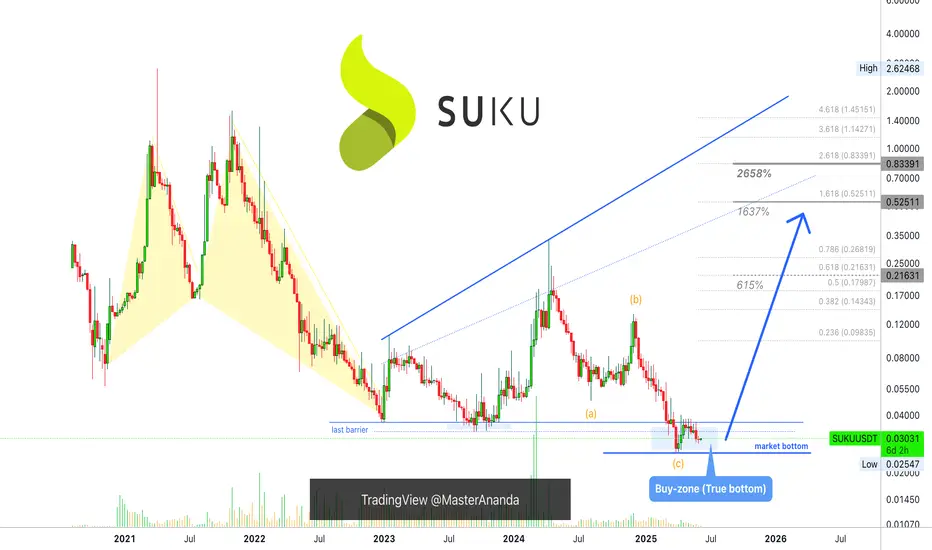
Suku, High Targets Only (615% - 2,658% Profits Potential)Between late 2023 through mid-2024, SUKUUSDT produced a 900%+ bullish wave. The action in late 2024 was a non-event.
Here we can clearly see how a pair that grew strongly in 2023 performed poorly in 2024. Those that performed poorly in 2023 did great in late 2024. But still, this isn't bull market type of action.
SUKU can grow more than 900% in a transition year, this is awesome. How much can it grow in a bull market year when everything goes wild? Great question. Growth potential is huge.
I
SUKU / Tether USD
No trades
No trades
In-depth trading ideas
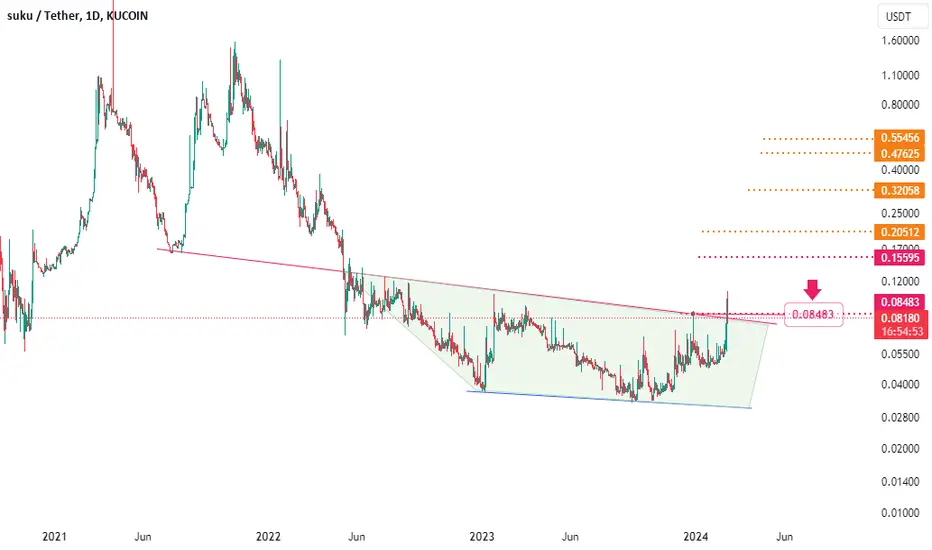
SUKU's Potential BreakoutSUKU is on the brink of breaking out from its falling wedge on the 4-hour chart, targeting the golden Fibonacci range between $0.23 and $0.26. Historically, SUKU hit the $1 mark twice during the crypto bull runs of 2021 and 2022. The recent launch of SukuPay, a decentralized digital wallet that allows users in over 150 countries to transact using just their phone numbers, fuels optimism for reaching these heights again.
Altcoin seasons often start a few months after Bitcoin halving events, sugg
✴️ Suku (Name Your Altcoin) Chart Analysis (100% Potential)Good evening my dear friend and Cryptocurrency enthusiast, join me for a few minutes while we look at this chart.
SUKUUSDT is good to me, meaning, it looks good to me based on the experience gathered after years on end looking at charts.
➖ Notice the left side.
The rounded bottom leads to a bullish wave.
➖ Notice the right side.
A double, rounded, bottom will lead to an even stronger bullish wave.
SUKUUSDT is trading above EMA200, long-term growth potential is active now.
A major corrective
SUKU - Bullish divergenceShout out to @unknownpower
On the above 1-day chart price action has corrected 90% since early November. A number of reasons now exist to be long, including:
1) The ‘incredible buy’ signal. Look left.
2) Regular Bullish divergence. Currently 8 oscillators are printing divergence. Excellent. Easier to see on 3-day chart below.
3) On the 2-day chart (below) price action is testing past support at the same time price action breaks out of resistance. Fantastic.
Is it possible price action falls
SUKU: a promising project and chart.Suku is on of the 100 blockchain start ups listed on forbes. It's currently very low in capitalization and this give us a good long opportunity!
The cap is currently 40$M, this means that at 6.30$ the cap would be around 600$M. I think this is higly achievable for a project of this kind.
Suku is a service kind of project, this means they let companies use their network to give customers a new way of approach to the world of services. This goes from supply chain, interoperability to DeFi.
It's
SUKU - Small Market Cap Gem (only 60Mil!) on Coinbase!Whales/elites will not miss any opportunities into making money. They simply buy the fear, hype up the market, take profit and crash it again after taking profit. Instead of beating then, lets ride with them! ;)
Before reading, get rid of your moonboy mentality and no emotions for dips/corrections! Cannot rule bearish scenarios! Dips are for buying!!
People are so focused on the hourly/daily timeframe that they get emotional on every dip! Take a step back to the weekly/monthly timeframe and s
SUKU/USDT { SUKU } - BULLISH SETUPANALYSIS 🔎
- SUKU/USDT is currently on an uptrend supported by the ascending trendline support.
- The market hit a swing high and retraced.
- Price is retesting the key fibonacci retracement zone (0.618 - 0.702 - 0.786) and ascending trendline support.
- There's a relatively high concentration of buyers at this zone (high buying pressure).
- The retracement was resisted by the descending trendline resistance.
- Price brokeout above the descending trendline resistance.
- This is a bullish signal.