#SUNUSDT — Major Accumulation or Bearish Continuation?#SUN
The price is moving within a descending channel on the 1-hour timeframe; it has reached the lower boundary and appears poised for a rebound, suggesting a potential upward move upon retesting this level.
The Relative Strength Index (RSI) indicates a bearish trend, but an upward breakout is likely due to oversold conditions on the 1-hour chart.
An orange trend line supports the potential upward rebound.
There is initial support at 0.01644, acting as a primary support zone.
A key support
In-depth trading ideas
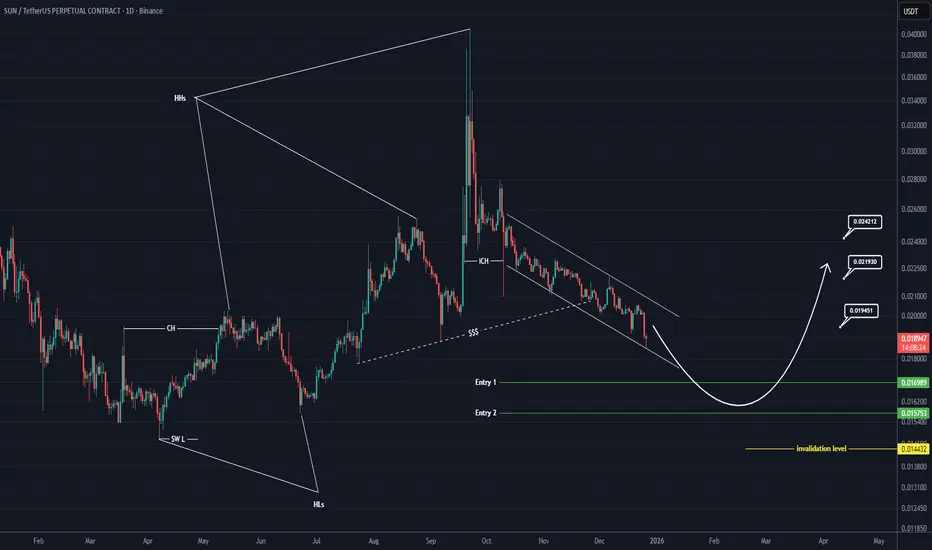
SUN Analysis (1D)The structure on higher timeframes is still bullish, but the internal structure is bearish. It is expected that the internal structure will remain bearish until the entry points we have identified.
After sweeping the liquidity pool marked on the chart and reaching our entry points, the price is expected to react and move upwards.
A long position can be taken on spot. We have identified two entry points, and the targets are also marked on the chart.
A daily candle closing below the invalidatio
#SUNUSDT — Major Accumulation or Bearish Continuation?#SUN
The price is moving within a descending channel on the 1-hour timeframe and has reached the lower boundary. It is now poised for a bounce and is expected to retest this boundary.
The Relative Strength Index (RSI) indicates a downward trend, which is likely to continue given the overbought conditions.
There is a key support zone in green at 0.01580, and the price has bounced off this zone several times, making it a strong support level.
The price is trending towards the 100-period moving
#SUNUSDT — Major Accumulation or Bearish Continuation?#SUN
The price is moving within a descending channel on the 1-hour timeframe and has reached the lower boundary. It is now poised for a bounce and is expected to retest this boundary.
The Relative Strength Index (RSI) indicates a downward trend, which is likely to continue given the overbought conditions.
A key support zone has been identified in green at 0.01615. The price has bounced off this zone several times, making it a strong support level.
The price is trending towards the 100-period
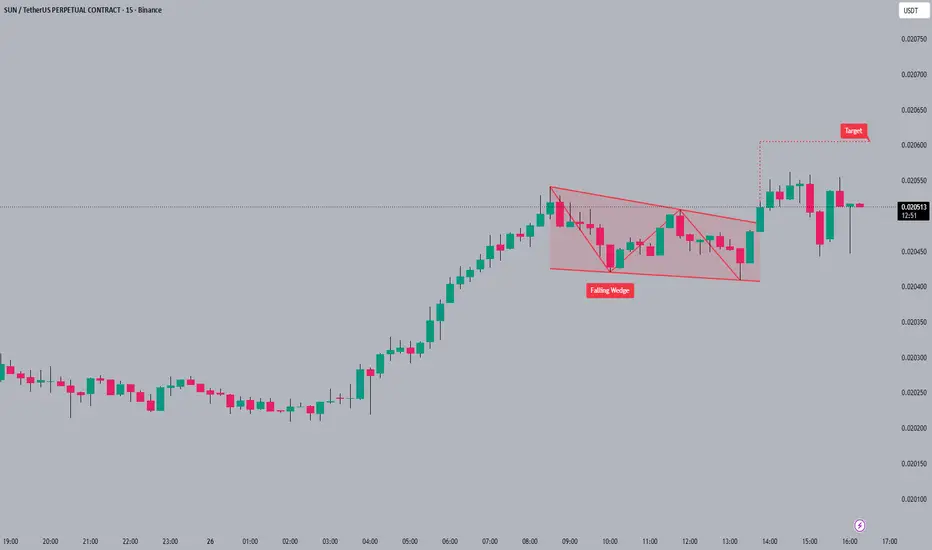
#SUN#SUN is currently trading around 0.017905 ☀️, showing indecision near the bottom of the falling wedge. The price action is forming a falling wedge 📐 which is typically a bullish reversal pattern. A breakout from this wedge could target the 0.019000 level 🚀.
It's wise to wait for confirmation and volume before assuming a breakout, as patterns can fail. #SUN #crypto #trading #altcoin
SUN: ready to ride? key levels and targets for the days aheadSUN
Catching this SUN move or still watching from the shadows? According to the market, small caps on Tron are getting fresh attention again and SUN just printed a sharp leg up on rising volume. On top of that, sentiment around DeFi yield plays has improved this week, and the chart is showing that buyers are clearly back in control for now.
On the 4H chart price broke above the previous consolidation block and is now retesting that green demand zone from the top. RSI cooled off from overbo
SUN: ready for a breakout? key levels to watch this weekSUN. Tired of watching this thing crawl sideways at the bottom of the chart? While majors steal the spotlight again and DeFi names from this ecosystem pop up in market chatter, SUN is quietly sitting right on a key 4H support where sellers keep stalling out. Feels like the spot where either smart money loads up or the floor finally gives way.
On the 4H chart price is hugging the lower red zone around 0.0166-0.0169, exactly at the value area low on the volume profile. RSI is stuck just under 40,
Scalp LONG – SUN🐂 Scalp LONG – SUN
SUN is deeply oversold on the 1h timeframe, signaling exhaustion on the sell side. Price action is compressing and approaching a classic breakout structure, suggesting momentum is building for a sharp upside expansion. A strong bullish breakout is anticipated.
🎯 TP: 0.02088
🛡️ SL: 0.01993
📊 RR: 1 : 3.75
A high-quality long setup: 1h oversold conditions + breakout structure → strong rebound potential with attractive risk-to-reward.
SUNUSDT Forming Falling WedgeSUNUSDT is forming a clear falling wedge pattern, a classic bullish reversal signal that often indicates an upcoming breakout. The price has been consolidating within a narrowing range, suggesting that selling pressure is weakening while buyers are beginning to regain control. With consistent volume confirming accumulation at lower levels, the setup hints at a potential bullish breakout soon. The projected move could lead to an impressive gain of around 50% to 60% once the price breaks above the
SUNUSDT 12H#SUN has broken above the falling wedge pattern on the 12H timeframe chart and is currently facing the Ichimoku cloud and the 12H SMA100, which may cause a pullback to retest the wedge. In case of a breakout above these levels, the potential targets are:
🎯 $0.02287
🎯 $0.02416
🎯 $0.02545
🎯 $0.02674
🎯 $0.02858
⚠️ Always remember to use a tight stop-loss and maintain proper risk management.
How Market Fluctuations Shape the Global Economy1. Understanding Fluctuations in the Global Economy
Fluctuations refer to periodic or unpredictable changes in economic indicators such as GDP growth, employment levels, inflation, or market prices. These shifts can be short-term (cyclical), medium-term (structural), or long-term (systemic).
Types of Fluctuations:
Business Cycle Fluctuations:
These are natural phases of expansion, peak, contraction, and recovery in an economy. Every country experiences these cycles, though their duration and
Quick Scalp or Just a Dump?Market’s showing some dumping pressure right now, but that also opens the door for a fast recovery. This is a pure scalp setup — could play out in just minutes.
High risk, quick trade, nothing long-term — but sometimes these fast ideas are worth a shot. Let’s see how it works out! 👀🔥
Explode Your Gains: Epic $SUN Trading Breakthrough Awaits!BINANCE:SUNUSDT
Explode Your Gains: Epic NYSE:SUN Trading Breakthrough Awaits!
Key Patterns:
The uptrend forms a clear parabolic rise with increasing volatility (longer wicks on candles).
The downtrend resembles a "dump" phase, with a near-vertical drop, possibly driven by profit-taking or market sentiment shifts.
Current price is consolidating near a potential support zone (0.0190–0.0200 USDT), with small-bodied candles indicating indecision. No clear reversal pattern (e.g., hammer or do
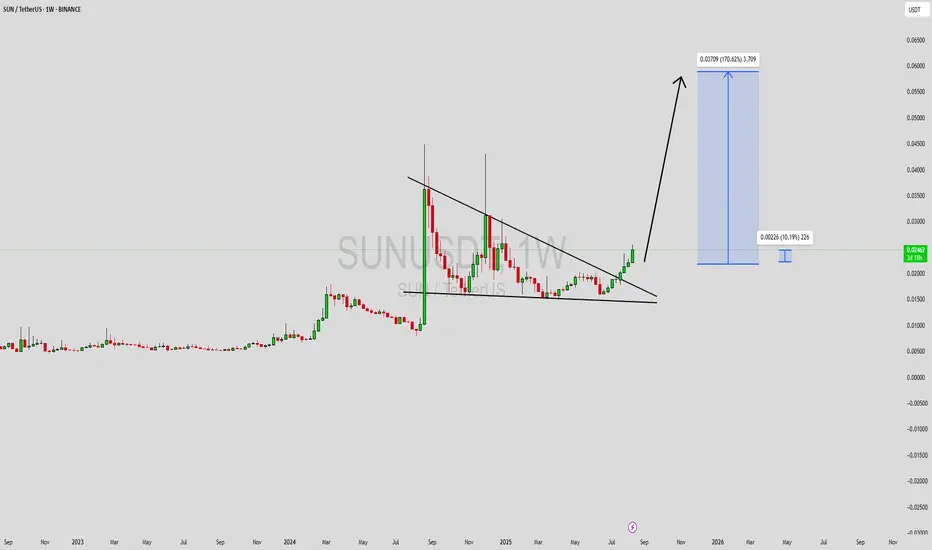
SUNUSDT Forming Descending TriangleSUNUSDT is showing a strong bullish breakout from a long-term descending triangle, a formation that often precedes explosive price action. The weekly chart reveals a sustained breakout above the multi-month trendline resistance, indicating a shift in market structure and signaling that bulls are gaining control. With volume gradually building up and a clear structure confirming accumulation, SUNUSDT appears ready for a significant move. Based on the current chart setup, there’s potential for an
Sun Token Prepares Major Rise · No ResistanceSun Token (SUN) has been rising. It has been rising short-term, long-term and at all times. It has been green now seven weeks and I am publishing because I see a major advance starting. Something like August 2024 or February-March 2024. Something like this.
SUNUSDT hit bottom November 2022 and it has been growing since. The main low happened November 2022, then August 2024 and finally April 2025. All higher lows of course and a very strong chart.
SUNUSDT is a strong buy and already moving up,
SUNUSDT Forming Potential BreakoutSUNUSDT is currently forming a promising potential breakout pattern that traders and investors should closely watch. The price action has shown a period of consolidation near key support zones, building a strong base for a potential explosive move. With volume gradually increasing and bulls taking control, the pair appears primed to break past resistance levels, signaling the beginning of a new uptrend phase.
The technical structure supports a bullish bias, with the potential to achieve a gain
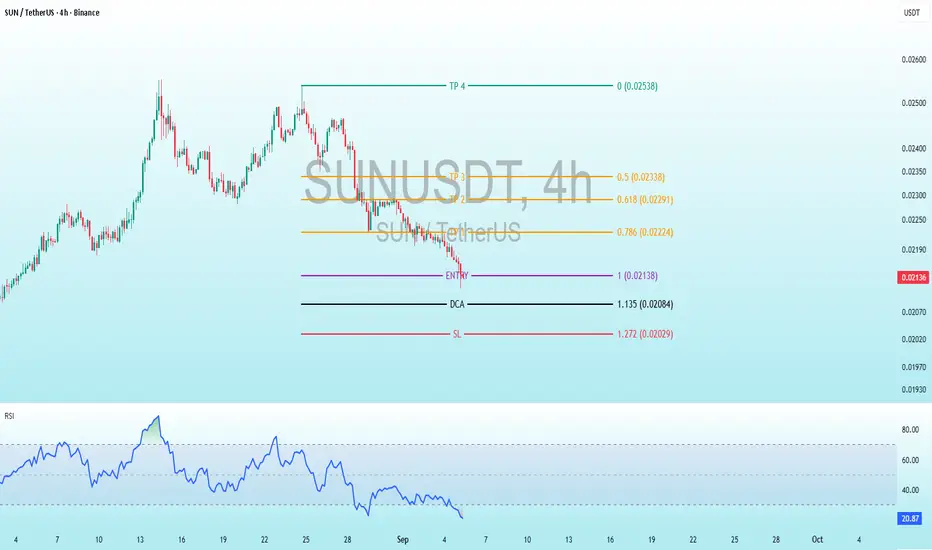
SUN Bearish DivergenceBINANCE:SUNUSDT
Trade Setup:
Target 1: 0.01978 (0.50 Fibonnaci Golden Zone).
Target 2: 0.01883 (0.618 Fibonnaci Golden Zone).
Target 3: 0.01747 (0.786 Fibonnaci Golden Zone).
Target 4: 0.01574 (1 Fibonnaci).
Stop Loss: 0.02382 (above recent high, ~25% above current price).
RSI Analysis: The RSI shows a bullish divergence (price making lower lows while RSI makes higher lows), suggesting potential upward momentum. Current RSI is around 82.23, nearing overbought territory (>70), so caution is
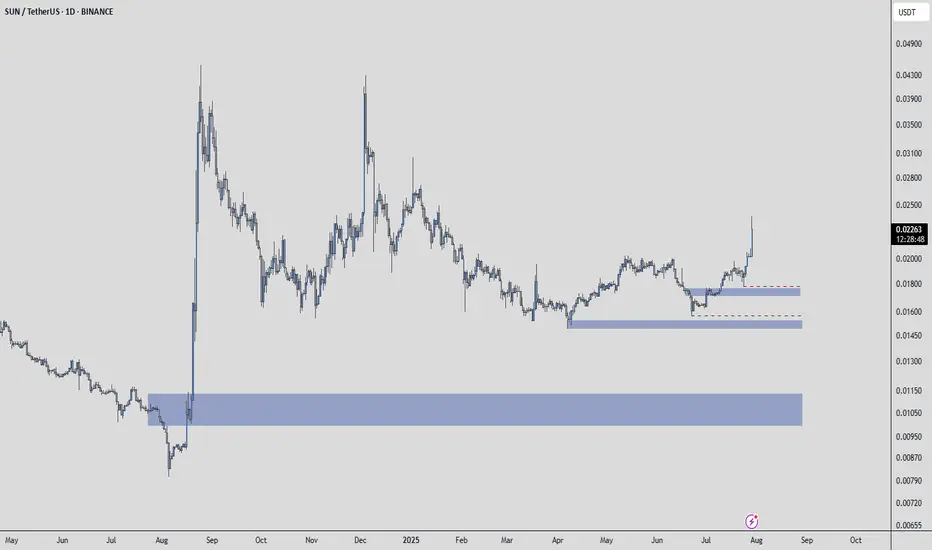
SUNUSDT – One Chart, Three Opportunities☀️ In SUN/USDT, three distinct blue box zones stand out. Each offers its own kind of opportunity — but only if you approach them with structure and discipline.
🎯 Here's How to Use Them
📍 Zone 1 → potential for short-term gains
📍 Zone 2 → better suited for medium-term positioning
📍 Zone 3 → promising long-term risk:reward
But don’t place blind orders — instead:
✅ Set alerts for each zone
✅ When price reaches one, switch to 1H chart
✅ Look for an upward breakout
✅ Confirm with positive & rising
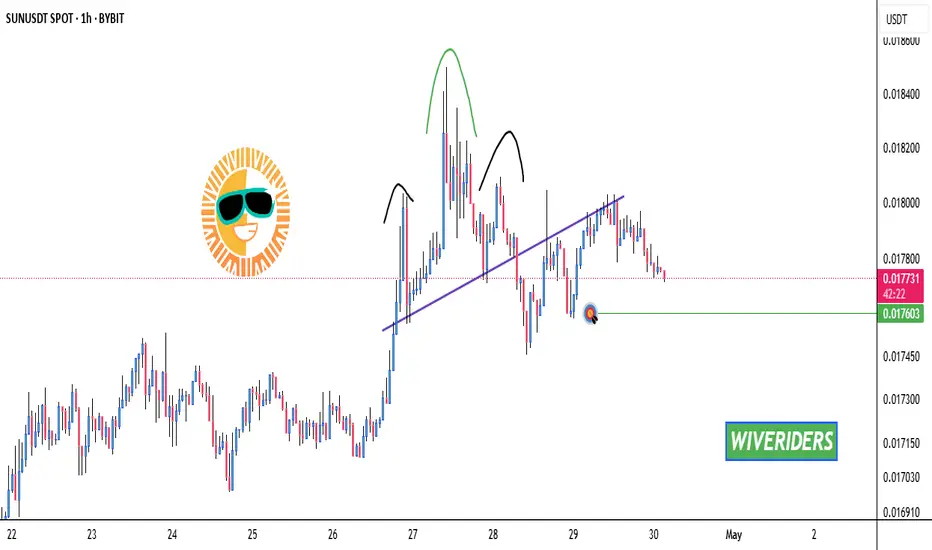
Bearish Head and Shoulders Pattern Confirmed 🚨 NYSE:SUN
Bearish Head and Shoulders Pattern Confirmed 🚨
NYSE:SUN
has formed a bearish head and shoulders pattern and has been rejected from the neckline. The target for this bearish move is the green line level.
📈 Technical Overview:
Pattern: Bearish Head and Shoulders
Neckline: Rejection confirmation
🎯 Target: Green line level.