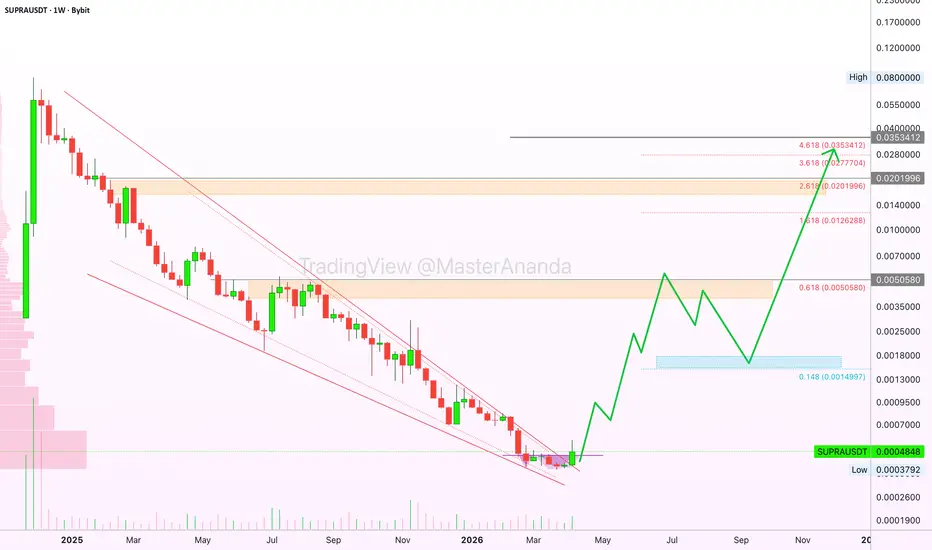
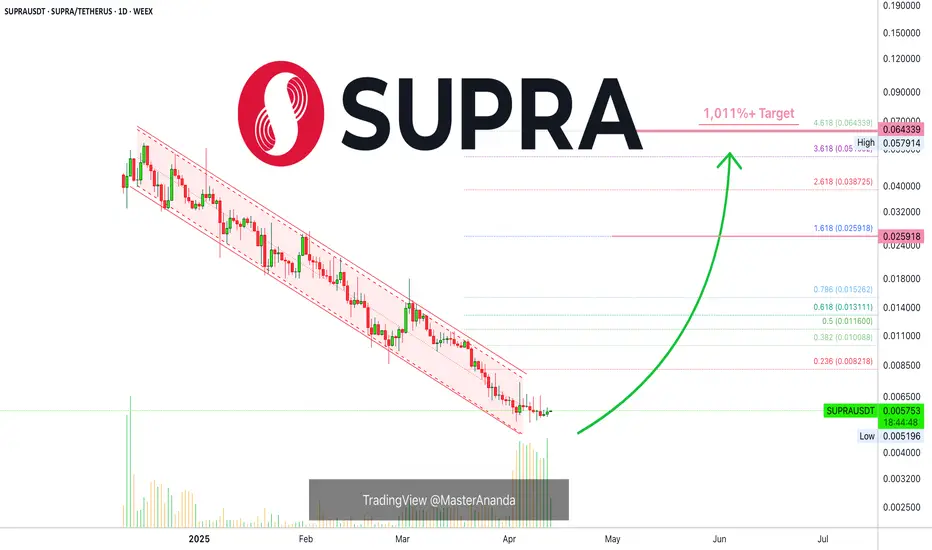
Supra Network prepares long-term bullish cycleThe good thing about this type of chart setup is that a prolonged crash always leaves open a path for an incredible recovery; think of Solana after late 2022, the crash preceding this date and the strong recovery that followed.
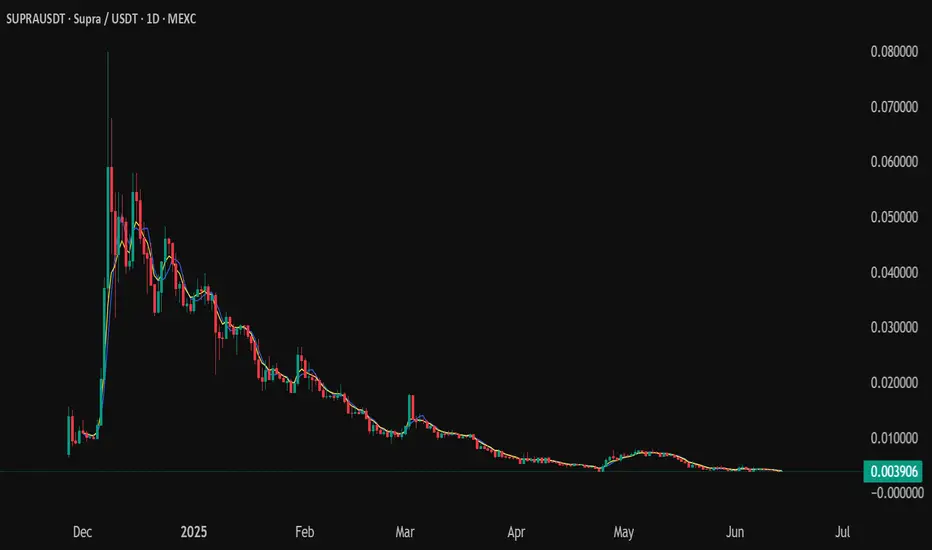
I have to once more direct you to the linear chart on SUPRAUSDT. There you will be able to see the downtrend ending around April 2025. Any project needs a period of rest after a strong crash, consolidation before a new market phase, this consolidation can take 5-8 months. SUPRAUSDT has seen an entire year of bearish action after the initial bearish impulse.
Looking at the logarithmic chart, a different perspective, good is also present. A massive falling wedge pattern is being broken this week as well as the end of the downtrend. This is a bottom catch, potentially.
The arrows are for illustration purposes only. Meant to predict the direction but not the specific time or shape of the bullish market phase.
I am predicting a strong rise on this and other projects.
Namaste.
In-depth trading ideas
SUPRA is GOING to $1!---5 Reasons to Buy Supra/USDT---
Decentralized Innovation
Supra (SUPRA) is a cryptocurrency designed to deliver decentralized solutions across industries, with enhanced scalability and security features.
Automatic DeFi (AutoFi) Technology
Supra is the first blockchain built for Automatic DeFi, enabling self-operating financial systems with high-speed smart contracts, native price oracles, and cross-chain messaging.
Revenue Without Inflation
Its ecosystem generates recurring protocol revenue and redistributes it fairly, reducing reliance on inflationary block rewards over time.
AI Integration in DeFi
Supra’s framework supports specialized crypto AI agents, opening new opportunities in automated trading, risk management, and decentralized finance applications.
Potential Market Reversal
After a long downtrend, Supra recently broke above a critical descending trendline, signaling a possible structural shift in market momentum.
SUPRA/USDT — Trendline Breakout at Critical: Is Major Reversal?SUPRA has spent nearly a full year trapped under a relentless descending trendline—each rally attempt crushed, each bounce rejected. But for the first time since early 2025, the 2-day candle has broken above the dominant descending trendline, signaling a potential structural shift in market momentum.
This breakout occurred precisely after SUPRA revisited the major demand block at 0.00215–0.00180, a region that has repeatedly acted as the survival zone for this asset. The reaction from this area suggests renewed accumulation and a clear transfer of strength from sellers back to buyers.
SUPRA is now entering the most critical stage of its 2025 chart structure:
Is this a genuine trend reversal—or just another liquidity trap disguised as a breakout?
---
PATTERN STRUCTURE: “Descending Trendline Break + Demand Zone Rejection”
This combination is historically one of the strongest reversal structures, especially after prolonged downtrends.
1. Descending Trendline Breakout
The yellow trendline has suppressed price since early 2025.
The 2D breakout is a strong early reversal signal.
However, the wick on the breakout candle shows that sellers aren’t fully gone—momentum still needs confirmation.
2. Strong Demand Block (0.00215–0.00180)
This yellow box represents
high-volume reaccumulation,
liquidity sweeps,
structural support
that has repeatedly reset the market’s short-term direction.
3. Mid-Term Market Structure Shift (MSS)
A breakout + higher low formation near demand suggests the foundation of a larger bullish transition.
---
Bullish Scenario: “The Ingredients of a Full Trend Reversal”
SUPRA may be forming the early stages of a multi-week bullish reversal if the following conditions are respected:
1. Holding Above 0.00215
This is the line between “breakout confirmed” and “breakout failed.”
2. Successful Retest of Trendline or Demand Zone
A clean rejection wick from this zone would signal buyers stepping in aggressively.
3. Bullish Targets Based on Chart Structure
If the breakout is real, SUPRA has a clear ladder of upside targets:
Target Description
0.00320 First resistance / short-term reaction zone
0.00450 Major historical supply area
0.00750 Mid-range structural resistance
0.01330 Full trend reversal target
Bullish Narrative
A stable 2D close above 0.00230–0.00250 would mark the beginning of a mid-term trend reversal, opening the path toward multi-target rallies.
---
Bearish Scenario: “False Breakout Liquidity Trap”
Despite the breakout, danger remains:
1. Closing Below 0.00215
This would signal weakness and invalidate early bullish momentum.
2. Closing Below 0.00180 (Major Breakdown)
If the candle closes below the lower demand boundary, SUPRA risks sliding toward:
0.00123 (the next major low on the chart)
or even forming new lower lows
Bearish Narrative
If sellers reclaim the demand zone, the reversal collapses and the long-term downtrend resumes.
---
Summary
SUPRA is at one of its most defining technical moments of 2025.
The trendline breakout is only the first chapter of this story—the real decision will be made at the 0.00215–0.00200 retest.
If the zone holds, SUPRA isn’t just escaping a downtrend—it may be entering a full multi-week reversal phase aimed at 0.00320 → 0.00450 → 0.00750 and beyond.
But if it closes below 0.00180, the entire bullish structure erases and the downtrend resumes.
---
#SUPRA #SUPRAUSDT #CryptoAnalysis #Breakout #TrendlineBreak #Altcoin #MarketStructure #DemandZone #ReversalSetup
SUPRAUSDT UPDATE#SUPRA
UPDATE
SUPRA Technical Setup
Pattern: Falling Wedge Pattern
Current Price: $0.00293
Target Price: $0.00615
Target % Gain: 144.78%
Technical Analysis: SUPRA has broken out of a falling wedge pattern on the 1D chart, showing strong bullish momentum as price moves above the upper trendline. The breakout is supported by increasing volume and a clear shift in market structure, suggesting buyers are taking control. If momentum continues, price may push toward the projected target near $0.00615.
Time Frame: 1D
Risk Management Tip: Always use proper risk management.
SUPRAUSDT 1DKeep an eye on the #SUPRA daily chart. It is on the verge of breaking out above the descending resistance. RSI and MACD are showing bullish momentum. If the price can hold above the descending resistance, the potential targets are:
🎯 $0.002153
🎯 $0.002645
🎯 $0.003043
🎯 $0.003440
🎯 $0.004006
🎯 $0.004727
⚠️ Always use a tight stop-loss and maintain proper risk management.
SUPRA-Can we reverse form here?After an awful 9 months downtrend
We started to print somewhat bullish reversal structure
With the recent dip holding the fib 0.7 retracement area, with Money Flow index forming bullish divergent on the daily timeframe.
Been in this token for longgg time, pray we goes up eventually.
Supra - from downtrend to sideways - to uptrend?supra had a massive downtrend on its chart. Since the last impulsive wave, the market went into a sideways correction, now lasting 71 days. Also since then, no new all time low was formed. Price ranging on the bottom of the sideways correction between 50% and 61.8% retracement of the last impulse. lets see if this will lead to a reversal?
SUPRA Alert!!🔥SUPRA🔥Technicals – Price has broken out from its bear trend and is showing strong reversal signs with a clear Cup & Handle formation.
📍 Key level: $0.004879 – needs to be broken to confirm the CnH neckline.
🚀 If confirmed, upside potential is huge — targeting $0.01 (+122%++).
⚠️ Pattern invalid if price drops below $0.00282.
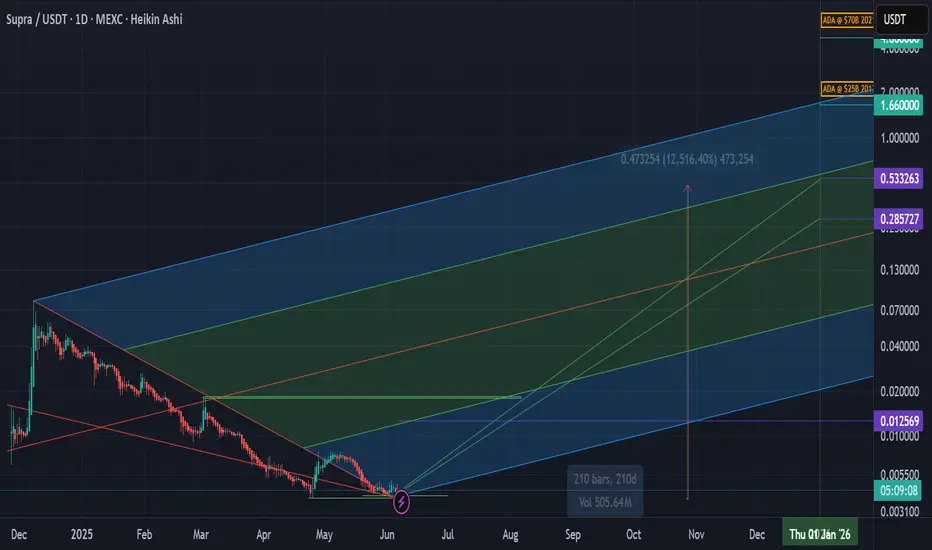
Supra 2025 price predictions for end of yearI have a $0.28 target and a $0.53 target for end of 2025 bull cycle. I am using an extended pitch fork fib extension to help see potential targets. A very promising layer 1 with unique backing plus oracle integration into node network. These price points are extremely conservative in my opinion.
$SUPRA Breakout Confirmed — Trend Reversal in Play!$SUPRA just flipped the script!
After months of bleeding under a brutal downtrend, it finally broke out clean and confident.
That long-term resistance? Crushed.
Now it's retesting the breakout zone, a classic reclaim move.
EMAs are curving up, momentum's clearly shifting.
In my opinion, this breakout confirms a trend reversal.
Buyers are stepping up.
$0.0096+ Looks like the next magnet.
like if you are bullish!
SUPRA is forming an ascending triangle patternSUPRA is forming an ascending triangle pattern and is approaching a key red resistance zone. A breakout above this level could confirm the bullish pattern and signal a strong upward move.
📈 Technical Overview:
Pattern: Ascending Triangle
Resistance Zone: Red area currently being tested.
🎯 Breakout Target: To be determined upon confirmation of the breakout.
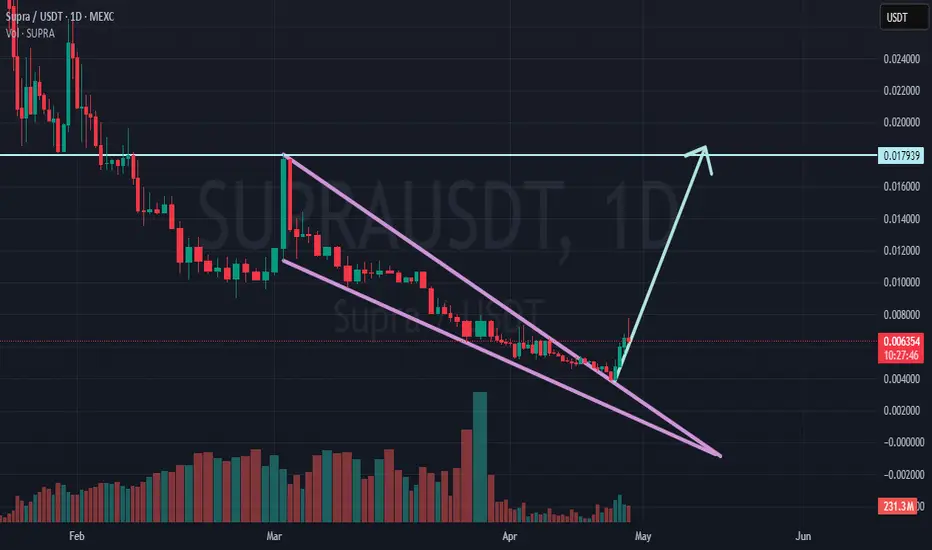
SUPRA: Classic Falling Wedge Breakout/Start of Bullish Uptrend The SUPRA/USDT daily chart highlights a textbook bullish reversal setup, marked by a well-defined falling wedge. Importantly, the extended downtrend within the wedge should not be seen as weakness — rather, it reflects a phase of strength through consolidation, as evidenced by the steady decline in volume during the pattern. This contracting volume is a classic sign of market stabilization, setting the foundation for a reversal, and positioning $SUPRA for an eventual shift in momentum.
That shift has now materialized. SUPRA has broken out decisively to the upside, accompanied by a strong resurgence in volume, signaling renewed buyer engagement and unlocking significant upward potential. The re-acceleration in volume confirms the breakout's validity and suggests that the market has transitioned from consolidation to the early stages of a bullish uptrend. It’s important to recognize that pullbacks are natural even during strong trends, often offering healthy resets along the way up.
The immediate upside target is set around $0.0179, corresponding to the highest point of the wedge formation. Successfully reclaiming this level would further reinforce the strength of the breakout, but it is also common in such technical setups for gains to extend significantly beyond the initial target, driven by momentum and broader market interest. Monitoring volume and overall market sentiment will be critical to tracking the sustainability and potential extension of this emerging uptrend.
Supra: Your Altcoin ChoiceThis Supra chart is barely four months old, so it doesn't meet our criteria of at least 6 months for a technical analysis, but the project looks good and the chart is easy to read. I had a good feeling as soon as I opened the chart so let's look into it anyway. It is my pleasure to do these analysis for you.
There is a perfect downtrend on this SUPRAUSDT chart and this is always quite revealing. Knowing that a downtrend is present we know that at some point the market must change course. This point in time is now.
The All-Time Low came on 3-April. Notice how as soon as April starts volume starts to rise. This is the signal. Low prices, a new ATL and then suddenly, action. Whales are buying.
This increase in trading volume reveals that a support level has been found and is being established. Looking at the rest of the market, we know that this support will hold and a reversal comes next. Also, trading volume continues to rise and the candles are now turning green. This is positive, this is bullish. There is good potential for growth.
That's it. It is a young chart so there isn't much more.
The downtrend will lead to sideways. Sideways lead to bullish growth.
Many targets can be seen mapped on the chart based on Fibonacci proportions. Growth potential goes beyond 3,000% or more for the 2025 ATH. Truly, impossible to tell. This pair/project might grow 5,000%, 10,000% or who knows. When new projects are launch preceding a bull market, anything goes.
Here I am mapping some short-term targets. You take care of the rest.
This project is likely to grow really strong in the coming months.
Thank you for reading.
Your support is appreciated.
All Altcoins Choice requests have been fulfilled.
Namaste.
SUPRA chart updated analysisThis is a follow on from previous SUPRA analysis here:
Left chart:
Price holding the possible reversal bullish divergence forming along pink trendlines.
EMA8 blue line is still holding price down and the Stoch RSI is back to bearish zone.
Right chart:
I drew in a different trendline(green) on this chart to show either left or right chart green trendline are valid.
The RSI and LMACD still have no bullish signs as mentioned in previous analysis as to what we want to see here.
Overall, SUPRA is still in a downtrend and if the bullish divergence fails, then the green fib pocket on right chart could be hit at 0.01
If the bullish divergence plays out price must breakout through resistances shown, then get past 0.022 and then above 0.0265
Any big bullish move will get stopped at 0.03252
Where do you think price will go from here, down or up?
Don't forget to hit that like rocket button!
SUPRA chart analysisSo far I have called every move on SUPRA since joining the SUPRA tribe.
What we see on this chart is SUPRA is in a downtrend still rejecting off fib pocket each time. I have not shown the fib indicators here to show this as the chart would be too messy.
On the Stoch RSI we can see each time it crosses up as shown by the orange vertical lines, the price on the chart goes from the yellow arrow to the % as shown by the green price ranges.
The Stoch RSI needs to get above 40 as it has not done so yet and this will break SUPRA out of the downtrend. Also the normal RSI is in a downtrend also as you can see.
On the chart the 0.03252 yellow line is major resistance as well as the current green trendline keeping SUPRA in a downtrend.
The current cross of the Stoch rsi shows an upward move already on the price chart and the estimated target which is exactly where the fib pocket is. If reject there price goes lower to 0.016
Do not forget to smash that rocket like button!