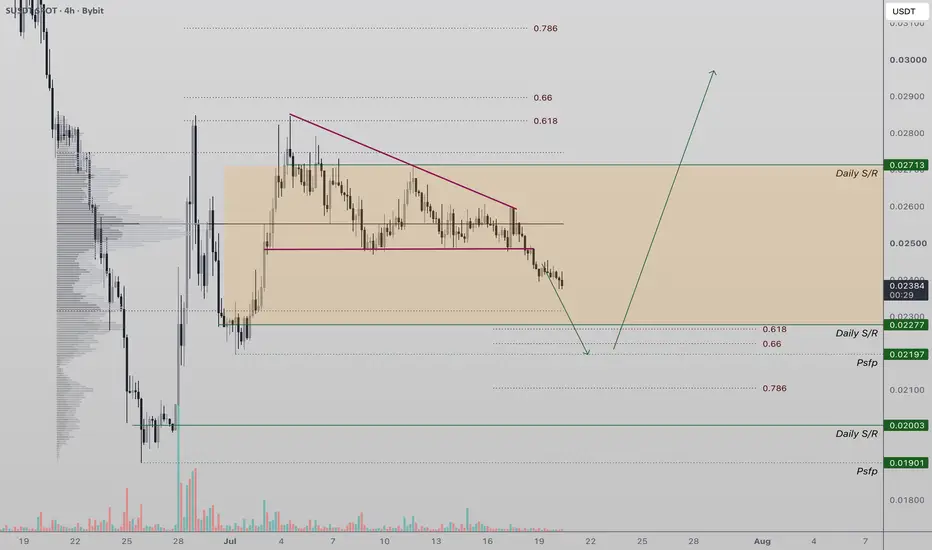
Sonic Key Support Appraching Sonic (S) has confirmed a breakdown from its local descending triangle, completing the bearish pattern and sending price toward its projected downside target.
This move aligns with the measured objective of the formation, suggesting sellers have largely achieved the initial target of the breakdown
Compare with S / TetherUS
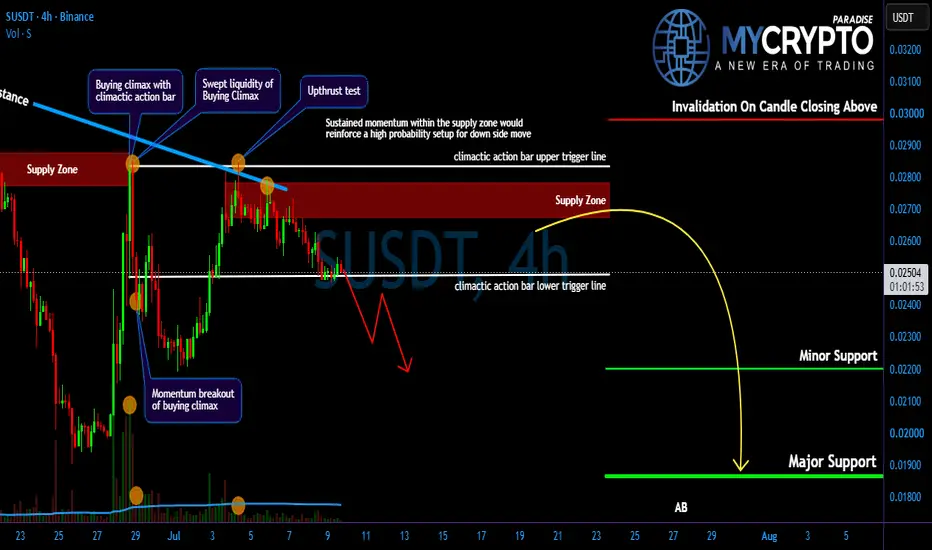
S Downside Risk Remains Active…!Yello Paradisers! Are you prepared for a potential sharp downside move on #S, or are you still calling this “just a healthy pullback” while smart money quietly distributes above you? At first glance, the structure may look harmless. But when we remove emotions and read the chart objectively, the sto
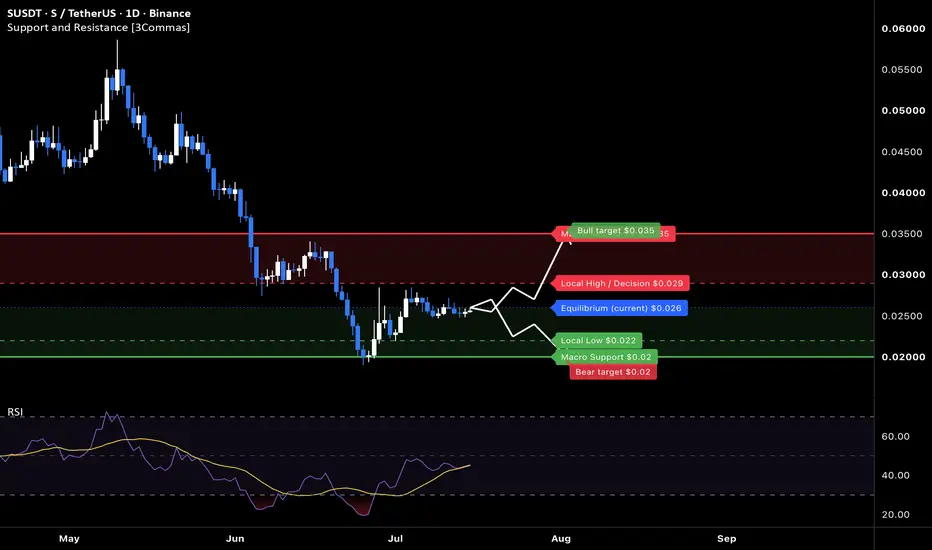
S at macro floor: base recovery toward $0.035The Macro Picture 🗺️
Sonic unwound its May $0.058 highs through a steep descent that bottomed at $0.020 in early July — a structural reset deep enough to exhaust the sellers and push RSI into oversold. Since that flush, the tape has changed character: price carved a higher low, reclaimed the equili
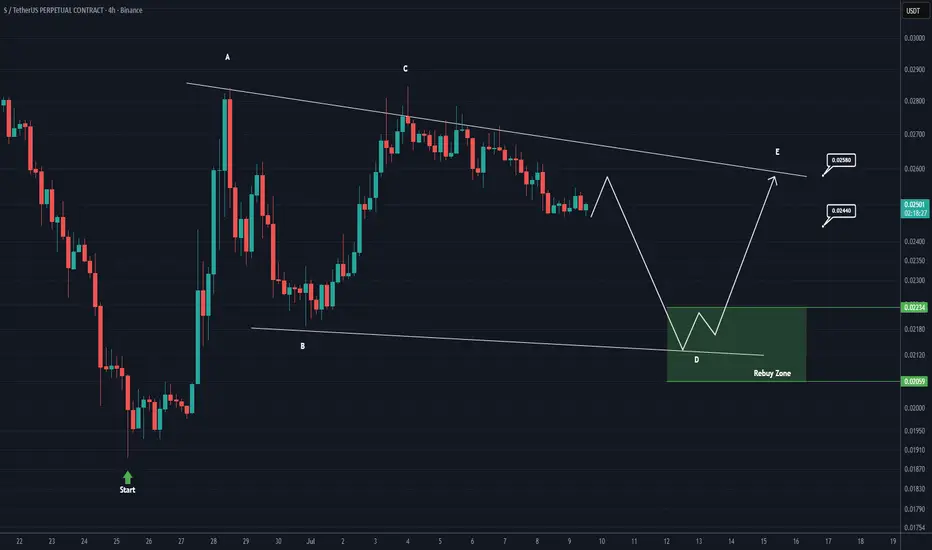
Sonic is currently consolidating within a triangle pattern (4H)Before anything else, it's important to note that this is not a sell/short setup—it's a buy/long setup.
From the point where we placed the green arrow on the chart, Sonic appears to have started forming a Triangle pattern.
Waves A, B, and C of the Triangle appear to be complete, and the price is n
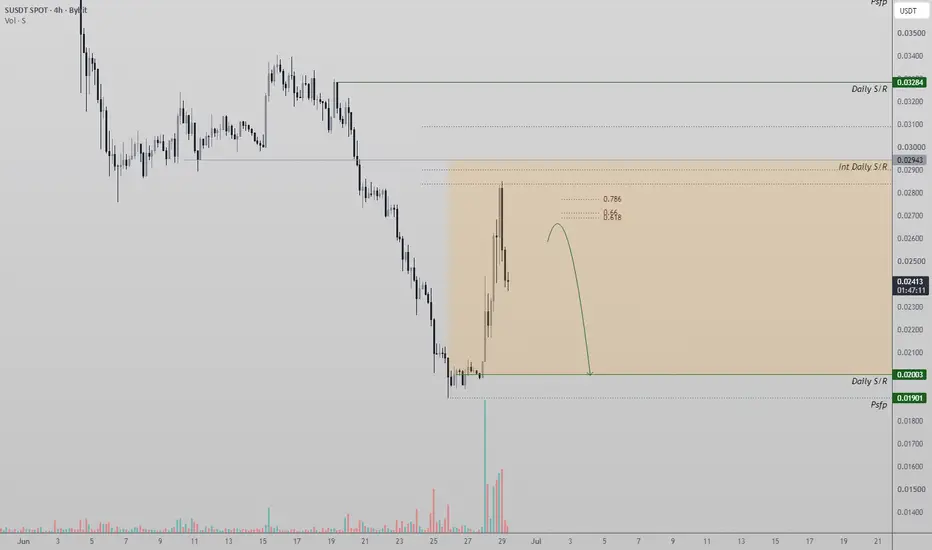
Sonic Faces Short-Term CorrectionSonic (S) is showing signs of short-term weakness after rejecting from the 0.618 Fibonacci retracement, a key technical resistance that has successfully capped the recent recovery. The rejection has also formed the early stages of a Swing Failure Pattern (SFP), suggesting that buying momentum may be
Sonic Eyes Consolidation After Rally Sonic (S) has staged a strong recovery after experiencing aggressive selling pressure, producing what appears to be a classic oversold bounce. The relief rally has been impressive, but price has now reached an important technical barrier at the 0.618 Fibonacci retracement, where sellers have begun s
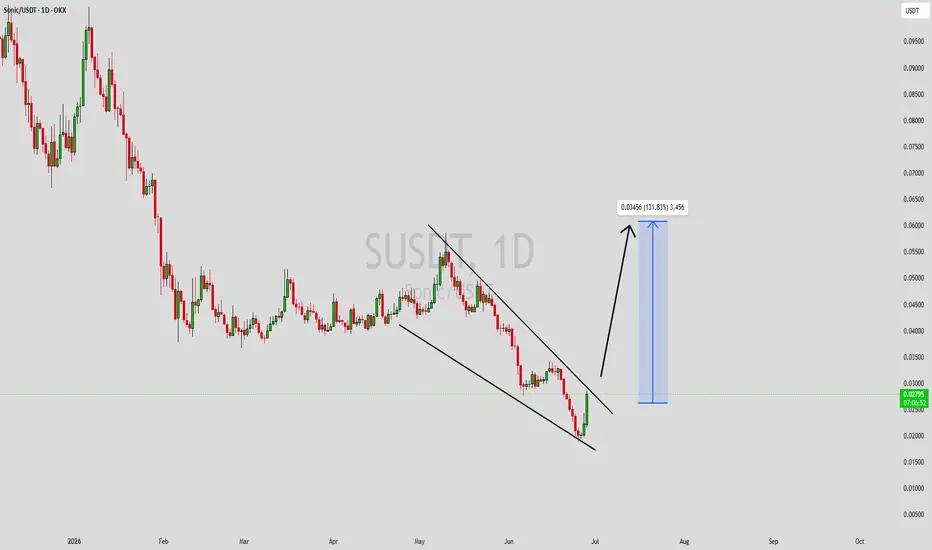
SUSDT Forming Falling WedgeSUSDT is forming a clear falling wedge pattern, a classic bullish wave signal that often indicates an upcoming breakout. The price has been consolidating within a narrowing range, suggesting that selling pressure is weakening while buyers are beginning to regain control. With consistent volume confi
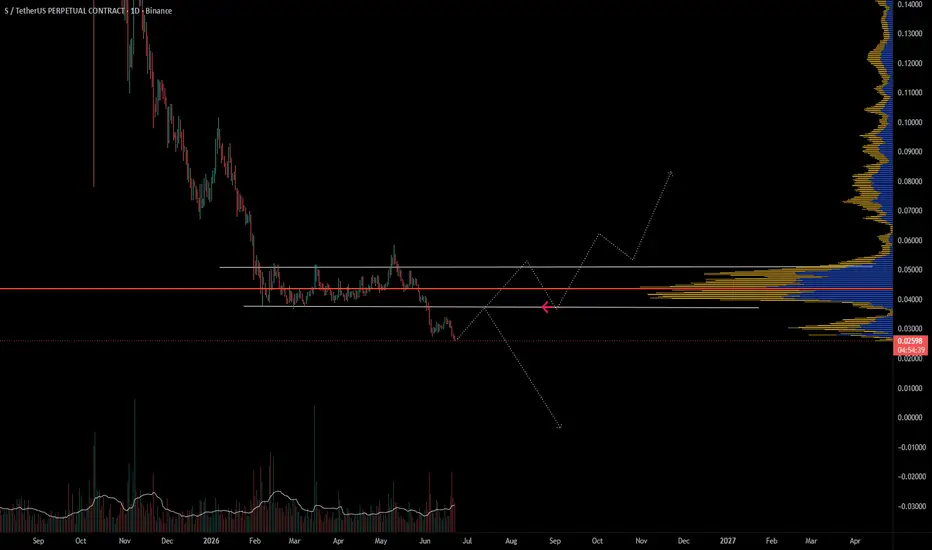
Sonic TA: $S is at a key decision pointSonic remains in a broader corrective trend after a sharp drop from prior highs. Price has broken below its previous consolidation range, so bulls need to reclaim that area to shift momentum.
The main level to watch is the former support zone overhead, which is now acting as resistance. If $S can m
SUSDT 1D#S is currently trading within a falling wedge pattern on the daily chart and has bounced from the wedge support.
In case of a breakout above both the wedge resistance and the daily EMA50, the following upside targets could come into play:
🎯 $0.04368
🎯 $0.05248
🎯 $0.05959
🎯 $0.06669
🎯 $0.07681
⚠️
Sonic (S) Price Bearish Structure Continues Sonic (S) price action continues to display a strongly bearish market structure, with sellers maintaining firm control across both the higher and lower timeframes. Recent price action has established a new yearly low, breaking beneath the previous swing low and confirming the continuation of the pre
See all ideas
Summarizing what the indicators are suggesting.
Oscillators
Neutral
SellBuy
Strong sellStrong buy
Strong sellSellNeutralBuyStrong buy
Oscillators
Neutral
SellBuy
Strong sellStrong buy
Strong sellSellNeutralBuyStrong buy
Summary
Neutral
SellBuy
Strong sellStrong buy
Strong sellSellNeutralBuyStrong buy
Summary
Neutral
SellBuy
Strong sellStrong buy
Strong sellSellNeutralBuyStrong buy
Summary
Neutral
SellBuy
Strong sellStrong buy
Strong sellSellNeutralBuyStrong buy
Moving Averages
Neutral
SellBuy
Strong sellStrong buy
Strong sellSellNeutralBuyStrong buy
Moving Averages
Neutral
SellBuy
Strong sellStrong buy
Strong sellSellNeutralBuyStrong buy
Displays a symbol's price movements over previous years to identify recurring trends.
Frequently asked questions
The current price of S / TetherUS (S) is 0.02482 USDT — it has fallen −0.04% in the past 24 hours. Try placing this info into the context by checking out what coins are also gaining and losing at the moment and seeing S price chart.
S / TetherUS price has fallen by −5.37% over the last week, its month performance shows a −22.07% decrease, and as for the last year, S / TetherUS has decreased by −93.68%. See more dynamics on S price chart.
Keep track of coins' changes with our Crypto Coins Heatmap.
S / TetherUS (S) reached its highest price on Feb 21, 2025 — it amounted to 0.99000 USDT. Find more insights on the S price chart.
See the list of crypto gainers and choose what best fits your strategy.
S / TetherUS (S) reached the lowest price of 0.01901 USDT on Jun 25, 2026. View more S / TetherUS dynamics on the price chart.
See the list of crypto losers to find unexpected opportunities.
The safest choice when buying S is to go to a well-known crypto exchange. Some of the popular names are Binance, Coinbase, Kraken. But you'll have to find a reliable broker and create an account first. You can trade S right from TradingView charts — just choose a broker and connect to your account.
Crypto markets are famous for their volatility, so one should study all the available stats before adding crypto assets to their portfolio. Very often it's technical analysis that comes in handy. We prepared technical ratings for S / TetherUS (S): today its technical analysis shows the sell signal, and according to the 1 week rating S shows the sell signal. And you'd better dig deeper and study 1 month rating too — it's buy. Find inspiration in S / TetherUS trading ideas and keep track of what's moving crypto markets with our crypto news feed.
S / TetherUS (S) is just as reliable as any other crypto asset — this corner of the world market is highly volatile. Today, for instance, S / TetherUS is estimated as 3.73% volatile. The only thing it means is that you must prepare and examine all available information before making a decision. And if you're not sure about S / TetherUS, you can find more inspiration in our curated watchlists.
You can discuss S / TetherUS (S) with other users in our public chats, Minds or in the comments to Ideas.