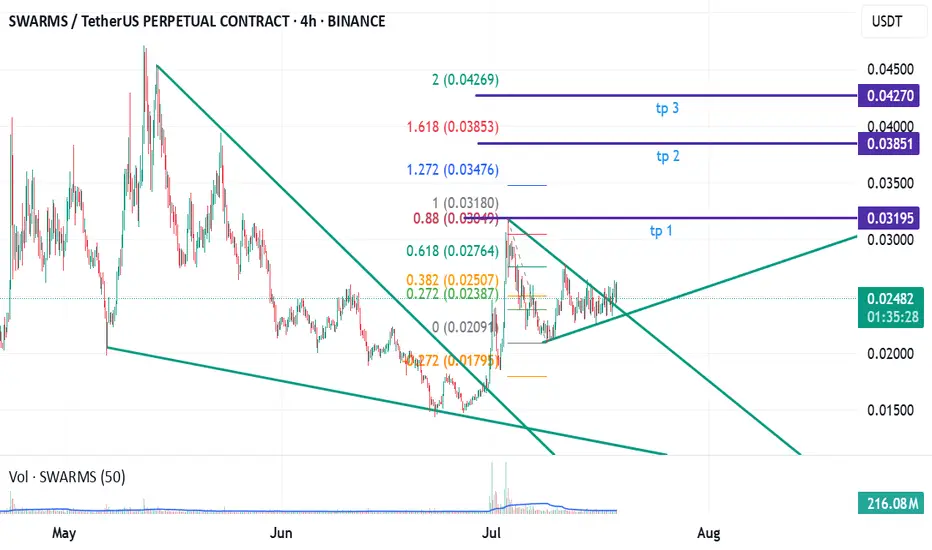
SWARMS BREAKING OUTSWARMS smashing out of its long-term downtrend on the higher timeframes, technicals firing on all cylinders with pure bullish conviction. This isn't some weak fakeout, price action is screaming reversal potential, but only if technicals backs it and no higher resistance caps the move. Eyes locked, s
SWARMUSDTP Daily Reversal & Compression at HighsSWARM has already put in a strong expansion off the lows, and now price is spending time near the highs instead of fully giving it back. That usually matters because acceptance after expansion is what keeps continuation in play.
HTF Context:
On the daily, this looks like a reversal extension that h
swarms · High volume bullish continuationThe October 2025 crash has been fully recovered on SWARMSUSDT. After this recovery, now we are seeing an increase in bullish momentum.
First, all gains were being maintained. Next, a bullish continuation supported by high volume and increasing momentum.
The low? 6-February 2026.
The rounded bott
SWARMS/USDT - Continuation The first buy setup delivered an impressive +92% profit, and now the chart is setting up for round two. Price structure is showing renewed bullish momentum, preparing for another leg toward higher levels. With buyers stepping back in and key supports holding firm, the stage is set for continuation t
SWARMS Breaks Out of Descending ChannelSWARMSUSDT has been trading within a descending channel since February, with price consistently respecting both the upper resistance and lower support trendlines. Recently, the market broke above the channel’s resistance with a strong bullish candle, backed by a noticeable increase in buying volume.
swarms · Opportunity Buy Zone · 1,100% - 4,700% Growth PotentialI like it. It might not look like it but this is a great chart. SWARMSUSDT is trading at bottom prices within the accumulation zone but with the possibility that the bottom is already gone. That is, no new shakeouts or lows. From here on, growth.
There was a low in April followed by a lower low in
swarms is COMING! continuation triangle breakoutafter breakout from falling wedge, the continuation pattern is forming symmetrical triangle in the past 1 month.
today is the day, he is just breakout from symmetrical triangle.
watch out for the pump.
may do a retest on saturday.
try to seek for entry when market is low volume if have minor pullb
See all ideas
Summarizing what the indicators are suggesting.
Oscillators
Neutral
SellBuy
Strong sellStrong buy
Strong sellSellNeutralBuyStrong buy
Oscillators
Neutral
SellBuy
Strong sellStrong buy
Strong sellSellNeutralBuyStrong buy
Summary
Neutral
SellBuy
Strong sellStrong buy
Strong sellSellNeutralBuyStrong buy
Summary
Neutral
SellBuy
Strong sellStrong buy
Strong sellSellNeutralBuyStrong buy
Summary
Neutral
SellBuy
Strong sellStrong buy
Strong sellSellNeutralBuyStrong buy
Moving Averages
Neutral
SellBuy
Strong sellStrong buy
Strong sellSellNeutralBuyStrong buy
Moving Averages
Neutral
SellBuy
Strong sellStrong buy
Strong sellSellNeutralBuyStrong buy
Displays a symbol's price movements over previous years to identify recurring trends.