Novo Nordisk - This could be the bullish bottom!💉Novo Nordisk ( NYSE:NVO ) is retesting clear support right now:
🔎Analysis summary:
For the past fourty years, Novo Nordisk has been trading in a clear bullish uptrend. And this uptrend was also not broken with the recent -80% correction. In fact, Novo Nordisk is now finally retesting major support and could soon end this correction with a bullish reversal.
📝Levels to watch:
$35
Keep your #LONGTERMVISION🙏
— Phil (@TheTraderPhil)
Novo Nordisk A/S Class B
No trades
No trades
In-depth trading ideas
NVO First Time testing 200 monthly SMA NVO is doing something unusual on the long-term chart.
Price is testing the 200-month simple moving average, a level it has barely visited during the multi-decade uptrend.
On the chart you’re looking at, this also looks like a second touch of a rising trend line, which would set up a possible double bottom if that support holds.
The business is still fundamentally solid: strong margins, a real franchise, and a dividend.
If this area holds, a meaningful bounce is possible.
It is not a co
NVO reversal in sight?Looking for a potential reversal in NVO stock. The price needs to reclaim the 8-12H imbalance for the bias to shift bullish. I've identified a possible setup with two potential targets. This strategy requires a breakout and close above $38.25. Momentum indicators are starting to show signs of strength.
Not financial advice.
NVO: M&A Could Become the Next CatalystNovo Nordisk is entering an important transition.
The company is still benefiting from strong obesity-drug demand, but the economics of the market are changing. Competition with Eli Lilly is putting pressure on realized pricing, while investors are increasingly asking what will replace the growth generated by Wegovy and Ozempic over the next decade.
The latest catalyst is Novo’s willingness to pursue larger acquisitions and partnerships to strengthen its obesity and cardiometabolic pipeline.
Cyclical Decline - perfect setup is ready, $30 nextseems a repeatable pattern is being set, if so $30 and the following rebound should be swift and satisfying all sides - long and short.
The information and publications are not meant to be, and do not constitute, financial, investment, trading, or other types of advice or recommendations
NVO | Weekly Structure | $48 Could Unlock the Bull CaseThesis:
NVO has spent more than a month compressing inside my $44-$48 accumulation zone, around several important long-term technical levels. I believe this consolidation is becoming increasingly constructive. If $48 can break and then flip to support, I would consider the Bull Case active and expect the next impulsive move higher to begin.
Context
- Weekly timeframe
- This is an update to my long-term NVO cycle analysis published earlier this year
- Price has been oscillating around the $44
Novo Nordisk A/S (NVO) — Technical Analysis Weekly (1W) | Current price: ~$47.51
Market Structure
NVO remains in a long-term bearish trend, clearly defined by the descending orange trendline from the ~$78 area.
However, the current price action is becoming interesting because NVO is approaching a potential accumulation/reversal zone around $45–47.
🟢 LONG SETUP
Entry Zone: $45–47
This is the zone marked on the chart, and technically it makes sense because price is:
Testing the descending trendline.
Holding above the major $40.74 supp
Novo Nordisk A/S Class B (NOVO_B) – Bearish Setup | Target: 287Novo Nordisk A/S Class B (NOVO_B): Arc Cycle Analysis
Overview: Based on Arc Cycle Analysis applied to the 2h chart, Novo Nordisk is interacting with the 0.786 Arc within the current Arc Cycle. Price remains centered around this Arc, indicating that directional confirmation has not yet been established.
Novo Nordisk – Bullish Setup | Target: 306.00 #44NOVO_B Price Outlook: Novo Nordisk Holds Above 1 (100%) Support Arc | Potential Rebound Toward 306.00
Novo Nordisk A/S Class B (NOVO_B): Arc Cycle Analysis
Overview: Based on Arc Cycle Analysis applied to the 30m chart, Novo Nordisk is interacting with the 1 (100%) Support Arc within the current Arc Cycle. Price is holding above this Support Arc, suggesting the potential for a bullish rebound toward the next Resistance Arc.
Market Outlook
Price is holding above the 1 (100%) Support Arc, indi
EW count suggests that Novo might be reversingMy count is disproportionate and wave 3 in (3) is not the smallest only on log scale. However, there are chances that the stock has reversed its trend.
Zigzag correction off the top might be done and I outlined a couple of leading diagonal scenarios that might play out.
What I really like is wave (C) sharp movement which raises chances that we've bottomed.
Alternative option is that the bottom to be seen later if $35 breaks.
I'd say that the stock needs to find support above $51 during this
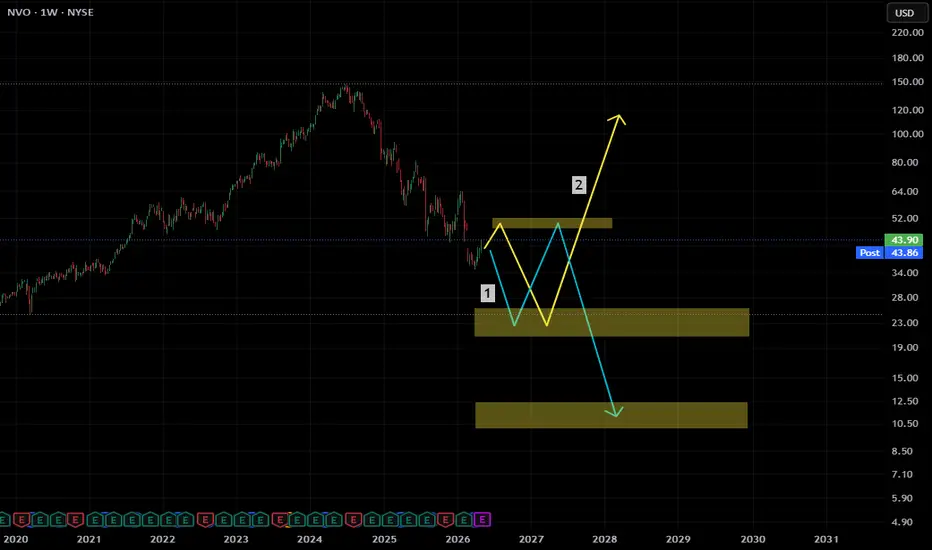
$NVO , IdeaWeekly chart. A pharma giant at a crossroads.
NVO lost over 70% from its 2024 peak. The GLP-1 narrative cracked, competition arrived, and the market repriced brutally. Now at $43, it sits just above two major demand zones.
Two scenarios on the table:
Scenario 1 (yellow) : Capitulation into the $22 zone, a bounce back toward $48–$52 resistance, then rejection and a final flush into the deeper $10.50–$12.50 zone. The full reset. Classic distribution-to-markdown sequence.
Scenario 2 (cyan) : T
NVO: Bullish Pennant Breakout Unlocks $+70$ Macro Target### **The Macro Picture**
Following a strong rally into early **2026**, **Novo Nordisk A/S ( NYSE:NVO $)** entered a healthy, multi-month consolidation phase. During this time, the price formed a textbook **Bullish Pennant** pattern, systematically carving out a series of lower highs and higher lows.
The compression phase has officially resolved to the upside. With price currently trading at **$50.56**, NYSE:NVO $ has cleanly broken out of the descending resistance trendline and is showing st
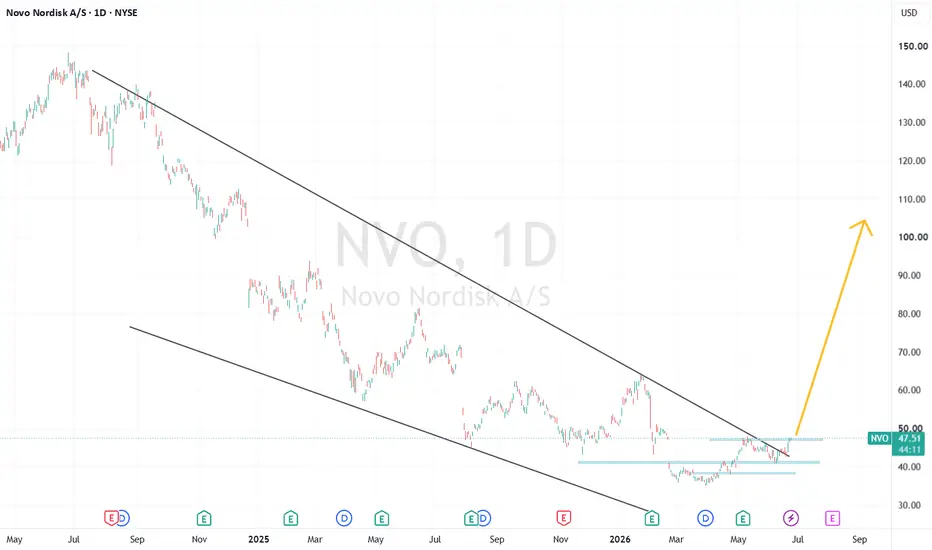
Novo Nordisk (NVO) | 1D Technical AnalysisNovo Nordisk is approaching a critical technical inflection point after spending months in a primary downtrend. The recent price action is forming a Falling Wedge directly beneath the long-term descending trendline—a pattern that often precedes a bullish reversal when confirmed by a breakout.
Market Structure
The long-term trend remains bearish, defined by a sequence of lower highs and lower lows. However, the selling pressure has weakened significantly, and buyers are gradually regaining cont
Novo Nordisk (NOV)Novo Nordisk (NVO) reported strong first-quarter earnings on May 6, 2026, with sales jumping 32% to reach 96.8 billion Danish kroner (~$15.2 billion).
Driven by soaring demand for its popular GLP-1 weight-loss and diabetes drugs like Wegovy and Ozempic, the company beat earnings estimates and raised its full-year 2026 guidance.
Earnings Per Share (EPS): Novo reported a diluted Q1 EPS of $1.04, beating the average analyst estimates of $0.87.
The company raised its full-year guidance, projecti
NVO: Bullish Pennant Signals Potential Return to $150Novo Nordisk appears to be developing a compelling long-term reversal setup after a prolonged decline from its previous highs.
Following a significant selloff, price has spent several months building a base between $38 and $50. The recent recovery has pushed NVO back above a key psychological level while a bullish pennant pattern continues to develop on the weekly timeframe.
The current structure suggests accumulation may be transitioning into a new uptrend. A sustained move above the $50 area
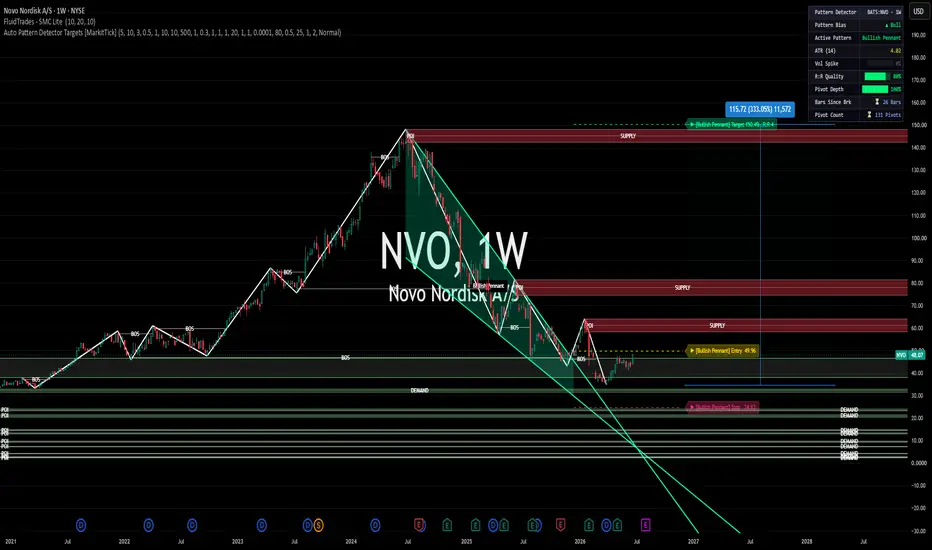
NVO: Weekly Falling Wedge Lines Up With Key FVGNovo Nordisk (NVO) is basing after an extreme drawdown — the stock ran from ~$40 to ~$150 through 2024, then gave nearly all of it back in a sharp decline back to the low $40s on GLP-1 competition and trial-data pressure.
Price just printed an +11.30% weekly reversal candle, closing at 48.07, and the pattern detector has flagged the recovery structure off the bottom as a Bullish Pennant.
Setup — Weekly Bullish Pennant
Entry: 49.96
Stop: 24.83
Target: 150.49
Risk:Reward: ~4R
R:R Quality: 80% |
Downtrend Breakout Reversal.Novo Nordisk (NVO) currently represents a high-quality large-cap growth franchise in a transitional market phase, where fundamentals and technicals are beginning to realign after a significant sentiment-driven drawdown. The company remains structurally advantaged with dominant positioning in the GLP‑1 obesity and diabetes markets, strong double-digit revenue growth (~30%+), high margins, and robust cash generation, yet trades at a compressed valuation (~11x earnings), reflecting market concerns
$NVO (Novo Nordisk): 1-day. CUP & HANDLE breakout!NYSE:NVO (Novo Nordisk): 1-day
Six days later, and in my opinion it's still the best-looking chart among the large-cap names.
The price has reclaimed the green 200 MA ($47.8), which should now act as the main support zone if a pullback develops. I still think we're in Elliott Wave 3, so I'd consider a correction somewhere between $42.5 and $46.
The yellow 50 MA is sitting at $44.5 and could catch up to the 200 MA from below within the next few days, potentially forming a Golden Cross. Daily
We're now on the verge of breaking above the channel.NYSE:NVO is now back above $50.
Bought the exact bottom and still fully long.
We're now on the verge of breaking above the channel. I think the higher-probability scenario is that we've transitioned into a trading range (yellow).
If that's the case, we're now around the middle of that range, making the $60 area the first upside target.
#NovoNordisk NYSE:LLY #Stocks
NVO: Massive Weekly Bullish Pennant Nearing Macro Breakout📊 Macro Overview & Structural Context
Looking at the NVO weekly chart, price action is currently compressing inside a massive, long-term Bullish Pennant pattern that has been forming since mid-2024. Following a powerful multi-year impulse wave, this extended correction has allowed the stock to fully reset its technical indicators and mitigate deep structural liquidity pools.
🔍 Key Technical Observations
SMC Demand Mitigation: The FluidTrades SMC indicator reveals that price is actively reacting
Is Novo breaking out of a falling trend channel?In 2024, Novo formed a head–shoulder pattern with a breakdown at the end of September. Since then, the stock has been moving within a falling trend channel until now.
On September 18 this year, the stock broke above the trend channel by 6–7% on increased volume. It has since pulled back to test the upper line of the channel and is now moving up again.
There is resistance around 390. If the stock breaks significantly above this level with rising volume, it will be clearly technically positive.
$NVO (Novo Nordisk) - 1-day, BREAKOUT from ACCUMULATION?NYSE:NVO (Novo Nordisk) - 1-day
One of the cleaner charts out there. The stock has been correcting since its 2024 all-time high ($148), and since 2025 we've started to see signs that the selling pressure is slowing down.
There was a weak breakout from the Falling Wedge (measured move target around $91+), and now a nice Cup & Handle pattern appears to be forming. The neckline sits around $47, with the 200-day moving average (green) at approximately $48.
If this really is a valid Cup & Handle,