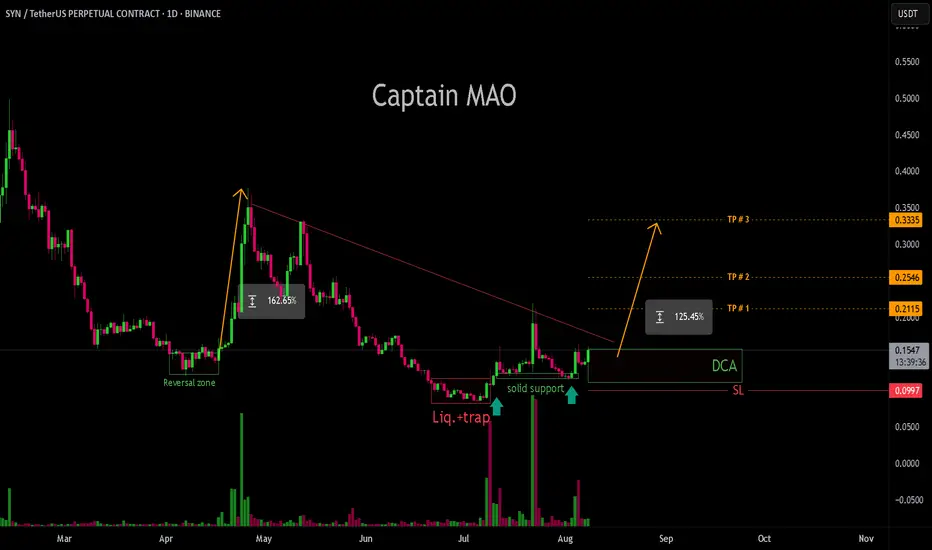
Will Arthur Paper Hand $SYN Too?Arthur Hayes is the co founder of BitMEX and he has built a reputation as one of crypto’s loudest macro thinkers, always talking big cycles, big narratives, and even bigger price targets!
The story is usually the same, he lays out a long term vision for where tokens *could* go if everything plays out perfectly But the market doesn’t trade on vision alone, it trades on timing, conviction, and sometimes… impatience
The funny contrast comes from what happens after those predictions. Time and again, his exits appear far earlier than his targets would suggest. It creates this running joke in the market where people don’t just listen to what he says a token *could* reach they also quietly track how long it takes before he decides he’s done holding it
The track record being circulated is what fuels the “paper hands” narrative
KUCOIN:HYPEUSDT was talked up to $150 but exited near $61. COINBASE:ZECUSD had a $10K dream but got cut around $423. $CARDS barely had time to breathe before it was sold, and BINANCE:WLDUSDT became almost a meme itself after being declared “still held” right before it wasn’t
Whether these exits were risk management or just timing, the pattern is what people fixate on
Now the spotlight has shifted to BINANCE:SYNUSDC , which was publicly highlighted on June 29.In crypto culture, that timestamp matters more than it should because it basically starts a countdown timer in everyone’s head, Not to the target price but to the exit
The question isn’t “how high can it go,” it’s “how fast until it gets rotated out?”
And that’s the punchline of the whole narrative. Arthur’s predictions are long term, but the market experience around them has become very short term. Maybe CRYPTO:SYNUSD breaks the pattern, maybe it doesn’t but at this point, traders aren’t just watching charts. They’re watching the clock
If you are a pro crypto trader, you are already enjoying the pumps and taking profits.. If you are new to the crypto world, don’t follow or chase these whales and pumps blindly
In-depth trading ideas
SYN: Overextended Growth Hits Historical BlockSYN: Overextended Growth Hits Historical Block – A Strategic Playbook Awaiting Technical Pullbacks to Initiate Long Entries
SYN is recording an exceptionally decisive upward expansion wave on its macro timeframe, officially shattering its long-term stagnation phase to log a massive bull market layout in 2026. Intense proactive buying pressure propelled price candles up by 14 times, stretching from a macro bottom floor of 0.026 USD straight up to the 0.369 USD milestone. Actual immediate price action indicates that upon testing the rigid historical resistance block established back in April 2025, the price development has temporarily paused and entered a minor pullback toward the 0.3245 USD cluster.
Observing the daily visual technical chart, because this preceding rally expanded almost vertically, price candles are now trading severely overextended far above the 100-period moving average (MA100). According to standard market principles, a textbook technical retracement is highly required at this juncture to flush out short-term profit-taking and re-accumulate underlying liquidity. The most disciplined strategy right now is to strictly avoid chasing late entries at these premium levels, ensuring you remain shielded from local trend exhaustion traps.
Instead, the sharpest playbook is to remain patient on the sidelines, waiting for a standard technical retreat deeper into the rigid underlying support floor between the 0.22 - 0.24 USD zone. This specific value area represents a vital technical confluence buffer because it perfectly aligns with the 38.2% Fibonacci retracement baseline – the exact mathematical threshold where buyers historically demonstrate the strongest proactive demand. Triggering strategic trend-following buy (Long) entries within this safe floor optimizes your risk profile with a tight stop-loss, safeguarding your capital to capture the next primary leg of expansion.
this is not investment advice, DYOR
SYN SHORT!! ITS PEAK!!Don't be fooled by fake increases that are very FRAGILE!
In my opinion, after monitoring this coin, its volume has increased unnaturally and is heavily manipulated. Considering BTC has now reached 59,000 again, I think it's time for this coin to drop.
This is a very forced increase, considering the volume is so disproportionate, it's likely a small retail push, which is very dangerous and will be eaten up by whales soon.
Yes, it really doesn't make sense! Please DWYOR :)
SYN: Healthy Pullback Before the Next Move? CRYPTOCAP:SYN is showing impressive strength while most traders remain focused on BTC and ETH.
After rallying from $0.238 to $0.337, the price is now consolidating around the $0.29-$0.30 region. So far, this looks more like a healthy cooldown than a complete trend reversal.
Key levels I’m watching:
🔹 Support: $0.248 - $0.260
🔹 Resistance/Reclaim: $0.310
🔹 Breakout Trigger: $0.337+
Fundamentally, Synapse is gaining attention due to its Hypercall cross-chain execution layer and the ongoing migration to Cortex (CX), both of which are driving market interest.
A large percentage of futures traders are still positioned short, which could create additional volatility if bullish momentum continues.
For me, the most important thing now is seeing whether price can hold the $0.260 support zone. If buyers defend that area, another attempt at today’s high becomes more likely.
This is my personal market view and not financial advice. Always do your own research and manage risk accordingly.
What are your thoughts on CRYPTOCAP:SYN ? Bullish continuation or local top?
#SYNUSDT #SYN #Synapse #Altcoins #Crypto #TechnicalAnalysis
GOOD TIME TO BUY SYNAPSE (SYN)1. Market Structure Shift (MSS)
After a prolonged downtrend from the $1.00 highs, the price has entered a "Horizontal Accumulation" phase.
The Squeeze: The EMAs (Exponential Moving Averages) are tightly clustered. In trading, period of low volatility (contraction) almost always precedes a period of high volatility (expansion).
Price Action: The price is currently reclaiming the EMA ribbon. If it holds above $0.082, it confirms that the "floor" is in, and the trend is transitioning from bearish to bullish.
2. High Asymmetric Risk/Reward
This is the primary reason professional traders take this setup.
Downside: The downside is limited because the price is already near historical lows. A stop loss below the recent swing low (~$0.065) is relatively tight.
Upside: The path to $0.20 is relatively clear of heavy resistance. If the macro target of $1.10 is hit (as per your yellow projection), the R/R ratio is over 1:10, which is an elite-tier trade setup.
3. Volume and Liquidity
The "flat" price action at the bottom suggests that "weak hands" have already sold, and "strong hands" (accumulators) are quietly absorbing the remaining supply. Once the breakout triggers, the lack of overhead sell orders (liquidity gaps) could lead to a very fast move toward $0.30 - $0.40.
Trade Execution Plan
Entry Zone: $0.082 – $0.088 (Current market price is an optimal entry).
Stop Loss (SL): Daily close below $0.065. If this level breaks, the accumulation thesis is invalidated.
Take Profit Targets:
TP1: $0.18 – $0.20 (Initial resistance & 2x move).
TP2: $0.45 (Previous breakdown point).
Moon Target: $1.00+ (Macro trend reversal).
Summary for the Professional Mindset
"Buy the quiet, sell the hype."
SYNUSDT Forming Bullish PennantSYNUSDT is forming a clear bullish wave pattern, a classic bullish Pennant signal that often indicates an upcoming breakout. The price has been consolidating within a narrowing range, suggesting that selling pressure is weakening while buyers are beginning to regain control. With consistent volume confirming accumulation at lower levels, the setup hints at a potential bullish breakout soon. The projected move could lead to an impressive gain of around 190% to 200% once the price breaks above the wedge resistance.
This falling wedge pattern is typically seen at the end of downtrends or corrective phases, and it represents a potential shift in market sentiment from bearish to bullish. Traders closely watching SYNUSDT are noting the strengthening momentum as it nears a breakout zone. The good trading volume adds confidence to this pattern, showing that market participants are positioning early in anticipation of a reversal.
Investors’ growing interest in SYNUSDT reflects rising confidence in the project’s long-term fundamentals and current technical strength. If the breakout confirms with sustained volume, this could mark the start of a fresh bullish leg. Traders might find this a valuable setup for medium-term gains, especially as the wedge pattern completes and buying momentum accelerates.
✅ Show your support by hitting the like button and
✅ Leaving a comment below! (What is your opinion about this Coin?)
Your feedback and engagement keep me inspired to share more insightful market analysis with you!
SYNUSDT Forming Bullish PennantSYNUSDT is forming a clear bullish pennant pattern, a classic bullish reversal signal that often indicates an upcoming breakout. The price has been consolidating within a narrowing range, suggesting that selling pressure is weakening while buyers are beginning to regain control. With consistent volume confirming accumulation at lower levels, the setup hints at a potential bullish breakout soon. The projected move could lead to an impressive gain of around 190% to 200% once the price breaks above the wedge resistance.
This falling wedge pattern is typically seen at the end of downtrends or corrective phases, and it represents a potential shift in market sentiment from bearish to bullish. Traders closely watching SYNUSDT are noting the strengthening momentum as it nears a breakout zone. The good trading volume adds confidence to this pattern, showing that market participants are positioning early in anticipation of a reversal.
Investors’ growing interest in SYNUSDT reflects rising confidence in the project’s long-term fundamentals and current technical strength. If the breakout confirms with sustained volume, this could mark the start of a fresh bullish leg. Traders might find this a valuable setup for medium-term gains, especially as the wedge pattern completes and buying momentum accelerates.
✅ Show your support by hitting the like button and
✅ Leaving a comment below! (What is your opinion about this Coin?)
Your feedback and engagement keep me inspired to share more insightful market analysis with you!
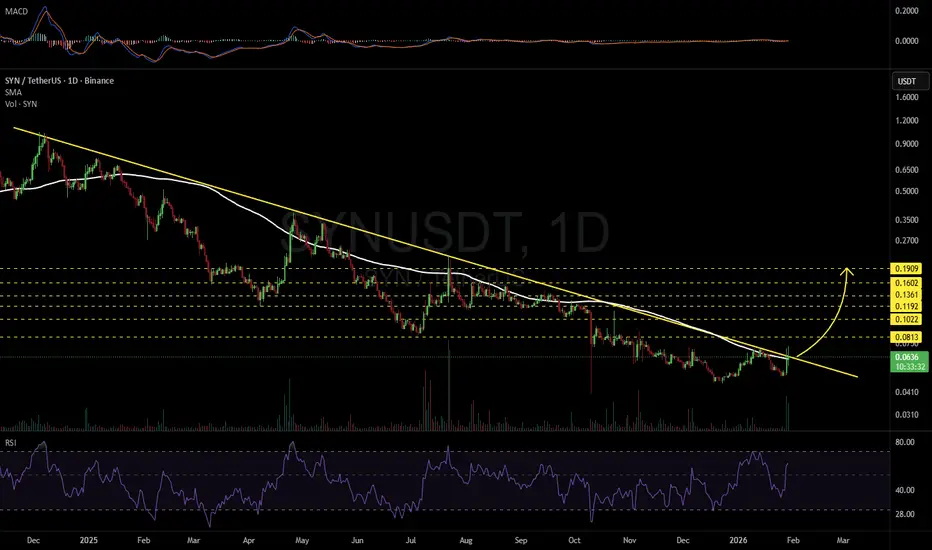
SYNUSDT 1D#SYN is testing the long-term descending resistance and the daily SMA100. Volume has increased significantly. If a breakout occurs, the potential upside targets are:
🎯 $0.0813
🎯 $0.1022
🎯 $0.1192
🎯 $0.1361
🎯 $0.1602
🎯 $0.1909
⚠️ Always apply tight stop-losses and maintain strict risk management.
SYN Analysis (4H)Considering the sweep of the liquidity pool, a strong CH, and the creation of higher lows, the price structure appears bullish. Therefore, we are looking for a long/buy position in the demand zones.
We have two entry points, and if the price pulls back, we will enter the position.
The targets are marked on the chart.
A daily candle closing below the invalidation level will invalidate this analysis.
For risk management, please don't forget stop loss and capital management
When we reach the first target, save some profit and then change the stop to entry
Comment if you have any questions
Thank You
SYNUSDT Forming Falling WedgeSYNUSDT is forming a clear falling wedge pattern, a classic bullish reversal signal that often indicates an upcoming breakout. The price has been consolidating within a narrowing range, suggesting that selling pressure is weakening while buyers are beginning to regain control. With consistent volume confirming accumulation at lower levels, the setup hints at a potential bullish breakout soon. The projected move could lead to an impressive gain of around 190% to 200% once the price breaks above the wedge resistance.
This falling wedge pattern is typically seen at the end of downtrends or corrective phases, and it represents a potential shift in market sentiment from bearish to bullish. Traders closely watching SYNUSDT are noting the strengthening momentum as it nears a breakout zone. The good trading volume adds confidence to this pattern, showing that market participants are positioning early in anticipation of a reversal.
Investors’ growing interest in SYNUSDT reflects rising confidence in the project’s long-term fundamentals and current technical strength. If the breakout confirms with sustained volume, this could mark the start of a fresh bullish leg. Traders might find this a valuable setup for medium-term gains, especially as the wedge pattern completes and buying momentum accelerates.
✅ Show your support by hitting the like button and
✅ Leaving a comment below! (What is your opinion about this Coin?)
Your feedback and engagement keep me inspired to share more insightful market analysis with you!
SYNUSDT 1D#SYN is moving inside a falling wedge on the daily chart. It has been rejected from the daily SMA50 and may retest the wedge support line. In case of a bounce from the support and a breakout above the pattern, the potential targets are:
🎯 $0.0864
🎯 $0.1064
🎯 $0.1225
🎯 $0.1386
🎯 $0.1616
🎯 $0.1909
❌ Invalidation: a daily candle closing below the wedge.
⚠️ Always remember to use a tight stop-loss and maintain proper risk management.
On-Demand Analysis: $SYN/USDTThis 6H chart shows a drop from around 0.1138 to a low of 0.0840 recently, but it’s now up 23.8% in the last 24 hours due to a technical rebound, whale accumulation, and market-wide liquidity inflows—despite lingering delisting risks!
The tiny dip (-0.30%) today might just be a pause.
A falling wedge pattern is forming—could be a sign of more gains!
Crux:
Support Zone: A strong base is at 0.0900-0.1000, where buyers might step in.
Resistance Level: The next big test is at 0.1100-0.1138 break that, and it could rise!
Falling Wedge: This pattern, with its narrowing lines, often signals a bullish move if it breaks above 0.1138.
Momentum: The uptrend has steady volume, boosted by whale activity and liquidity inflows, though delisting risks linger
Timeframe:Watch the next few days for the wedge to break out
Possibilities:Bullish Move: A jump above 0.1138 with good volume could push it to 0.1300 or more
Bearish Drop: A fall below 0.0900 might take it back to 0.0840—stay careful!
Safety Tip: Set a stop-loss below 0.0900 to stay safe.
SYNUSDT 1DConsider buying some #SYN here and near the support zone. In case of a breakout above the descending resistance and the daily SMA100, the potential targets are:
🎯 $0.1284
🎯 $0.1558
🎯 $0.1780
🎯 $0.2002
🎯 $0.2318
🎯 $0.2720
⚠️ Always remember to use a tight stop-loss and follow proper risk management.
SYNUSDT: Mid-Term AnalysisPrice is rising strongly.
The blue box is a fair price to join as a buyer if the market gives it.
I’m not chasing high prices. If price returns to my blue box, I’ll watch for:
✅ Footprint absorption
✅ CDV support
✅ Structure reclaim
If these align, I’ll consider a long with clear risk. If not, I’ll wait.
The right price, or no trade.
📌I keep my charts clean and simple because I believe clarity leads to better decisions.
📌My approach is built on years of experience and a solid track record. I don’t claim to know it all but I’m confident in my ability to spot high-probability setups.
📌If you would like to learn how to use the heatmap, cumulative volume delta and volume footprint techniques that I use below to determine very accurate demand regions, you can send me a private message. I help anyone who wants it completely free of charge.
🔑I have a long list of my proven technique below:
🎯 ZENUSDT.P: Patience & Profitability | %230 Reaction from the Sniper Entry
🐶 DOGEUSDT.P: Next Move
🎨 RENDERUSDT.P: Opportunity of the Month
💎 ETHUSDT.P: Where to Retrace
🟢 BNBUSDT.P: Potential Surge
📊 BTC Dominance: Reaction Zone
🌊 WAVESUSDT.P: Demand Zone Potential
🟣 UNIUSDT.P: Long-Term Trade
🔵 XRPUSDT.P: Entry Zones
🔗 LINKUSDT.P: Follow The River
📈 BTCUSDT.P: Two Key Demand Zones
🟩 POLUSDT: Bullish Momentum
🌟 PENDLEUSDT.P: Where Opportunity Meets Precision
🔥 BTCUSDT.P: Liquidation of Highly Leveraged Longs
🌊 SOLUSDT.P: SOL's Dip - Your Opportunity
🐸 1000PEPEUSDT.P: Prime Bounce Zone Unlocked
🚀 ETHUSDT.P: Set to Explode - Don't Miss This Game Changer
🤖 IQUSDT: Smart Plan
⚡️ PONDUSDT: A Trade Not Taken Is Better Than a Losing One
💼 STMXUSDT: 2 Buying Areas
🐢 TURBOUSDT: Buy Zones and Buyer Presence
🌍 ICPUSDT.P: Massive Upside Potential | Check the Trade Update For Seeing Results
🟠 IDEXUSDT: Spot Buy Area | %26 Profit if You Trade with MSB
📌 USUALUSDT: Buyers Are Active + %70 Profit in Total
🌟 FORTHUSDT: Sniper Entry +%26 Reaction
🐳 QKCUSDT: Sniper Entry +%57 Reaction
📊 BTC.D: Retest of Key Area Highly Likely
📊 XNOUSDT %80 Reaction with a Simple Blue Box!
📊 BELUSDT Amazing %120 Reaction!
📊 Simple Red Box, Extraordinary Results
📊 TIAUSDT | Still No Buyers—Maintaining a Bearish Outlook
📊 OGNUSDT | One of Today’s Highest Volume Gainers – +32.44%
📊 TRXUSDT - I Do My Thing Again
📊 FLOKIUSDT - +%100 From Blue Box!
📊 SFP/USDT - Perfect Entry %80 Profit!
📊 AAVEUSDT - WE DID IT AGAIN!
I stopped adding to the list because it's kinda tiring to add 5-10 charts in every move but you can check my profile and see that it goes on..
SYN/USDT – Bullish Structure & Key Reversal Zoneis forming a clean bullish structure, with the first leg of the reversal starting from the $0.12 zone, which acted as a key pivot level. A recent liquidity sweep below $0.12 has now been fully reclaimed, suggesting strong buyer presence and a confirmed reversal signal.
With price stabilizing above this reclaimed zone, SYN is showing early signs of building momentum for the next leg higher. Holding above $0.12 may pave the way for continuation and potential trend acceleration.
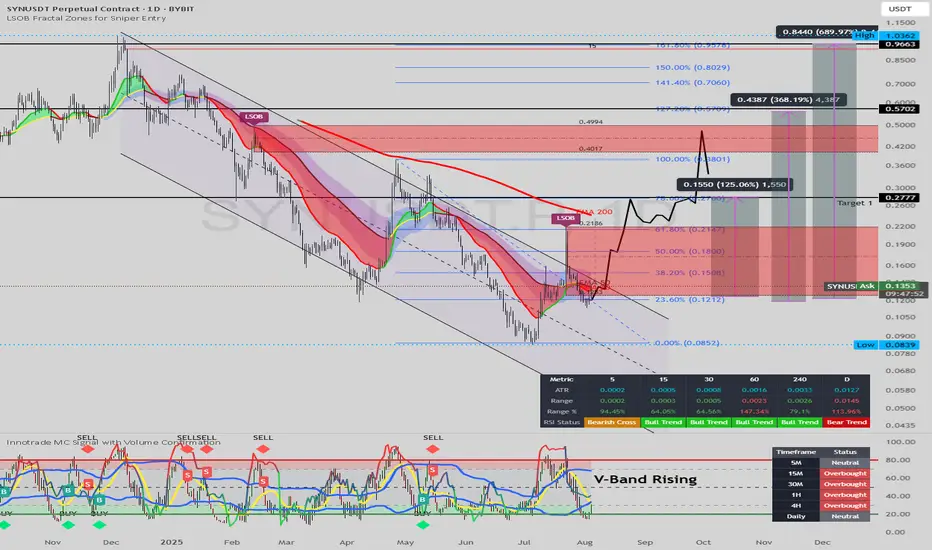
SYNUSDT: Breaking Long-Term Downtrend, Poised for a Major Rally?Firstly, our Algo-based indicators are used to create this analysis. Follow me so you don't miss, Boost and leave your comments if you profited with our posts, so we may continue:
This daily chart for SYNUSDT showcases a significant technical development as the price appears to be breaking out of a multi-month descending channel, signaling a potential major trend reversal.
Analysis:
Descending Channel Breakout: The price has been confined within a clear descending channel for most of the year. The recent price action shows a decisive push above the upper boundary of this channel. It is currently consolidating right above this broken trendline, which is a classic "breakout-and-retest" pattern.
Key Support: The current price is finding support at the 23.6% Fibonacci retracement level (around $0.1212). A successful hold above this level would reinforce the bullish breakout.
Momentum Indicator: The Innotrade MC Signal at the bottom provides strong confluence. The indicator is sharply rising from the oversold "BUY" zone in a pattern labeled "V-Band Rising," which suggests a powerful burst of bullish momentum from a bottom.
Price Projection and Targets: The illustrated price path anticipates a strong upward move following this retest phase.
The first major area of resistance to watch is the zone between the 61.8% Fib level (0.2147)
𝑎
𝑛
𝑑
𝑡
ℎ
𝑒
78.6, (0.2147). This area also contains a previous order block (LSOB) and the EMA 200.
Target 1: is explicitly marked at $0.2777.
Higher targets based on Fibonacci extensions are noted at $0.5709 and above for the longer term.
Strategy:
Position : Long (Buy)
Entry: The current price level, retesting the broken channel trendline (around $0.12 - $0.14), presents a strategic entry point.
Targets: The initial primary target is $0.2777, with further long-term potential if bullish momentum is sustained.
Conclusion:
The combination of a breakout from a long-term bearish structure, a successful retest of support, and powerful momentum indicators suggests that SYNUSDT could be at the beginning of a new, significant uptrend. The current price offers a favorable risk-to-reward entry for a move towards the identified targets.
Disclaimer: This analysis is for educational purposes only and should not be considered financial advice. Always conduct your own research and manage risk appropriately.
SLong
SYNUSDT Forming Falling WedgeSYNUSDT is currently exhibiting a falling wedge pattern, a classically bullish structure that often precedes a breakout to the upside. This setup forms when price action contracts between two downward-sloping trend lines, indicating a slowing of selling momentum and the potential for a strong reversal. As SYNUSDT trades within this narrowing range, increasing investor interest and a notable uptick in volume suggest that a breakout could be on the horizon.
A falling wedge pattern, when supported by good volume, often signals accumulation by smart money ahead of a bullish reversal. With SYN (Synapse) being a prominent player in the cross-chain interoperability and bridging space, the project continues to attract both retail and institutional attention. The expected gain of 290% to 300% aligns with previous breakout behaviors seen from similar wedge patterns in SYN’s trading history. As the crypto market gradually recovers from recent volatility, assets with solid use cases and active development teams are likely to outperform—and SYN fits that profile.
Technical indicators such as RSI and MACD are showing early signs of a reversal, supporting the bullish bias. A confirmed breakout above the upper trendline with a sustained volume increase could trigger a swift rally, reclaiming previous resistance zones and offering traders an attractive risk-to-reward ratio. The 4H and daily charts suggest momentum is building, which makes this a key watchlist candidate in the short term.
With its real-world utility in DeFi infrastructure and increasing partnerships, SYN is becoming a cornerstone for multichain liquidity transfers. SYNUSDT may be poised for a meaningful upward move if this falling wedge pattern completes successfully.
✅ Show your support by hitting the like button and
✅ Leaving a comment below! (What is You opinion about this Coin)
Your feedback and engagement keep me inspired to share more insightful market analysis with you!
Synapse Short-Term Trade, To Move Next · 309% Profits PotentialLet me give you another pair that is ready to move, just in case you want to make some quick profits for the weekend (next weekend).
Good evening my fellow Cryptocurrency trader, how are you feeling in this wonderful day?
Everything we were expecting is now becoming all true. The altcoins market is bullish and moving up. We have long-term and short-term charts. Here you have a little bit of both.
Synapse will grow long-term of course, but we will focus on a sudden jump that will be happening next. Can be tomorrow, in a few days or a week or so maximum. The chart is bullish now.
Many pairs are moving past their April's high, I take this as a very strong bullish signal. Many pairs are still trading below. I take this also as an opportunity, it means that we can buy them before the breakout and enjoy fast, easy growth. The choice is yours.
Trading above EMA8/13/21/34.
Yesterday's candle is interesting and the really high volume 8-July. Remember, high volume at low prices with marketwide bullish action and you need no more. We are bullish, bullish now, bullish later—may profits come. Thanks a lot for your continued support.
309% potential profits is the next high. A minor stop and then higher.
You can cap your earnings even sooner at 124%, 226% or wait for the full 300%. Whatever you choose is up to you. Easy win with low risk when trading spot; you can't go wrong.
Thanks a lot for the follow, the trust and your continued support.
-----
The chart also shows a rounded bottom as a lower low. The lower low is a bullish signal because all weak hands were removed. When support is pierced on a broader bullish bias this is bullish. The action is happening back above the 7-April low and this works as confirmation of the move that I am predicting now. The pierce of support is not a bearish impulse/wave but rather a stop-loss hunt event.
Namaste.
SYNUSDT Forming Falling WedgeSYNUSDT is showing a classic falling wedge pattern, which is widely known as a strong bullish reversal signal in crypto technical analysis. This pattern suggests that the downtrend might be coming to an end, and the recent uptick in trading volume adds further confidence that a breakout could be imminent. With an ambitious expected gain of 290% to 300%+, SYN is positioning itself as a potential high-reward opportunity for traders who are ready to act early on a trend reversal.
The Synapse protocol, which powers SYN, continues to expand its cross-chain interoperability solutions, attracting fresh investor interest. As DeFi users and protocols seek seamless asset transfers across different blockchains, Synapse’s technology stands out, driving long-term growth potential for its token. The increased developer activity and expanding partnerships contribute to a solid fundamental backdrop that supports this optimistic technical setup.
From a technical standpoint, traders should keep a close watch on the resistance line of the falling wedge. A confirmed breakout with strong volume could act as a catalyst for rapid price movement toward the target zone. Patience and good risk management will be key, as such large percentage gains often come with significant volatility.
✅ Show your support by hitting the like button and
✅ Leaving a comment below! (What is You opinion about this Coin)
Your feedback and engagement keep me inspired to share more insightful market analysis with you!
SYN | Expected 25% Gain!!!Technical Analysis Update
A parallel channel breakout and retest has been confirmed on the daily timeframe✅, indicating a potential massive bullish rally. We anticipate a 25% bullish wave in the coming days. 🎯🚀
Trading Strategy
- Entry: Consider long positions
- Stop-loss: Set at 0.1834, just below the support level
- Risk-reward ratio: 1:3
Trading Reminder
- Assess your risk and calculate potential losses before entering any trade.
- Trade wisely and only enter positions that align with your strategy and risk tolerance.
- Stay calm and avoid impulsive decisions driven by FOMO. Trading is a long-term journey.