
 Short
ShortIn-depth trading ideas
Short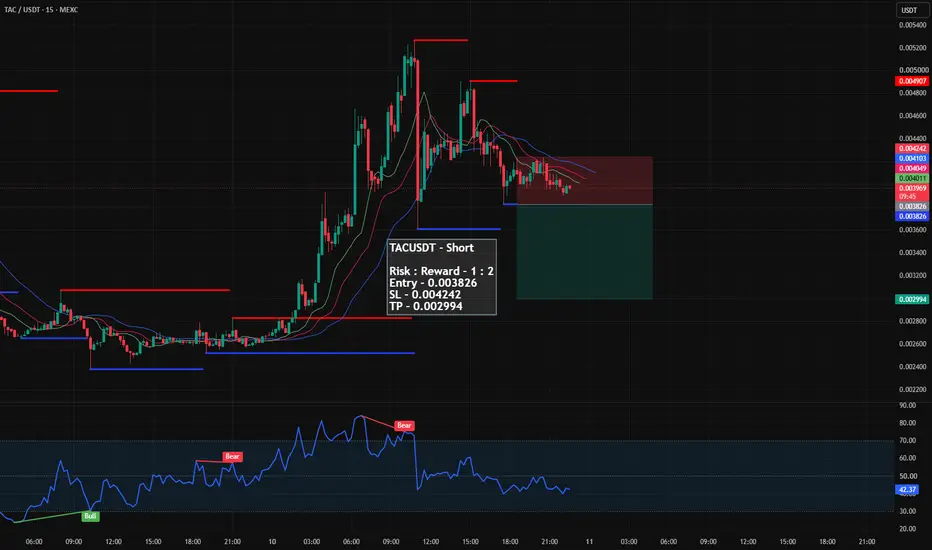
TACUSDT.P: short setup from daily support at 0.029791BINANCE:TACUSDT.P looks very bearish. After a pump, it's heading down, and yesterday we saw an attempt to rise that ended in nothing: the asset closed at its opening price, which tells us the sellers won.
You can also clearly see a level on the chart that the price has stuck to, and it's simply consolidating above it. Overall, a very strong picture for a short.
Short
TAC Ready for a 50% Correction?After a massive run-up, TAC could be entering a high-risk zone where early investors and short-term traders begin locking in profits.
🔹 Momentum is extremely extended
🔹 Volatility is increasing
🔹 A 30–50% pullback would not be unusual after such explosive gains
Strong projects can still experience deep corrections during bullish trends. Watch support levels closely and manage risk accordingly.
Are you taking profits here or holding for the next leg up? 👇
Short
TAC SELL IDEA1. Price managed to reach all time highs
2. Price managed to create liqudity denoted by the multiple wicks
3. Price purged all the wicks and Changed its state of delivery (CISD)
4. We have IFVGs - to be use as resistance
5. We have Equal lows to purge and H4 FVG
Short Short
Short
TACUSDT - Long TACUSDT - Long
1. Bearish Divergence observed
2. Retracement from 1st fib level
Entry: 0.025067
SL: 0.023582
TP 1: 0.026595
TP 2: 0.028073
Long
TAC EADY TO FLY🔥 Fortune AI Radar — NYSE:TAC
Fresh activity detected on NYSE:TAC today.
Data suggests increasing market interest & buyers stepping in.
Technicals currently lean bullish, with momentum trending upward.
Whales showing hints of accumulation and hype rising among traders.
This coin is flashing strong signals on short-term charts — worth keeping an eye on 👀
Not financial advice — always research before taking decisions
Long
TAC to 0.0054 (short)Nahum 1:8 — "But with an overrunning flood he will make an utter end of the place thereof, and darkness shall pursue his enemies."
TAC at 0.0054. The flood cometh. I am not swimming. I am shorting.
Short
TACUSDT Squeeze Fired But Volume Says Not So FastTACUSDT at 0.004820 with futures running 62.12M against 7.39M spot — an 8.4x futures-to-spot ratio. Dollar side confirms it at 299.42K futures versus 35.61K spot. Real spot demand is not driving this move.
Signal board shows 38 green out of 112, Strong BULL bias at 43.07% scoring 2.51x. EMA clean at 8-0, C>T 11-3, Ichi 9-4 all pointing up. Candle signals dissenting at 5-9 and DD/SS at 2-4 add weight to the caution side. Squeeze fired with momentum reading Bull up and Bollinger Width at 36.29% in Explosion territory. Bear Cascade still active at 8 bars in at 30.8%.
Spot Z at -0.64 Quiet with the trend falling across the 0-5 window at -0.64, -0.39, -0.25 — spot participation declining as price moves higher. Futures Z -0.33 Steady, combined F+S Z -0.34 Steady. Spot:Fut reading Normal but the ratio context overrides that label.
Leverage at 8.43x elevated and rising. Percentile at 11.6% Floor — structurally supportive. Price at 23.6% of historical range also near floor. AT Max was 69.25x just 75 bars ago. Squeeze divergence explicitly flagging Futures Only Trap.
OBV Z the standout read at 1.35 Strong up, trending consistently across the 0:5 window at 1.35, 0.81, 0.54. Accumulation building on balance is real. OBV Div shows Spread Divergence. Liquidations clear, no whale activity. Bull:Bear Z at -0.2 versus -0.54, Neutral.
The honest read: OBV is the one genuinely bullish signal here — accumulation trending and building. But the squeeze fired on futures-only divergence with spot volume falling while price rises, a Bear Cascade still running at 8 bars, and 8.4x futures dominance over spot. Leverage percentile at floor gives structural support but this move is not yet spot-confirmed. OBV Z needs to hold above 1.35 or spot Z needs to turn before this is a clean entry.
Is That Crypto Pump Real? Data Says No. Here's Why. / Stop Losing Money to Fake Volume. Find Real Moves Now. / Trade the REAL Crypto Volume. Stop Getting Faked Out.
Long
TACUSDT 25-02-26I tried to buy TACUSDT because I saw it had been trading sideways for a few days and was starting to rally. The increase in open interest could also support the reason for opening a long position.
Long
TAC short. Overbought on daily level.Coin with no future it was a pump and dump. short it from here and hate me later
Short
Scalp SHORT – TAC🐻 Scalp SHORT – TAC
TAC is showing clear signs of artificial price inflation, with candles ignoring major resistance levels — a typical signature of aggressive pump behavior. RSI is extremely overbought across all key timeframes, signaling an imminent momentum collapse. Such overstretched conditions often unwind rapidly into deep oversold territory as liquidity thins out.
Key Signals
Extreme overbought RSI on multiple timeframes
Price action violating resistance → unsustainable pump
High probability of sharp corrective breakdown
🎯 TP: 0.004443
🛡️ SL: 0.015613
📊 RR: 1 : 5.44
A clean, high-efficiency short setup driven by exhaustion and structural instability.
Short
Scalp LONG – TAC🐂 Scalp LONG – TAC
Price is holding firmly above the major support on the 15m and 1h timeframes, a zone that often triggers strong rebounds when selling pressure weakens. Price action shows slowing sell momentum and solid absorption at the lows—signs that a short-term recovery could form here. This is a “do or die” level: if support holds, TAC can bounce sharply.
🎯 Trade Setup:
TP: 0.005636
SL: 0.004367
RR: 1 : 3
A clean long setup: built on strong support, absorption signals, and a clear recovery expectation from the base.
Long
TACUSDT will go up if it exceed shown lineTACUSDT will go up if it exceeds the shown line. Analyse the chart pattern and trend and go for a long trade
Long
TAC/USDT – Base Support & Bullish Structure FormingIn August 2025, TAC/USDT established a solid base support at the 0.0083–0.0085 zone. Moving into September, this level has been repeatedly defended by buyers, confirming it as a key support zone.
Price action has since started to form a bullish structure, printing higher lows (HL) that signal growing momentum and accumulation. If this structure continues to hold, TAC could be gearing up for its next bullish leg.
Long
TAC/USDTKey Level Zone: 0.01280 - 0.01340
LMT v2.0 detected.
The setup looks promising—price previously trended upward with rising volume and momentum, then retested this zone cleanly. This presents an excellent reward-to-risk opportunity if momentum continues to align.
Introducing LMT (Levels & Momentum Trading)
- Over the past 3 years, I’ve refined my approach to focus more sharply on the single most important element in any trade: the KEY LEVEL.
- While HMT (High Momentum Trading) served me well—combining trend, momentum, volume, and structure across multiple timeframes—I realized that consistently identifying and respecting these critical price zones is what truly separates good trades from great ones.
- That insight led to the evolution of HMT into LMT – Levels & Momentum Trading.
Why the Change? (From HMT to LMT)
Switching from High Momentum Trading (HMT) to Levels & Momentum Trading (LMT) improves precision, risk control, and confidence by:
- Clearer Entries & Stops: Defined key levels make it easier to plan entries, stop-losses, and position sizing—no more guesswork.
- Better Signal Quality: Momentum is now always checked against a support or resistance zone—if it aligns, it's a stronger setup.
- Improved Reward-to-Risk: All trades are anchored to key levels, making it easier to calculate and manage risk effectively.
- Stronger Confidence: With clear invalidation points beyond key levels, it's easier to trust the plan and stay disciplined—even in tough markets.
Whenever I share a signal, it’s because:
- A high‐probability key level has been identified on a higher timeframe.
- Lower‐timeframe momentum, market structure and volume suggest continuation or reversal is imminent.
- The reward‐to‐risk (based on that key level) meets my criteria for a disciplined entry.
***Please note that conducting a comprehensive analysis on a single timeframe chart can be quite challenging and sometimes confusing. I appreciate your understanding of the effort involved.
Important Note: The Role of Key Levels
- Holding a key level zone: If price respects the key level zone, momentum often carries the trend in the expected direction. That’s when we look to enter, with stop-loss placed just beyond the zone with some buffer.
- Breaking a key level zone: A definitive break signals a potential stop‐out for trend traders. For reversal traders, it’s a cue to consider switching direction—price often retests broken zones as new support or resistance.
My Trading Rules (Unchanged)
Risk Management
- Maximum risk per trade: 2.5%
- Leverage: 5x
Exit Strategy / Profit Taking
- Sell at least 70% on the 3rd wave up (LTF Wave 5).
- Typically sell 50% during a high‐volume spike.
- Move stop‐loss to breakeven once the trade achieves a 1.5:1 R:R.
- Exit at breakeven if momentum fades or divergence appears.
The market is highly dynamic and constantly changing. LMT signals and target profit (TP) levels are based on the current price and movement, but market conditions can shift instantly, so it is crucial to remain adaptable and follow the market's movement.
If you find this signal/analysis meaningful, kindly like and share it.
Thank you for your support~
Sharing this with love!
From HMT to LMT: A Brief Version History
HM Signal :
Date: 17/08/2023
- Early concept identifying high momentum pullbacks within strong uptrends
- Triggered after a prior wave up with rising volume and momentum
- Focused on healthy retracements into support for optimal reward-to-risk setups
HMT v1.0:
Date: 18/10/2024
- Initial release of the High Momentum Trading framework
- Combined multi-timeframe trend, volume, and momentum analysis.
- Focused on identifying strong trending moves high momentum
HMT v2.0:
Date: 17/12/2024
- Major update to the Momentum indicator
- Reduced false signals from inaccurate momentum detection
- New screener with improved accuracy and fewer signals
HMT v3.0:
Date: 23/12/2024
- Added liquidity factor to enhance trend continuation
- Improved potential for momentum-based plays
- Increased winning probability by reducing entries during peaks
HMT v3.1:
Date: 31/12/2024
- Enhanced entry confirmation for improved reward-to-risk ratios
HMT v4.0:
Date: 05/01/2025
- Incorporated buying and selling pressure in lower timeframes to enhance the probability of trending moves while optimizing entry timing and scaling
HMT v4.1:
Date: 06/01/2025
- Enhanced take-profit (TP) target by incorporating market structure analysis
HMT v5 :
Date: 23/01/2025
- Refined wave analysis for trending conditions
- Incorporated lower timeframe (LTF) momentum to strengthen trend reliability
- Re-aligned and re-balanced entry conditions for improved accuracy
HMT v6 :
Date : 15/02/2025
- Integrated strong accumulation activity into in-depth wave analysis
HMT v7 :
Date : 20/03/2025
- Refined wave analysis along with accumulation and market sentiment
HMT v8 :
Date : 16/04/2025
- Fully restructured strategy logic
HMT v8.1 :
Date : 18/04/2025
- Refined Take Profit (TP) logic to be more conservative for improved win consistency
LMT v1.0 :
Date : 06/06/2025
- Rebranded to emphasize key levels + momentum as the core framework
LMT v2.0
Date: 11/06/2025
- Fully restructured lower timeframe (LTF) momentum logic
Long
#TAC/USDT Trade Setup. Huge Dip, 80% potential!TAC just dipped ~20% after the breakout, but multiple indicators still point to a bullish rally. Sentiment’s flying 85% voting up for bullish PA on cmc.
Also, mainnet went live July 15, pulled in $800 M TVL via “TAC Summoning,” landed on Bybit, Bitget, Kraken, Binance Alpha, with Morpho, Curve & Bancor already onboard.
Entry: 0.01633 / 0.01566 / 0.01485
Targets: 0.01855 / 0.01989 / 0.02066 / 0.02234 / 0.02455 / 0.02766 / 0.02988
SL: 0.01327
High‑risk, high‑reward—use small margin, manage your risk, and DYOR. Not financial advice.
#PEACE
Long