In-depth trading ideas
TAGUSDT Recovery Signal But OBV Already DriftingTAGUSDT at 0.00076012 with futures volume at 1.74B against 191.24M spot — a 9.1x futures-to-spot ratio. Dollar side at 1.32M futures versus 145.37K spot confirms the same imbalance. Spot is not leading this move.
Signal board at 35 green out of 112, Strong BULL 40.23% scoring 2.35x. EMA dominant at 10-0 and Ichi 9-3 provide the bullish backbone. C>T narrows to 8-6, candles dissent at 5-9, and DD/SS at 3-2 offers mild support. No squeeze firing. Momentum reading Bear up with BW at 59.35% Loosening — contraction unwinding but no explosive setup. Bear Cascade still active at 18 bars deep at 28.4%.
Spot Z -0.60 Quiet, Futures Z -0.69 Quiet, combined -0.69 Quiet across the board. SpotZ 0:5 trending at -0.60, -0.43, -0.17 falling — spot volume declining into this price area. Bull:Bear Z at -0.42 versus -0.47, Neutral. No whale activity, liquidations clear.
Leverage 9.09x elevated but declining. Percentile at 29.2% Lower — room for more leverage to load in. Price at 71.5% of range Mid, sitting well above the all-time min zone. AT Max was 31.11x just 84 bars ago — leverage unwind still fresh.
OBV Z at 0.43 but the 0:5 window tells the real story — 0.43, 0.43, -0.01 Drift down. Accumulation flatlined and OBV Divergence explicitly showing Bear Div. On-balance volume is not confirming the bullish signal count. Retrace deep at 24.4% with bounce potential at 42.9% 1.8x Recovery tagged but OBV has to turn before that plays out.
The honest read: Structure is bullish on paper — EMA clean, Ichi solid, bounce level identified. But OBV Bear Div with a drifting 0:5 trend, 9x futures dominance over spot, Bear Cascade 18 bars in, and momentum loosening not exploding means this is a recovery watch not an entry. Wait for OBV Z to cross back above 0.5 with spot Z confirming before sizing in.
Is That Crypto Pump Real? Data Says No. Here's Why. / Stop Losing Money to Fake Volume. Find Real Moves Now. / Trade the REAL Crypto Volume. Stop Getting Faked Out.
TAG Consolidating Above Key Support After Impulsive BreakoutTAG recently printed a strong impulsive move to the upside after breaking above the previous consolidation structure. Following this expansion, price is now stabilizing around the 0.00046–0.00048 resistance zone, which has become the immediate decision area.
The market is currently holding above the ascending trendline support, showing that buyers are still defending higher lows. This structure suggests the market may be forming a bullish continuation consolidation before the next expansion.
If price continues to hold above the 0.00039 support and trendline, the structure favors continuation toward 0.00049, with a breakout potentially opening the path toward 0.00056.
However, if the trendline support fails and price loses 0.00039, a deeper pullback toward the 0.00038–0.00036 retracement zone becomes possible before the next attempt higher.
For now, TAG remains in a post-breakout consolidation phase, and holding the rising support keeps the bullish continuation scenario intact.
TAGUSDT plan 12-02-26TAGUSDT plan 12-02-26
The price is already in the supply area, currently moving sideways. In that area,
we'll try setting a sell limit in that area, at the top.
Since there are no signs of rejection yet, the price will likely move sideways for a while. Then, we'll wait for a rejection candle or bearish engulfing candle to appear.
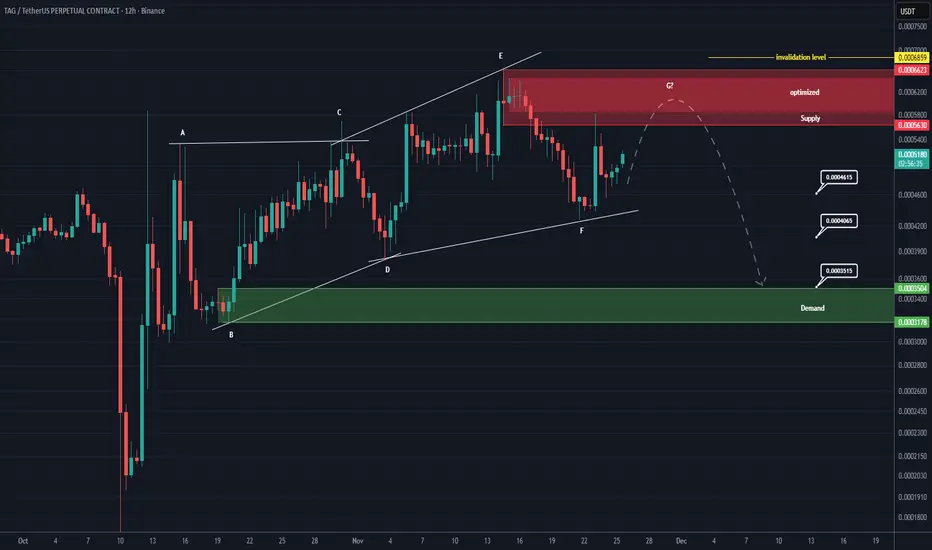
TAG Analysis (12H)Before anything else, please note that this coin has high volatility.
This coin is completing a bullish structure. The pattern is a bow-tie diametric, and we are currently in its G wave.
In the red zone, the G wave is expected to finish, and we anticipate a drop.
In the red zone, we will be looking for sell/short positions.
Targets are marked on the chart.
A daily candle closing above the invalidation level will invalidate this analysis.
For risk management, please don't forget stop loss and capital management
When we reach the first target, save some profit and then change the stop to entry
Comment if you have any questions
Thank You
TAG Analysis (4H)After the bearish CH and the loss of the trendline, it seems that TAG has entered a bearish phase.
On the chart, we have marked the supply and demand zones as the key areas for positioning. When entering a position, make sure to apply proper risk management and set a stop loss.
In the red zone we look for sell/short positions, and in the green zone, we look for buy/long positions
For risk management, please don't forget stop loss and capital management
When we reach the first target, save some profit and then change the stop to entry
Comment if you have any questions
Thank You