Will $TEL ready for next 400% Upward Rally?NYSE:TEL 50,000% HISTORY. 98% CRASH. NOW THE SAME HTF SUPPORT IS SPEAKING AGAIN.
NYSE:TEL is showing a potentially important HTF market-structure transition after another ~90% correction from the Feb 2025 high.
What makes this setup interesting is the reaction from the same major support trendline that has held since Jan 2021.
HISTORICAL EXPANSION CYCLE
1️⃣ Dec 2020 → May 2021: ~50,000%+
2️⃣ Jan 2021 Breakout → 4-Month Expansion: ~14,524%
3️⃣ Oct 2023 → Mar 2024: +550%+
4️⃣ Sep 2024 → Feb
In-depth trading ideas
Telcoin on FIRETelcoin is exiting Wyckoff's 3-year accumulation range and starting phase D, as well as starting wave 5. This case is one of the most solid charts within the whole cryptoverse. We are witnessing the biggest generational opportunity.
Given that the Telcoin team is delivering on their promises in 2027, we are highly likely to exceed the TA price targets.
Disclaimer: This is not financial advice.
Telcoin: preparing for a pullback? key levels to watchTelcoin
Anyone else watching this little sleeper while the market rotates back into small caps? According to industry sources, money has been creeping back into micro-cap altcoins after the recent BTC volatility, and today TEL already reacted with a sharp push straight into a heavy 4H supply zone. That first touch into resistance with hype returning is exactly where I start paying close attention.
On the 4H chart, price just wicked into the red supply block and stalled while RSI cooled off f
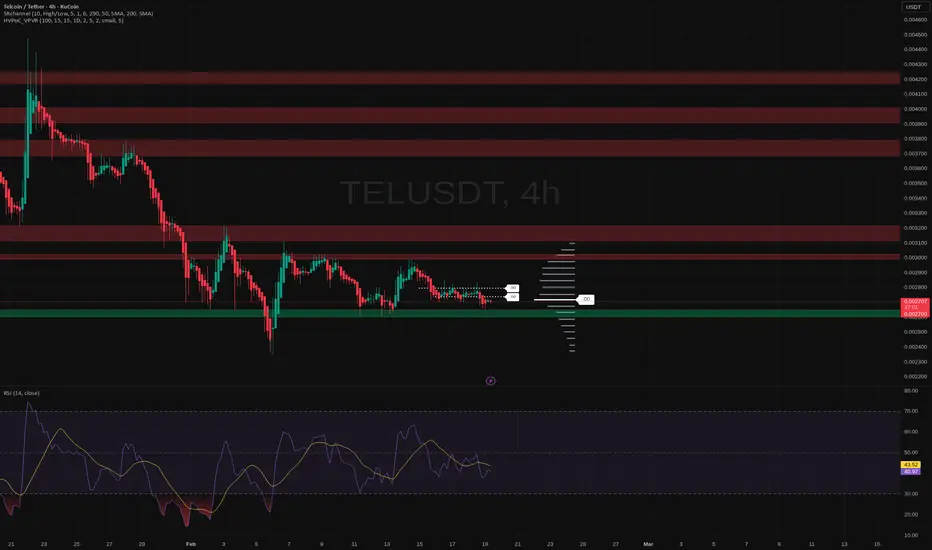
Telcoin: poised for a breakout? key levels and targets aheadTelcoin. Tired of watching this thing crab along support and do nothing? While majors swing around on macro headlines, Tel is quietly sitting on a big 4H demand block, and according to market chatter, smaller caps like this are back on the radar as rotation targets once volatility cools in the leaders. Bored charts often become explosive charts.
On the 4H chart price is hugging that green support zone around 0.00265-0.00270, with several failed pushes below and a chunky volume node just above
$TEL / USDT – 12H | Trend Shift in Play - take action Now TEL has completed a macro swing failure at ~0.00255 and is now printing higher highs + higher lows, signaling a structural trend shift.
🔹 Key Levels
• Support / Reclaim: 0.0032–0.0034
• Macro Pivot: 0.0070 → reclaim & hold confirms trend continuation
• Major Supply: 0.0045–0.0049 (first reaction zone)
🔹 Bullish Scenario
• Acceptance above 0.0049 opens the path to 0.0070
• Clean break & hold of 0.0070 = range invalidation → trend mode
🎯 Upside Targets
• 0.0075–0.0080 (macro pivot expansi
Macro Breakout Scenario — 0.007 ReclaimTEL is coiling under resistance after a strong higher low at 0.00385.
Momentum is flipping bullish and price is holding above short-term EMAs.
This looks like pressure building, not distribution.
Key level:
🔥 Break & close above 0.00415 = continuation
Targets:
🎯 0.00450 → 0.00490 (major supply zone)
As long as price holds above 0.00385, bias stays bullish.
A clean 4H breakout could move fast.
Watching for expansion.
TELUSD | Macro Breakout Scenario — 0.007 Reclaim 🔥
If TEL reclaims and ho
$TELUSDT is going to explode, soonTwo possible scenarios for #TEL:
- A: we are going to break the resistance within a week or 2, or
- B: it is going to re-test the area of $0.0017 before going up and then break the resistance.
One thing is sure, NYSE:TEL is going to blast, great project, great team.
The Telcoin Explosion Starts Now!Telcoin reminds me of the early days of the Bitcoin cycle. I see strong potential for a massive pump coming soon. When cycles are this undervalued—when the community is strong, the fundamentals are solid, and the chart looks amazing—almost nothing can stop a parabolic run from happening.
As always, stay profitable.
– Dalin Anderson
Major Level in Play: $TEL/USDT at Make-or-Break ZoneTEL/USDT is currently trading just above a key support zone, a level that previously acted as resistance.
The price structure is showing signs of improvement, but the descending resistance line above is still a strong hurdle for any continued upside.
This lower support zone remains critical, if price fails to hold this level, we could see further downside pressure.
Keep a close eye on this zone for potential bounce or breakdown confirmation.
DYOR, NFA
#PEACE
Telusdt Buy opportunitySpotted a potential ascending formation with price currently developing a mini bullish flag. This structure suggests an underlying accumulation phase ahead of a potential breakout.
The strategic focus is the Buy Back Zone, a key area for strong accumulation entries. Targets are clearly mapped on the chart, with 0.009896 as the first short-term objective, followed by 0.061317.
The final critical area to monitor is the Crucial Resistance Zone, acting as the neckline of the entire setup—its bre
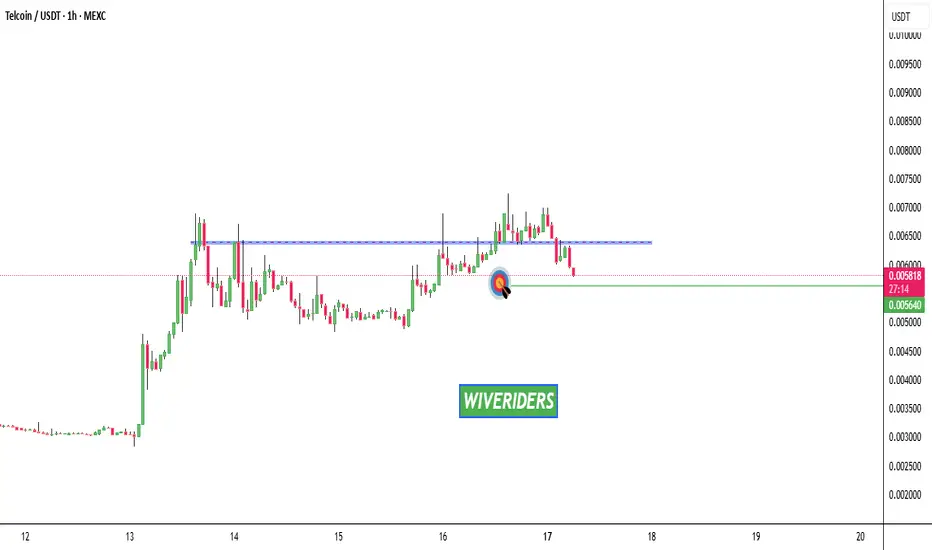
TEL short term to $0.0057 resistance⚡️ NYSE:TEL broke out of the Flag pattern, snatched up the liquidity and broke through multiple short-term resistances between $0.0044 to $0.0052. Finding resistance at $0.0053.
⚡️It is currently retracing down to the 0.382 fib level and the $0.005 psychological resistance that has now become support.
⚡️ NYSE:TEL momentum has increased/sped up as seen by it moving faster than the recent blue bars pattern. I mentioned this in a post two days ago.
TEL Short Term Bull Scenario
🟢$0.0053 is
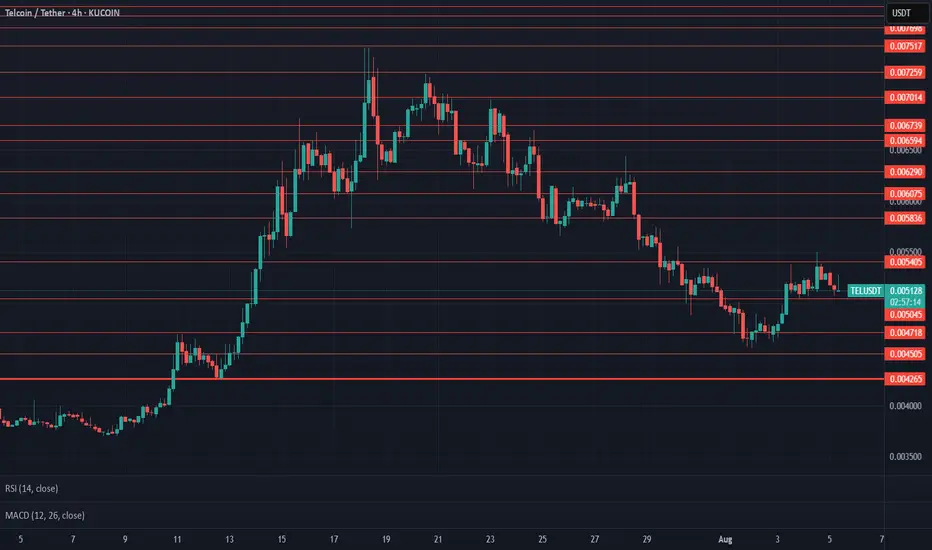
$TEL UpdateNYSE:TEL at $0.004580 support area, moving with #Bitcoin, $0.004928 current resistance, $0.005192 key resistance area to exit and get back above $0.0050, been under $0.005192 resistance since March 29. On 1D time-frame showing potential for more price decline with declining volume and slight incline on MACD. Bearish engulfing forming on current 4H, and 1D with bullish pin bar but no follow up, high influence of CRYPTOCAP:BTC 's movement here. $0.004505 next support area. $0.004265-$0.004165 su
TELUSDT Trading ideaTELUSDT is exhibiting a breakout above a potential falling wedge formation, indicating a bullish reversal signal.
The price appears to be aiming to complete the final leg of its corrective wave, suggesting a pullback towards the accumulation zone as part of the broader retracement structure. The price path suggests the immediate resistance level as a critical area to monitor.
Should price face rejection at this resistance, it could trigger a downward move, potentially retesting lower levels