THETA / THETAUSDT Long Setup | Breaker Block ReclaimMARKET ANALYSIS
THETA is currently reacting from a key technical area highlighted on the chart.
As long as the protected support zone remains intact, the bullish market structure remains valid and higher liquidity targets may continue to attract price action.
A breakdown below the invalidation level would weaken the current bullish scenario and require a reassessment of market conditions.
📍 Entry, Stop Loss and Take Profit levels are marked directly on the chart.
━━━━━━━━━━━━━━
⚠️ DISCLAIMER
This publication is provided solely for educational and market observation purposes.
Nothing contained in this analysis should be considered financial advice, investment advice, or a recommendation to buy or sell any financial instrument.
All trading and investment decisions remain solely the responsibility of the individual trader.
Always conduct your own research and apply proper risk management before entering any position.
━━━━━━━━━━━━━━
🎯 PARALOG
▪️Crypto Market Analysis
▪️BTC Futures Signals
▪️Bitcoin & Altcoin Market Analysis
Precision • Momentum • Timing
━━━━━━━━━━━━━━
Exchange: #MEXC Futures
#bitcoin #btc #crypto #futures #technicalanalysis
In-depth trading ideas
thetausdt long Roddy01-SIGNALSPROVIDERInstructions:
Entry point: yellow
Stop loss: red
Take profit: green
👉Leverage x 5-10-20 for crypto
👉Leverage x 20-50-100 for commodities, stocks, indices, and forex
👉Margin 1-5% max.
Always practice risk and money management.
Invest a maximum of 5% on any trade or across all your trades.
Invest only what you can afford to lose, as no one is in control of the market.
👉Our analyses are primarily based on:
breakouts: two trend lines (ascending and descending) and a line indicating a horizontal breakout.
chart patterns: shoulders and head, triangle parttern, elliott impulse, etc etc.
We don't always have the time to track them at all times or to represent them visibly, given the numerous signals, the number of channels to manage, and especially because of the often rapid pace of market movements.
indicators: We associate at least two indicators with this technique.
👉Depending on the circumstances, we use specific indicators, often setting 3 or more take profit levels.
👉Indeed, there are good days in trading and also bad days. No one can promise to win every trade, and like all traders worldwide, we also experience stop-loss orders. However, we win more than we lose and remain positive.
👉You can close the position before or after the take profit orders indicated by the green lines if you are personally satisfied; the same applies to stop loss orders.
👉We must stay positive, clear-headed, and humble.
we cannot provide all instructions or all trades here on this channel.
Good luck to us all, and may God guide us. Amen.
THETA at macro floor: base recovery toward $0.18The Macro Picture 🗺️
THETA flushed from the $0.24–0.26 highs down into the $0.125 macro floor, then stopped bleeding. Price is now grinding sideways just above support, with RSI curling back up through 50 — the classic sign that sellers are exhausted and a base is forming.
The Setup ⚙️
The Accumulation Zone 🟢
$0.125–0.13 is where the selling dried up. Every push lower got bought back. This is the demand shelf the recovery is building from.
The Decision Point 🔴
$0.16 (Local High) is the first real test. Reclaiming it flips the local structure bullish and opens the door to the macro ceiling.
The Roadmap 🛣️
Hold above $0.125 → base above equilibrium at $0.148 → break $0.16 → run toward the $0.18 macro resistance. Invalidation is a clean daily close below $0.125 — that voids the accumulation thesis.
This is a textbook DCA Accumulation Zone setup: scale in across the $0.125–0.148 band, let the base do the work.
More setups in profile.
#THETA #Theta #crypto #trading #TA #3Commas #DCA
THETA will crash 95%+ and provide an EXCELLENT entry SUB $1THETA's goose is about to be cooked in tandem with Bitcoin retracing back to AT LEAST 20K area. Could THETA have one last surge? - yes of course, but with Bitcoin cliff-walking and Ethereum going parabolic it looks like this chapter of the show will be over soon enough. THETA has been a big hitter but what goes up must come down and price is looking corrective. Target for entry is currently sub $1.
THETAUSDT - Bear Flag, Potential Continuation of the Downtrend?On the 4H timeframe, THETAUSDT Perpetual remains in a well-defined downtrend. 📉 After experiencing a sharp decline (Flagpole), the price is now moving in a consolidation phase, forming a classic 🐻 Bear Flag pattern.
📚 The Bear Flag is a bearish continuation pattern that typically develops after a strong sell-off. The current consolidation within a slightly upward-sloping channel suggests that buying pressure is gradually weakening, while sellers continue to dominate the market. ⚖️
🔻 As long as the price remains inside the Bear Flag and fails to break above the upper resistance trendline, the overall market bias remains bearish.
---
📐🐻 Bear Flag Pattern Explanation
🔻 Flagpole
📉 Formed by the previous sharp decline, highlighting strong bearish momentum and seller dominance.
📈 Flag (Upward Consolidation)
🔹 Price is consolidating inside a small ascending channel.
🔹 Volume and volatility have decreased, indicating a temporary pause before a potential continuation of the prevailing downtrend.
✅ Bearish Confirmation
📍 A strong 4H candle closes below the Bear Flag support.
📊 Increased selling volume during the breakdown would significantly strengthen the bearish continuation scenario.
---
🐻📉 Bearish Scenario
⚠️ As long as the price fails to break above the Bear Flag resistance, the downside remains the dominant scenario.
🎯 Key support levels to monitor:
🟡 First Support: 0.1290
🟡 Next Support: 0.1275
🚨 If both support levels are broken with a strong 4H candle close, the price could continue its decline toward:
🎯 Primary Bearish Target: 0.1220
📉 A confirmed breakdown from the Bear Flag would validate the continuation of the existing bearish trend, consistent with the characteristics of a continuation pattern.
---
🟢🚀 Bullish Scenario
💡 The bullish scenario will only gain confirmation if the price can:
✅ Break above the Bear Flag resistance.
✅ Close with a strong 4H bullish candle.
✅ Be supported by a noticeable increase in buying volume. 📊
🚀 If the breakout is sustained, selling pressure may weaken, allowing the market to stage a relief rally toward higher resistance levels.
⚠️ However, until a confirmed breakout occurs, any upward movement should still be considered a pullback within the broader downtrend.
---
📌⚖️ Conclusion
📉 The overall 4H market structure remains bearish. The formation of a 🐻 Bear Flag suggests that the current consolidation is likely a temporary pause before the market determines its next directional move.
🚨 A breakdown below the 0.1290–0.1275 support zone would serve as a major confirmation for a continuation toward the 0.1220 target.
🟢 On the other hand, a breakout above the Bear Flag resistance would invalidate the bearish setup and open the door for a short-term recovery.
> ⚠️ Always wait for a confirmed breakout or breakdown before entering a trade, and never forget to apply disciplined risk management. 📊💼
#THETA #THETAUSDT #Crypto #Cryptocurrency #TechnicalAnalysis #PriceAction #BearFlag #Bearish #Downtrend #Support #Resistance #Breakdown #Altcoins #CryptoTrading #Futures #MarketAnalysis #RiskManagement #ChartAnalysis
Thetausdt short Instructions:
Entry point: yellow
Stop loss: red
Take profit: green
👉Leverage x 5-10-20 for crypto
👉Leverage x 20-50-100 for commodities, stocks, indices, and forex
👉Margin 1-5% max.
Always practice risk and money management.
Invest a maximum of 5% on any trade or across all your trades.
Invest only what you can afford to lose, as no one is in control of the market.
👉Our analyses are primarily based on:
breakouts: two trend lines (ascending and descending) and a line indicating a horizontal breakout.
chart patterns: shoulders and head, triangle parttern, elliott impulse, etc etc.
We don't always have the time to track them at all times or to represent them visibly, given the numerous signals, the number of channels to manage, and especially because of the often rapid pace of market movements.
indicators: We associate at least two indicators with this technique.
👉Depending on the circumstances, we use specific indicators, often setting 3 or more take profit levels.
👉Indeed, there are good days in trading and also bad days. No one can promise to win every trade, and like all traders worldwide, we also experience stop-loss orders. However, we win more than we lose and remain positive.
👉You can close the position before or after the take profit orders indicated by the green lines if you are personally satisfied; the same applies to stop loss orders.
👉We must stay positive, clear-headed, and humble.
we cannot provide all instructions or all trades here on this channel.
Good luck to us all, and may God guide us. Amen.
THETA Holding Key Demand ZoneTheta Token (THETA/USDT) is currently approaching a well-defined demand zone around 0.2040 – 0.2100, which has been acting as short-term support.
The broader structure shows a descending trendline with price compressing toward the support zone, indicating a potential accumulation phase. Multiple rejections from this region suggest buyers are defending this level.
Key Observations:
Strong horizontal support in the 0.2040 – 0.2100 region
Descending trendline indicating compression
RSI near lower levels, leaving room for upside
Price approaching decision zone
Trade Setup:
Entry Zone: 0.2040 – 0.2100
Stop Loss: 0.2021
Targets:
0.2142
0.2229
0.2286
0.2369
0.2439
0.2560
Outlook:
As long as the support zone holds, the probability favors a bounce toward higher resistance levels. A breakout above the descending trendline would further strengthen bullish momentum.
A breakdown below 0.2021 would invalidate the setup.
NFA | DYOR
Theta | 4hr Chart | April 2026** T.A explained **
Basics:
Ranges = two or more consecutive color candles.
There are two types of ranges - accumulation and distribution.
A single candle is a range on a lower timeframe. We only look at the first and last candle in each range.
DISTRIBUTION RANGES DEFINED: BackSide (BS) Candle - First distribution candle in a distribution range. Expectation = strong reaction to price. long wicks reaching to or away from level.
FrontSide (FS) Candle - Last distribution candle in a distribution range. Expectation = reversal, create a trend in the opposite direction. Distribution candles are used as support.
ACCUMULATION RANGES DEFINED:
Inverse BS (Inv.BS) - First Accumulation candle in an accumulation range. Expectation. = strong reaction to price. long wicks reaching to or away from level.
Inverse FS (Inv.FS) - Last accumulation candle in an accumulation range. Expectation = reversal, create a trend in the opposite direction. Accumulation candles are used as resistance.
Horizontal Ray tool on BS & FS levels are default support levels when dashed lines, tested when dotted lines and resistance when solid lines.
Horizontal Ray tool on Inverse BS & Inverse FS levels default as resistance and shown with a dashed line, tested when 1x dotted line, and support when solid line.
The inverse is true for the Inv. BS Inv. FS levels, they are resistance as dashed lines, tested as dotted and support as solid lines.
Monthly timeframe is color pink
weekly grey
daily is red
4hr is orange
1hr is yellow
15min is blue
5min is green if they are shown.
strength favors the higher timeframe.
THETAUSDT 1D#THETA is trading within a falling wedge pattern on the daily chart and is currently holding the daily SMA50. Consider accumulating a small position at current levels and near support zones. In case of a confirmed breakout above the wedge resistance and the Ichimoku Cloud, the potential targets are:
🎯 $0.196
🎯 $0.229
🎯 $0.256
🎯 $0.283
🎯 $0.321
🎯 $0.370
⚠️ Always remember to use a tight stop-loss and maintain proper risk management.
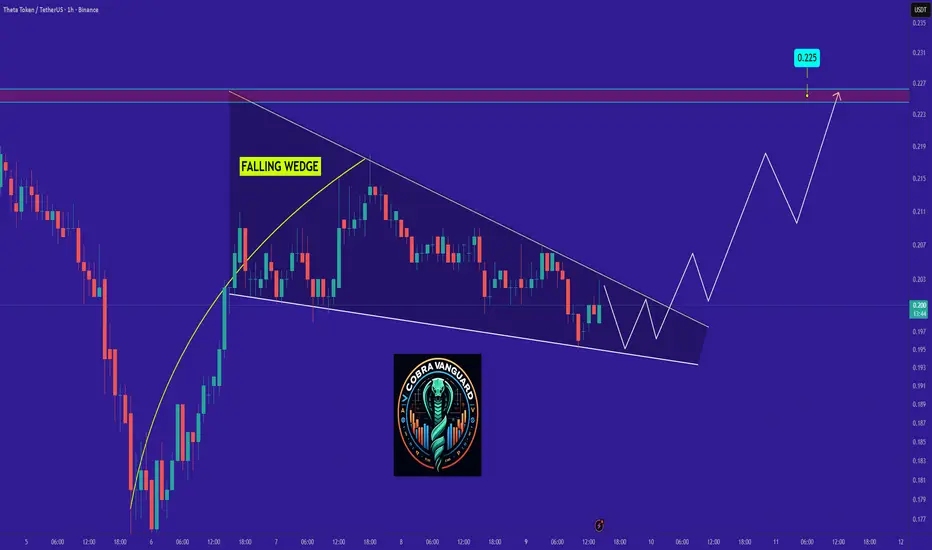
THETAUSDT Forming Falling WedgeTHETAUSDT is forming a clear falling wedge pattern, a classic bullish reversal signal that often indicates an upcoming breakout. The price has been consolidating within a narrowing range, suggesting that selling pressure is weakening while buyers are beginning to regain control. With consistent volume confirming accumulation at lower levels, the setup hints at a potential bullish breakout soon. The projected move could lead to an impressive gain of around 240% to 250% once the price breaks above the wedge resistance.
This falling wedge pattern is typically seen at the end of downtrends or corrective phases, and it represents a potential shift in market sentiment from bearish to bullish. Traders closely watching THETAUSDT are noting the strengthening momentum as it nears a breakout zone. The good trading volume adds confidence to this pattern, showing that market participants are positioning early in anticipation of a reversal.
Investors’ growing interest in THETAUSDT reflects rising confidence in the project’s long-term fundamentals and current technical strength. If the breakout confirms with sustained volume, this could mark the start of a fresh bullish leg. Traders might find this a valuable setup for medium-term gains, especially as the wedge pattern completes and buying momentum accelerates.
✅ Show your support by hitting the like button and
✅ Leaving a comment below! (What is your opinion about this Coin?)
Your feedback and engagement keep me inspired to share more insightful market analysis with you!
Theta Token Long-term (2,900% - 8,400% Profits Potential)After the 2021 all-time high, OriginToken (OGN) and Theta Token (THETA) are the same. Two bear markets with a small pause in-between.
The 2023-2025 period produced lackluster, weak growth due to the political environment in the USA around Crypto. The previous administration was against Crypto as well as trying to shut down the market. This caused an incredibly high amount of uncertainty, pressure, suffering and pain. Many companies went under, many exchanges closed while others were shut down through massive force. All the energy, all the capital, all the attention went to Bitcoin as it was the only safe place.
Things are different now. All these detrimental factors are no longer present. Crypto can now express itself freely as it is no longer being suppressed. This is cause for celebration and a strong bullish signal for the altcoins market.
OGN grew around 3,000% in 2021, less than four months. THETA grew 45,550% in 399 days. March 2020 through April 2021. Huge difference, a very strong variation.
Both projects are trading at bottom prices and both projects are set to grow.
Both charts are the same with the main difference being the size of the previous bull market.
THETAUSDT is trading at bottom prices, the lowest since May 2020 with a falling wedge present on this chart. No volume. A bearish move that is overextended. Here we can see the start of long-term growth.
Theta Token can grow for years, or it can complete an entire cycle in several months. It is likely that we will witness sustained long-term growth. There is nothing negative to stop a long-term bull market.
Any type of scare can produce a correction but nothing more. Crypto already went through the worse; now, the best is yet to come.
Namaste.
Theta: bounce back or deeper drop? key levels to watch todayTheta Token – ready for a dead‑cat bounce or the start of a real reversal? Lately Theta’s been dumped together with the broader altcoin market, while industry chatter is all about liquidity rotating back into majors and away from small caps. Today we finally see a green 4H candle after a long bleed and some traders are clearly trying to bottom‑fish this thing.
On the 4H chart, price is sitting around 0.16 after a sharp selloff into a demand pocket, with RSI deeply oversold and starting to curl up – classic conditions for at least a corrective move. I’m leaning short‑term bullish: think relief rally back into the nearest volume nodes around 0.17 and then 0.18 where that thick red supply zone starts. Sellers have controlled every bounce so far, but if fresh news sparks any narrative for Theta, this low‑liquidity zone can pop fast.
My plan: scalp longs while we hold above the recent wick low; first take‑profit near 0.17, extended target 0.18 where I expect heavy profit‑taking. If 0.158 breaks convincingly, I step aside – that would reopen the door for another leg down toward previous lows. I might be wrong, but fading extreme fear at key levels has paid my bills more often than chasing green candles. ✅
Theta: bounce or breakdown? key levels to watch todayTheta Token – ready for a dead‑cat or a real bounce from here? Altcoins are still sluggish as the market digests the latest macro chatter and flows back into the majors, and Theta has quietly slid back into the same demand zone that launched the last reaction move. No big fresh headlines today, so price is doing the talking.
On the 4H chart, we’re parked right in that thick orange support band around 0.18–0.19, with a chunky volume node sitting just above at 0.20–0.21. RSI is hovering in the low 30s and trying to curl up, which tells me sellers are getting tired into support rather than aggressive at the lows. I’m leaning toward a bounce long from this area toward the nearest red resistance blocks.
My base plan: ✅ accumulation in the orange zone with targets at the 0.20 POC and then 0.215–0.225 if momentum wakes up. Invalidated if we get a clean 4H close below 0.18 – in that case, I’d expect a flush toward the next low‑volume pocket and would rather step aside than knife‑catch. I might be wrong, but fading clear levels like this has never been kind to my PnL.
THETA/USDT Road to 1$ THETA/USDT has spent an extended period in a corrective and consolidation phase and is now showing clear signs of macro accumulation. Price action is stabilizing above key demand, suggesting the market is preparing for a strong expansion move, with a +100% upside leg becoming increasingly probable once momentum confirms.
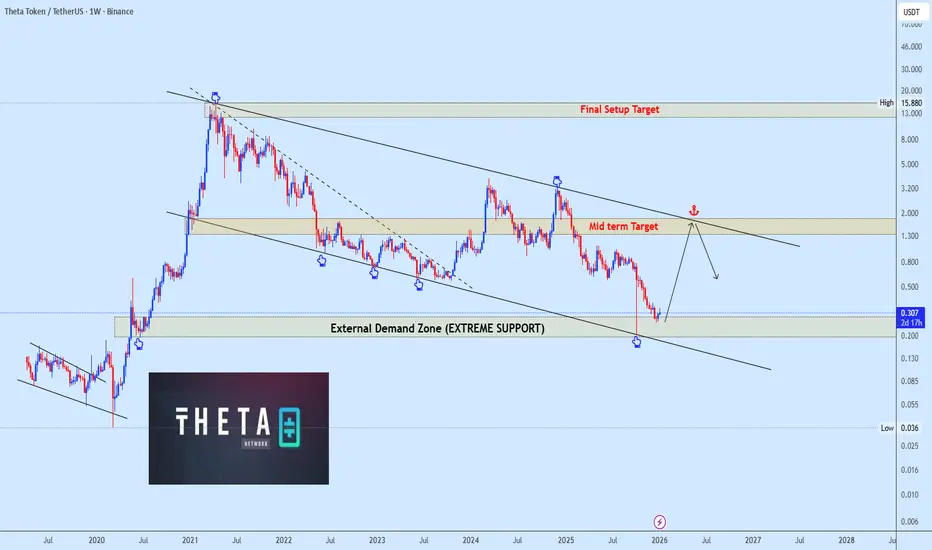
$THETA Holding Strong at Extreme Support – Reversal Incoming?After years in a multi-year descending channel, #THETA is holding strong at the External Demand Zone (Extreme Support) around $0.20–$0.30.
The setup points to a potential reversal:
1. Mid-term target: $1.30
2. Final setup target: $15–$18 (channel top projection)
Bullish breakout above the trendline could confirm massive upside. Watching for accumulation here!
Theta long-term analysis.Today, I take a look at a long-term analysis of Theta, comparing it to Amazon. I believe Theta will perform very well in the big picture. I see it following a major upward trend similar to Amazon’s. However, it could happen much faster than shown on this chart—be ready for big things in this market.
As always, stay profitable.
– Dalin Anderson
Get Ready for a Strong Recovery on Theta in the Near Future! I believe Theta will see a strong recovery very soon based on this ABC correction, the same pattern BCH experienced. This will lead to a sharp recovery and a strong bullish move in the near future. It could be very profitable and mark the beginning of a massive run for this coin in the bigger picture. Theta is heavily undervalued and ready for big things.
As always, stay profitable.
– Dalin Anderson
THETAUSDTDetailed Analysis
1. Market Phases
Parabolic Uptrend (Bull Market): The chart begins on the far left with a massive and rapid price increase. The long green candles indicate intense buying pressure that drove the price from well below $0.20 to a peak of nearly $16.00.
Major Downtrend (Bear Market): Following this peak, THETA entered a severe and protracted bear market. The price fell consistently for over a year, marked by a series of lower highs and lower lows. This demonstrates a long period where sellers were in complete control.
Consolidation/Accumulation Phase: For a significant portion of the chart (from mid-2022 onwards), the price has been trading in a relatively tight sideways range, primarily between approximately $0.50 and $1.50. This long period of sideways movement after a major downtrend often signifies that the bearish momentum has exhausted. This could be an accumulation phase, where long-term investors are gradually buying, or it could simply be a pause before further downside.
2. Key Price Levels
All-Time High (Major Resistance): The peak price, near $16.00, is the ultimate long-term resistance. It would take a monumental shift in market dynamics to retest this level.
Major Support Level: The price of approximately $0.425 (indicated by the dashed horizontal line) appears to be a critical long-term support level. While the price has wicked slightly below it, it has not closed below this level on a weekly basis, suggesting this is a strong floor.
Consolidation Range Resistance: The price has been rejected multiple times from the $1.20 - $1.50 area. This zone now acts as a significant resistance for any short-to-medium-term bullish rally.
Current Price: The current price is $0.743. It is trading in the lower half of its long-term consolidation range, closer to its major support than its range resistance.
3. Technical Indicators
Moving Average (The Green Line):
During the bull run, the price stayed firmly above it.
During the bear market, it acted as a dynamic resistance, with the price consistently staying below it.
In the current consolidation phase, the price is frequently crossing it, indicating a lack of a clear trend. Currently, the price is slightly below the moving average, suggesting some minor bearish pressure in the short term.
Volume (Not Pictured, but Implied): Typically, a parabolic top is formed on extremely high volume, which then tapers off during the downtrend. The consolidation phase usually sees very low volume, which would pick up significantly on a breakout in either direction.
Potential Future Scenarios
Bullish Case: A sustained weekly close above the consolidation resistance (around $1.50) would be a strong bullish signal. This could indicate the end of the long-term downtrend and the beginning of a new major uptrend. The first major target after such a break would likely be the $3.00 - $3.50 area, which acted as a previous support/resistance level.
Bearish Case: A breakdown and weekly close below the major support level at $0.425 would be a very bearish sign. This would invalidate the idea that a bottom has been formed and could lead to significant further downside, as there would be no clear support levels left from this historical data.
Neutral Case (Most Likely in Short-Term): The most probable scenario in the immediate future is a continuation of the sideways price action. THETA could continue to trade between the $0.50 support and the $1.20 resistance until a major market catalyst forces a breakout in one direction.
Disclaimer: This technical analysis is for informational purposes only and is not financial advice. The cryptocurrency market is extremely volatile, and past performance is not indicative of future results.
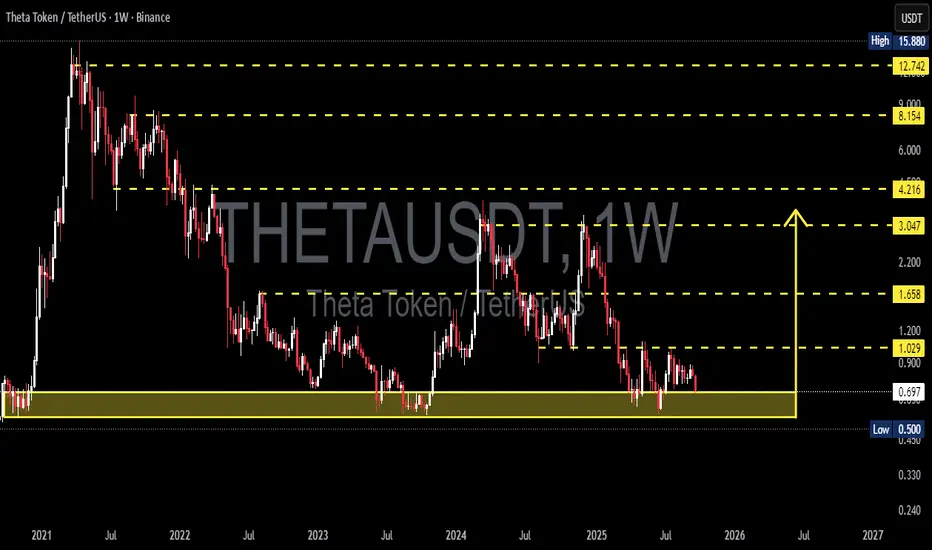
THETA/USDT — Demand Zone Retest: Strong Rebound or Breakdown?📌 Overview
THETA is currently trading at a critical decision point, sitting right inside the multi-year demand zone of $0.50–$0.75, with the price hovering around $0.694. This area has acted as a strong base since 2021, and the next move will determine whether THETA is gearing up for a major rebound or facing another leg down in its prolonged bearish trend.
---
🔹 Structure & Pattern Analysis
Macro Trend: Since hitting the all-time high of $15.88 in 2021, THETA has consistently formed lower highs, showing a dominant bearish structure.
Key Demand Zone: The $0.50–$0.75 range has acted as a long-term floor for more than 3 years.
Chart Pattern: The structure resembles a descending triangle (flat support with lower highs), a pattern that usually favors breakdowns — though invalidation remains possible with a confirmed breakout to the upside.
Accumulation Hints: Decreasing sell volume during each retest of the demand zone suggests seller exhaustion and potential long-term accumulation.
---
🔹 Bullish Scenario
1. Strong Rebound From Demand Zone
If THETA holds above $0.50–$0.75 and prints a strong bullish weekly candle (hammer or engulfing), it may signal accumulation strength.
2. First Confirmation:
A weekly close above $1.03 (immediate resistance) → signals that buyers are regaining control.
3. Upside Targets:
Target 1: $1.66
Target 2: $3.05
Target 3: $4.22
Breaking higher could extend toward $8.15 – $12.74, and possibly retest the ATH at $15.88 in the long run.
4. Momentum Validation:
RSI reclaiming >50 + MACD bullish cross would strengthen the bullish case.
---
🔹 Bearish Scenario
1. Confirmed Breakdown Below $0.50
A weekly close below $0.50 would confirm a bearish continuation and invalidate the demand zone.
2. Failed Retest:
If the price retests $0.50–$0.55 and fails to reclaim, it could trigger accelerated selling pressure.
3. Downside Targets:
Target 1: $0.33
Target 2: $0.24 (multi-year bottom)
4. Risk:
A breakdown below $0.50 may cause capitulation, with long-term holders potentially exiting positions.
---
🔹 Trading Strategy & Risk Management
Long-Term Investors (DCA): Gradual accumulation within $0.50–$0.75, with a conservative stop loss below $0.45.
Swing Traders: Enter long after a confirmed breakout and weekly close above $1.03, targeting $1.66+.
Bearish Traders: Short setups become valid if weekly closes below $0.50, with targets toward $0.33–$0.24.
Risk Control: Always apply stop losses. Maintain a minimum risk-to-reward ratio of 1:2 before entering.
---
🔹 Conclusion
THETA is standing at a make-or-break zone.
As long as it holds above the $0.50–$0.75 demand zone, the potential for a major rebound remains alive, especially if $1.03 is broken to the upside.
However, a weekly close below $0.50 would confirm a bearish continuation, opening the path to new lows.
The upcoming weekly closes will be decisive — the next candles could shape THETA’s direction not just for months, but potentially for years.
---
#THETA #Crypto #Altcoin #TechnicalAnalysis #PriceAction #SupportResistance #Breakout #Breakdown #CryptoTrading