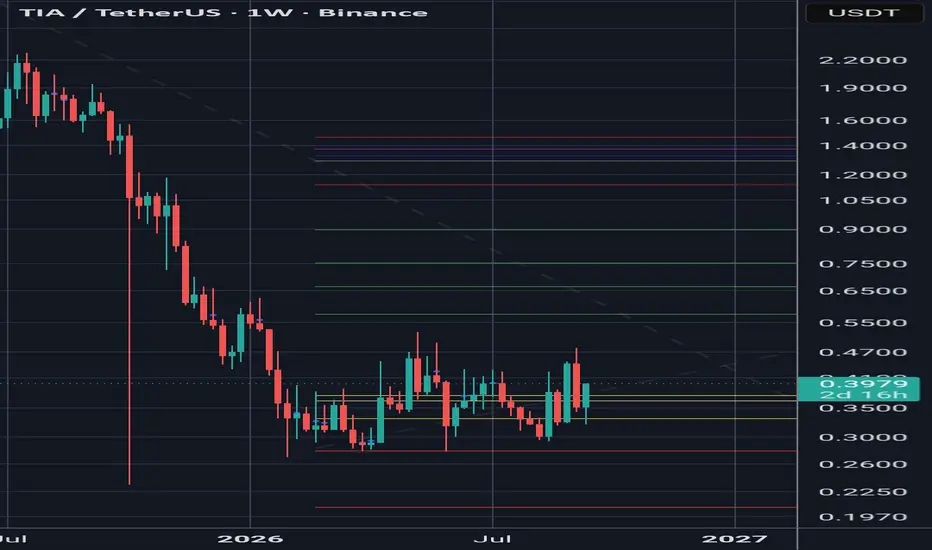
TIA/USDT (1D) — Macro Accumulation Base & Descending Trendline BMarket Structure & Technical View:
Celestia (TIA) has shown strong signs of base completion after an extensive multi-month downtrend from its 2024 highs. Price action has consolidated along a long-term horizontal accumulation floor around $0.25 – $0.26 while compressing directly against the descend
Compare with TIA/USDT
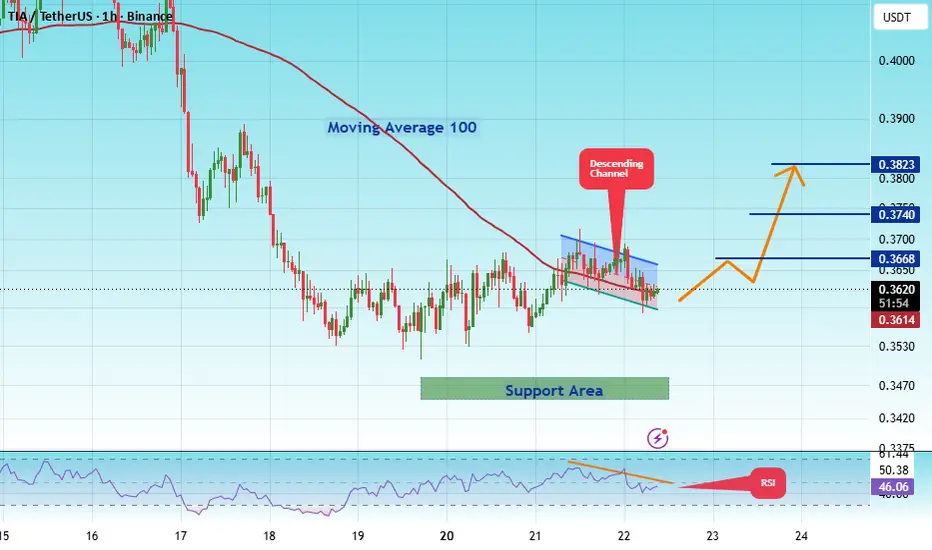
#TIAUSDT — a Major Decision Point at the Downtrend Line!#TIA
The price is moving within a descending channel on the 1-hour timeframe; it has reached the lower boundary and is poised for a rebound. A retest of this boundary is expected, supporting some upward movement.
The Relative Strength Index (RSI) indicates a bearish trend, but an upward breakout i
(TIA) Celestia: The sideways market phase endsIt's been a long time. The current market phase has been active some 8 months, the market produced nothing more than sideways. While additional sideways action is possible, it seems this phase ends now, this week.
Next week full green and higher the market goes, TIAUSDT, to hit all the targets base
$TIA — At a Key Decision Zone !
LSE:TIA is still trading under a clear descending trendline, while price is approaching a strong demand area. The demand zone has already acted as a reaction area, so this is an important point for buyers. However, I would not call the bullish move confirmed yet — the descending trendline is sti
#TIAUSDT Long Opportunity#TIA
The price is moving within a descending channel on the 1-hour timeframe and has reached the lower boundary. It is now poised for a bounce and is expected to retest this boundary.
The Relative Strength Index (RSI) indicates a downward trend, which is likely to continue given the overbought con
TIA is showing a strong confluence of signals on the 4H timeframVDS → SELL
Price is pushing into the upper liquidity zone while RSI is heavily overheated. At the same time, we can see a clear bearish divergence between price and RSI.
OI spike
Open Interest has sharply increased during the latest move higher, suggesting a significant buildup of positions near
TIA/USDT H1: Testing KEY levels before growth🎯 TP1: $0.468700 (+7.87%) │ TP2: $0.477925 (+9.99%)
🛑 SL: $0.395023 (-9.09%) │ R/R: 1 : 1.1
⚠️ SL is placed beyond the nearest candle tails to reduce the risk of accidental stop-outs.
FUNDAMENTAL BACKGROUND
TIA is trading without local catalysts, following the general sentiment of the crypto market
TIA/USDT H2: Testing KEY levels before reversal🎯 TP1: $0.368700 (+3.46%) │ TP2: $0.355499 (+6.91%)
🛑 SL: $0.405901 (-6.28%) │ R/R: 1 : 1.1
⚠️ SL is placed beyond the nearest candle wicks to reduce the risk of accidental triggering
FUNDAMENTAL BACKGROUND
TIA is moving in line with the broader crypto market recovery but lacks its own catalysts. T
#TIA/USDT Long Opportunity#TIA
The price is moving within a descending channel on the 1-hour timeframe and has reached the lower boundary. It is now poised for a bounce and is expected to retest this boundary.
The Relative Strength Index (RSI) indicates a downward trend, which is likely to continue given the overbought con
See all ideas
Summarizing what the indicators are suggesting.
Oscillators
Neutral
Oscillators
Neutral
Summary
Neutral
Summary
Neutral
Summary
Neutral
Moving Averages
Neutral
Moving Averages
Neutral
Displays a symbol's price movements over previous years to identify recurring trends.
Frequently asked questions
The current price of CELESTIA / USDT (TIA) is 0.4695 USDT — it has risen 0.21% in the past 24 hours. Try placing this info into the context by checking out what coins are also gaining and losing at the moment and seeing TIA price chart.
CELESTIA / USDT price has fallen by −3.75% over the last week, its month performance shows a 29.21% increase, and as for the last year, CELESTIA / USDT has decreased by −68.78%. See more dynamics on TIA price chart.
Keep track of coins' changes with our Crypto Coins Heatmap.
CELESTIA / USDT (TIA) reached its highest price on Mar 2, 2025 — it amounted to 4.4880 USDT. Find more insights on the TIA price chart.
See the list of crypto gainers and choose what best fits your strategy.
CELESTIA / USDT (TIA) reached the lowest price of 0.2360 USDT on Oct 10, 2025. View more CELESTIA / USDT dynamics on the price chart.
See the list of crypto losers to find unexpected opportunities.
The safest choice when buying TIA is to go to a well-known crypto exchange. Some of the popular names are Binance, Coinbase, Kraken. But you'll have to find a reliable broker and create an account first. You can trade TIA right from TradingView charts — just choose a broker and connect to your account.
Crypto markets are famous for their volatility, so one should study all the available stats before adding crypto assets to their portfolio. Very often it's technical analysis that comes in handy. We prepared technical ratings for CELESTIA / USDT (TIA): today its technical analysis shows the buy signal, and according to the 1 week rating TIA shows the buy signal. And you'd better dig deeper and study 1 month rating too — it's neutral. Find inspiration in CELESTIA / USDT trading ideas and keep track of what's moving crypto markets with our crypto news feed.
CELESTIA / USDT (TIA) is just as reliable as any other crypto asset — this corner of the world market is highly volatile. Today, for instance, CELESTIA / USDT is estimated as 1.97% volatile. The only thing it means is that you must prepare and examine all available information before making a decision.
You can discuss CELESTIA / USDT (TIA) with other users in our public chats, Minds or in the comments to Ideas.