TIA: local squeeze with $0.4050 destinationThe Macro Picture 🗺️
TIA unwound from the $0.5214 macro ceiling into a summer range and now sits at $0.3187, holding above the $0.2909 local low. Price is coiling in the lower half of the range with the floor intact — a base rebuilding, not a breakdown.
The Setup ⚙️
The Range Floor 🟢
$0.2909 (Local Low) is the demand shelf, with $0.2768 (Macro Support) as the deeper backstop just below. Both have held, and that's the base this range pivots on.
The Decision Point 🔴
$0.3815 (Local High) is the gate. A daily close above it flips the local structure bullish and opens the path to the $0.4050 measured-move target.
The Roadmap 🛣️
Hold above $0.2909 → break $0.3815 → run toward $0.4050. Invalidation is a clean daily close below $0.2768 — that breaks the range.
This is a GRID Range Play: a defined band to rotate, buying the lower half and scaling out into the breakout.
#TIA #Celestia #crypto #trading #TA #3Commas #GRID
In-depth trading ideas
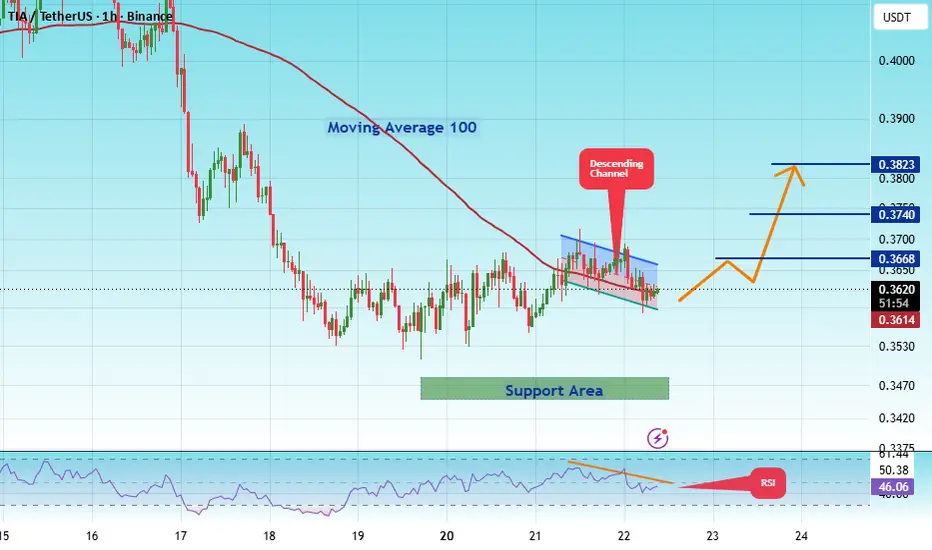
#TIA/USDT Long Opportunity#TIA
The price is moving within a descending channel on the 1-hour timeframe and has reached the lower boundary. It is now poised for a bounce and is expected to retest this boundary.
The Relative Strength Index (RSI) indicates a downward trend, which is likely to continue given the overbought conditions.
There is a key support zone in green at 0.002015. The price has bounced off this zone several times, making it a strong support level.
The price is trending towards the 100-period moving average, which we are approaching. This trend supports an upward move.
Entry Price: 0.002238
Target 1: 0.002325
Target 2: 0.002433
Target 3: 0.002564
Stop Loss: At the resistance zone in green
Remember this simple rule: Money Management.
Any questions? Please leave a comment.
Thank you.
#TIA Possible Scenario Medium-Term Trend: Downtrend — The chart displays a sharp decline from the top around the 0.4150 – 0.4200 level down to a low near 0.3530.
Short-Term Trend: Reversal / Accumulation — The price appears to have found a short-term bottom and is attempting to reverse upward, making higher lows off the 0.3530 base.
TIAUSDT: Six Weeks of AccumulationTIA has been building a base since March between roughly 0.29 and 0.52, and over the last six weeks it has narrowed into a range between 0.38 and 0.42 on a rising trendline. Price is around 0.409 as I write, still about 80 percent below last summer's high at 2.20. Two things stand out on the daily: the volume moving average has been trending up for months while price stayed flat, and the RSI average has been rising alongside it. Flat price with rising participation is what accumulation usually looks like.
The three-month liquidity map
Zooming out, the 3-month heatmap shows the levels that have been building for weeks: a band at 0.475 to 0.49, and the largest one near 0.52. That last zone lines up with the falling 200-day average at about 0.52. Liquidity and the long-term moving average converge in the same area, which makes 0.49 to 0.52 the main test for the whole base.
Flows and sentiment
Net volume is positive across timeframes, CVD is rising, and the daily reads as short covering rather than fresh longs, which fits an accumulation phase. On the social side, sentiment is near a 52-week high on V9 upgrade chatter, with social dominance running well above its daily average. Meanwhile the trading communities we track show zero TIA mentions over the last 48 hours. The interest is coming from the upgrade narrative, not from the trading crowd yet.
Spot volume is still below its daily average, and upgrade chatter needs on-chain usage to catch up. A break without volume behind it is a break we treat with suspicion.
Scenarios and invalidation
Acceptance above 0.421 opens 0.449 first, then the 0.475 to 0.49 band, with the 0.52 confluence as the zone the bigger map points to.
There is a path that dips before it goes up. The 3-month map shows resting liquidity around 0.34, and the demand zone below the range sits at 0.355 to 0.39. A sweep below the 0.384 shelf into that zone, followed by a quick reclaim, reads as a spring rather than a breakdown, and bases like this one often end on exactly that move.
However, a daily close under 0.355 breaks the demand zone and the trendline together, and the accumulation thesis is off.
This is analysis, not financial advice.
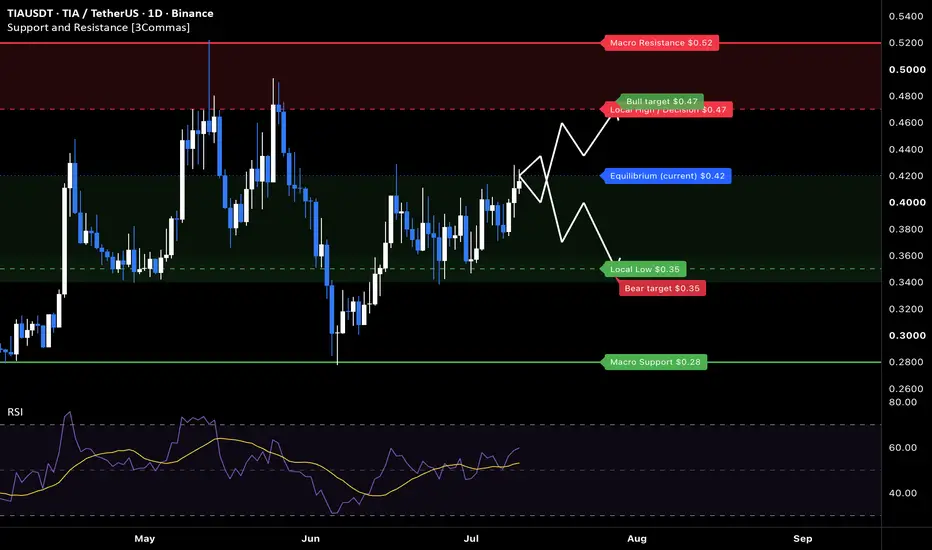
TIA: V-recovery pressing the $0.47 decisionThe Macro Picture 🗺️
TIA swept the $0.28 macro floor in June — a deep liquidity hunt that flushed the over-leveraged longs — and has since produced a powerful V-recovery, reclaiming the $0.35 shelf and driving all the way back to the $0.42 equilibrium. RSI has climbed steadily through the upper half of its range, confirming momentum has flipped from capitulation to accumulation. The recovery is now pressing directly into the pre-flush structure, and the question is whether buyers can clear the $0.47 decision that capped the prior range.
The Setup ⚙️
The Reaction: The $0.28 macro support (solid green) absorbed the June sweep and launched the entire recovery. The $0.35 local low now acts as first defense — as long as it holds on a closing basis, the reversal structure stays intact.
The Accumulation Zone: The $0.36–$0.42 band is a textbook pocket for staggered, averaging-based entries — dips into it after this run let buyers build into the next leg rather than chasing the reclaim.
The Ceiling: The $0.47 local decision (red dashed) is the immediate gate — the May body high that capped the range. A decisive daily close above it opens the path toward the $0.52 macro top.
The Roadmap: Primary target sits at $0.47 — the green roadmap points toward a test of the decision level as buyers press the recovery. Invalidation: a sustained 1D close below $0.35 would break the recovery structure and reopen the path toward the $0.28 floor.
More setups in profile.
TIAUSDT — Short at Supply Rejection [Quantum Algo]TIA sold off from the 0.396 highs down to a 0.345 swing low, then put in a corrective bounce back into prior supply. Price pushed straight into the overhead supply block and stalled, rejecting the retracement. This is a continuation short: fade the lower high, ride the resumption of the down-leg toward resting liquidity.
Why this setup works — three confluences:
Supply rejection. Price tapped the overhead supply zone and failed to hold above it. This is where sellers historically step back in, and the reaction printed on the tap — not on a guess.
Lower high into a downtrend. The bounce off 0.345 is a corrective leg, not a reversal. Rejecting here keeps the market-structure sequence intact (lower high following the lower low), so this trade sits with the dominant direction rather than fighting it.
Clean liquidity below. There's an air pocket beneath entry down to the 0.360 consolidation, then the 0.345 swing low sitting as an untapped magnet. Defined risk above the zone, asymmetric room below.
Trade management:
Entry: 0.3750 (rejection off supply)
SL: 0.3860 (above the zone)
TP1: 0.3600 — take 50% off, move stop to breakeven
TP2: 0.3460 — 100% exit at the swing-low liquidity
R:R: ~2.6:1 to full target
Invalidation:
A 15m close back above 0.3860. That reclaims the supply zone and tells us it got absorbed — buyers in control, thesis dead. No argument, just out.
The lesson:
Bounces inside a downtrend are opportunities, not reversals — until proven otherwise. The edge isn't predicting the top; it's waiting for price to come to a level that matters, letting supply reject it, and defining your risk against structure so a wrong read costs one clean R, not your account.
Signal fired. We took it. Update coming.
Disclaimer: Not financial advice. This idea is shared for educational purposes only. Trading leveraged instruments carries substantial risk. Past performance is not indicative of future results. Always do your own research and manage your own risk.
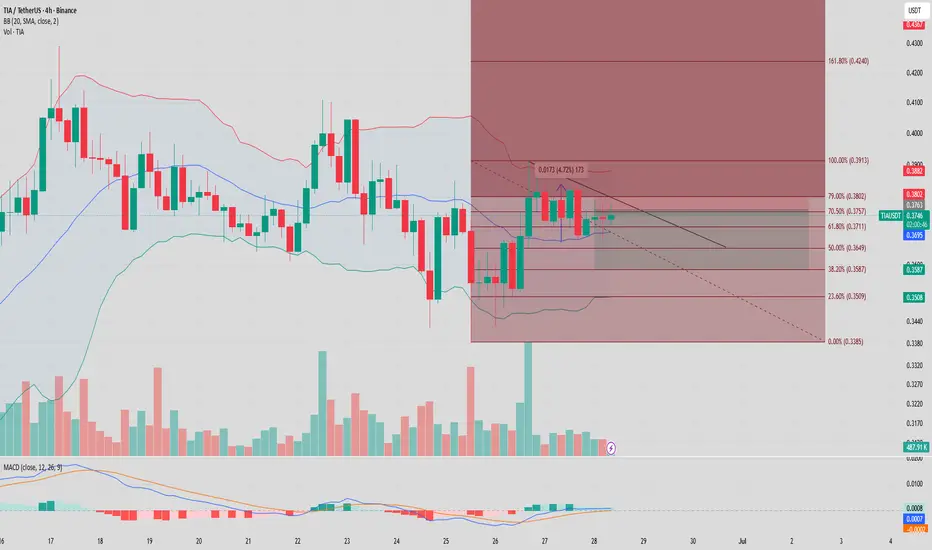
TIA/USDT Short IdeaKRAKEN:TIAUSD
TIA is showing signs of weakness after failing to hold above key resistance, with price now trading near the upper-middle range of the Bollinger Bands. The rejection suggests fading bullish momentum, and a corrective move could be developing.
A potential short setup could be considered if price confirms further downside with increasing sell pressure. The main target would be the lower Bollinger Band, which aligns with a possible liquidity sweep and short-term support zone.
#TIA Possible Scenario Resistance-to-Support Flip (S/R Flip): The green rectangle highlights a former supply zone where sellers previously capped the price. The current 1-hour candle has broken cleanly above this zone with strong volume (indicated by the solid green body).
The Plan: The projected green path anticipates a classic "retest and go" pattern. Price is expected to pull back slightly to test the newly flipped support level before gathering liquidity for the next leg up.
TIA / TIAUSDT Bullish Setup | Futures Trade IdeaMARKET ANALYSIS
TIA is currently reacting from a key technical area highlighted on the chart.
As long as the protected support zone remains intact, the bullish market structure remains valid and higher liquidity targets may continue to attract price action.
A breakdown below the invalidation level would weaken the current bullish scenario and require a reassessment of market conditions.
📍 Entry, Stop Loss and Take Profit levels are marked directly on the chart.
━━━━━━━━━━━━━━
⚠️ DISCLAIMER
This publication is provided solely for educational and market observation purposes.
Nothing contained in this analysis should be considered financial advice, investment advice, or a recommendation to buy or sell any financial instrument.
All trading and investment decisions remain solely the responsibility of the individual trader.
Always conduct your own research and apply proper risk management before entering any position.
━━━━━━━━━━━━━━
🎯 PARALOG
▪️Crypto Market Analysis
▪️BTC Futures Signals
▪️Bitcoin & Altcoin Market Analysis
Precision • Momentum • Timing
━━━━━━━━━━━━━━
Exchange: #MEXC Futures
#bitcoin #btc #crypto #futures #technicalanalysis
TIA Rising Wedge Recovery Building MomentumTIA is continuing to build a constructive recovery structure after months of heavy downside pressure. Price remains inside a broad rising wedge, with buyers consistently defending higher lows and preventing a return to the yearly lows.
The recent rejection from the upper wedge boundary near 0.52 cooled momentum, but the pullback was relatively shallow and support around 0.35 - 0.34 held firmly. The rebound from that area shows buyers are still active and attempting to regain short-term control.
As long as TIA remains above the wedge support, the structure favors further consolidation and another push toward the upper resistance zone. A breakout above 0.43 would strengthen bullish momentum and open the door for a retest of 0.52 and potentially higher levels.
Key Levels
🟢 Support: 0.3535 → 0.3417 → 0.2313
🔴 Resistance: 0.4287 → 0.5214
📈 Bias: Bullish while holding above wedge support
⚠️ A clean break above 0.43 would likely trigger the next expansion toward the channel highs.
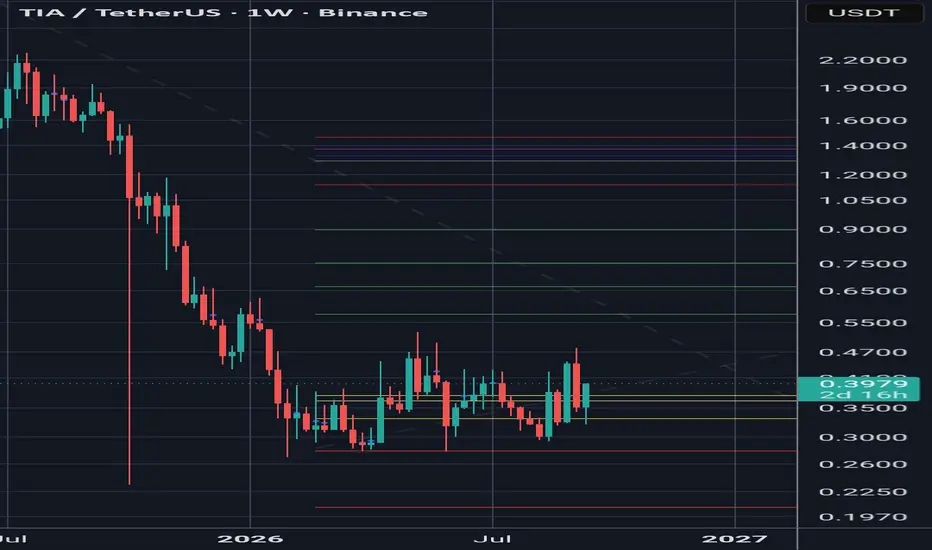
Celestia (TIA) Great Buy & Hold —Moving Within Bottom RangeAfter all this time, Celestia (TIAUSDT) is still a great buy as it is trading at the bottom range and close to its all-time low. Notice how the chart structure remains the same month after month after month, and this is a desirable situation.
Soon we will experience "the switch." An event where the stock market will crash while the Cryptocurrency market—especially the altcoins—recovers and grow.
This chart is identical to Worldcoin (WLD) before the bullish breakout, so we can expect the same to happen with Celestia. At this point, all that is needed is to buy and hold. Once the market turns green, good, long-term growth.
When we consider WLDUSDT we can see how the bottom consolidation range resulted in the start of a new market phase. Not simply a relief rally nor a strong bullish jump; instead, we are seeing higher highs and sustained growth, this can go on for years and this is what makes the current market phase so appealing.
After buying, I just wait. Eventually the market turns green and I am in the green zone as well. There is nothing else to do, just buy and hold. I can plan my take profit strategy before-hand, or I can simply hold long-term. Since I am buying at the bottom, there is no way to get it wrong.
Many other projects have the same or a similar chart.
I hope you are having a wonderful day... Thanks a lot for your continued support.
Namaste.
TIAUSDT - Descending Channel, Reversal or Bearish Continuation?On the 2-Day (2D) timeframe, TIA/USDT continues to trade within a well-defined 📉 Descending Channel that has been in place since the late-2024 peak. This pattern reflects strong seller dominance over the medium-to-long term, characterized by a consistent sequence of Lower Highs 📉 and Lower Lows 📉.
Currently, price is approaching the upper boundary of the channel and testing the major descending resistance 🔴. This area represents a crucial decision zone that could determine the next major directional move.
---
🔍 Main Pattern: Descending Channel 📉
📚 Pattern Characteristics
✅ Descending resistance trendline (Red Line 🔴)
✅ Descending support trendline (Yellow Line 🟡)
✅ Price oscillating within the channel ↕️
✅ Structured bearish market trend 📉
From a technical perspective, a 🚀 breakout above a Descending Channel often signals the beginning of a trend reversal, especially when supported by strong buying volume 📈.
---
🟢 Bullish Scenario 🚀
✅ Bullish Confirmation
The bullish outlook becomes increasingly valid if TIA can:
✔️ Break and close above the channel resistance 🔥
✔️ Reclaim key horizontal resistance levels 📈
✔️ Form the first significant Higher High since the downtrend began 🎯
🎯 Upside Targets
🥇 Target 1: $0.4700
🥈 Target 2: $0.6050
🥉 Target 3: $0.7750
🏅 Target 4: $1.0500
👑 Target 5: $1.3500
If the breakout succeeds, the $0.4700 area could become a new support zone 🟢, opening the door for a larger recovery toward the psychological $1+ region.
💡 Bullish Factors
🔹 Price is approaching the channel apex.
🔹 Selling pressure appears weaker compared to earlier stages of the trend.
🔹 Potential short-covering rally if resistance is broken.
🔹 Risk-to-reward ratio becomes more attractive after a prolonged decline.
🔹 Potential market structure shift from bearish to bullish.
---
🔴 Bearish Scenario ⚠️
🚨 Rejection at Channel Resistance
If price fails to break above the descending resistance and gets rejected:
❌ The bearish structure remains intact.
❌ The Descending Channel stays valid.
❌ Sellers could regain full control of the market.
🎯 Downside Targets
🔻 Immediate support: $0.2700
🔻 Lower channel support: $0.2300
A breakdown below channel support could trigger another bearish leg 📉 and potentially create new lows.
⚠️ Additional Bearish Risks
🔸 False breakout above resistance followed by a move back inside the channel.
🔸 Weak breakout volume.
🔸 Broader cryptocurrency market weakness.
🔸 Renewed selling pressure around resistance levels.
---
📌 Key Levels to Watch 👀
🟢 Resistance Levels
🔹 $0.4700
🔹 $0.6050
🔹 $0.7750
🔹 $1.0500
🔹 $1.3500
🔴 Support Levels
🔸 $0.2700
🔸 $0.2300
🔸 Lower Boundary of the Descending Channel
---
🎯 Conclusion
TIA is currently positioned at one of its most important technical levels since the downtrend began. Price is testing the upper resistance of a long-term 📉 Descending Channel that has constrained market action for several months.
🚀 A confirmed breakout could initiate a recovery phase toward $0.4700, $0.6050, $0.7750, and potentially $1.3500.
📉 However, as long as price remains inside the channel, the broader bearish trend remains the dominant market structure.
⏳ The next few candles could be decisive in determining whether TIA is preparing for a major trend reversal or another continuation of its long-term downtrend.
#TIA #TIAUSDT #Celestia 🚀 #Crypto 💎 #Cryptocurrency #Altcoin #TechnicalAnalysis 📊 #TradingView #CryptoTrading #PriceAction #DescendingChannel 📉 #Breakout 🚀 #Bullish 🐂 #Bearish 🐻 #SupportAndResistance #ChartPattern #Altseason #Binance #SwingTrading #TrendReversal
TIAUSDT 3D#TIA has bounced from the support zone on the 3-day timeframe chart. It is now facing a strong resistance cluster consisting of the descending resistance, the 3-day SMA50, and the Ichimoku Cloud.
In case of a breakout above these levels, the following upside targets could come into play:
🎯 $0.5240
🎯 $0.6916
🎯 $0.9424
🎯 $1.1451
🎯 $1.3478
🎯 $1.6364
🎯 $2.0040
⚠️ Always remember to use a tight stop-loss and maintain proper risk management.
Celestia (TIA): Second Chance —Buy & Hold, Accumulation PhaseThe market always offers a second chance...
TIAUSDT (Celestia) is back within its sideways trading range. Nothing much has happened in the past four months, we do get clear signals though that are pointing toward a massive bullish jump.
TIAUSDT produced a higher high on the sideways range but no lower lows. Trading volume has been wild, really high, after the October 2025 all-time low. And, needless to say, the entire sideways range is a higher low compared to the atl.
This is just a friendly reminder.
The action is happening at support, within the "opportunity buy-zone." If you are fortunate enough to be able to enter the market now, you will do really good in just a matter of days. What we are about to experience is not just some small bullish advance, this is what happened between February and May; we are now set to experience a bullish wave that is many times bigger and this time it will reach much farther, more sectors of the market will grow.
You are looking at perfect timing and great profits potential. Buy and hold. Accumulate as much as you can.
Namaste.
Celestia (TIA) hits bottom: ~7000% profits potential & moreThe end of the downtrend is happening with a perfect rounded bottom. Notice how after the bottom wick in October last year trading volume goes really high and stays high.
TIAUSDT this week is trading at the highest price based on candle close since mid-January, revealing a complete bottom recovery. This is only the start, naturally, but a step in the right direction.
This project has tremendous potential for growth, see the numbers on the chart. The $33 target opens up ~7,000% profits potential and this isn't the last target nor the full range. These targets were extracted using only a portion of the bear market, starting December 2024. If we were to use the full chart and cycle, we would get even bigger numbers. Celetia's bear market started February 2024.
The project did great at launch but then turned bearish to join many altcoins in their worst period ever. From the worst ever the best conditions develop, I am being very serious. Think of March 2020 and the Covid-scam crash. This produced a major low across all financial markets, not only Crypto, and from this low we saw the most astonishing bull market. It is the same today.
Things got pretty bad but everything is about to change. We can experience years of sustained bullish action. Support will come from the changing times, an evolving financial system, easy money, war, human evolution and so on. It will be great because we will make it great. We are the market.
Thanks a lot for your continued support.
Namaste.
TIAUSDT 1D#TIA has broken above the daily SMA200 and is now on the verge of breaking out above the neckline of the rounding bottom pattern on the daily chart. In case of a breakout, the potential upside targets are:
🎯 $0.5547
🎯 $0.6182
🎯 $0.7087
🎯 $0.8240
⚠️ Always use a tight stop-loss and maintain proper risk management.
TIA sell setup is getting activated (4H)A symmetrical pattern appears to be forming on TIA.
It seems that wave G has completed, and TIA is currently in the middle of wave H within this symmetrical structure.
If a pullback to the red zone occurs, it could provide a good opportunity to enter a sell/short position.
Enter the position using DCA within the supply zone.
The targets are marked on the chart. Take partial profit at the first target, then move your stop loss to breakeven.
If you have a symbol you want analyzed, first hit the like button and then comment its name so I can review it for you.
Do you also think TIA is bearish?
TIA lost bullish structure and turned bearishIf you’ve followed our previous analyses, you know we’ve been tracking TIA’s structure for quite some time.
After reacting to the swap zone, TIA buyers appear to have failed, as sell orders in these areas are heavy enough to absorb the buying pressure.
fter forming a bearish CH, TIA has lost its bullish momentum and now appears to be entering a bearish phase.
We have identified two entry zones for a sell/short position, and entries should be managed using a DCA strategy.
Targets are marked on the chart. Once the first target is reached, move your stop to breakeven and secure partial profits.
A daily candle close above the invalidation level will invalidate this bearish outlook.
If you would like us to analyze a coin or altcoin for you, first like this post, then comment the name of your altcoin below.
What is your opinion about TIA?
TIAUSDT Forming Bullish MomentumTIAUSDT is forming a clear bullish momentum pattern, a classic bullish wave signal that often indicates an upcoming breakout. The price has been consolidating within a narrowing range, suggesting that selling pressure is weakening while buyers are beginning to regain control. With consistent volume confirming accumulation at lower levels, the setup hints at a potential bullish breakout soon. The projected move could lead to an impressive gain of around 40% to 50% once the price breaks above the wedge resistance.
This bullish momentum pattern is typically seen at the end of downtrends or corrective phases, and it represents a potential shift in market sentiment from bearish to bullish. Traders closely watching TIAUSDT are noting the strengthening momentum as it nears a breakout zone. The good trading volume adds confidence to this pattern, showing that market participants are positioning early in anticipation of a reversal.
Investors’ growing interest in TIAUSDT reflects rising confidence in the project’s long-term fundamentals and current technical strength. If the breakout confirms with sustained volume, this could mark the start of a fresh bullish leg. Traders might find this a valuable setup for medium-term gains, especially as the momentum pattern completes and buying momentum accelerates.
✅ Show your support by hitting the like button and
✅ Leaving a comment below! (What is your opinion about this Coin?)
Your feedback and engagement keep me inspired to share more insightful market analysis with you!