TLM Compresses Below High-Volume Resistance: Breakout or AnotherTLM/USDT is approaching an important decision point on the 4-hour chart as price compresses between descending resistance and a developing higher-low structure.
Following the sharp expansion in early July, TLM reached approximately $0.0038 before entering a prolonged corrective phase. Since then, p
Compare with TLM/USDT
TLMUSDT Forming Bullish MomentumTLMUSDT is forming a clear bullish momentum pattern, a classic bullish wave signal that often indicates an upcoming breakout. The price has been consolidating within a narrowing range, suggesting that selling pressure is gradually weakening while buyers are beginning to regain control. With consiste
TLMUSDT.P: short setup from daily support at 0.002213I had this setup recently, but back then we moved too far away from the level. Now we are back here, and I continue to expect a level breakout.
Right now, we have the beginning of a pre-breakout base formation. Before the breakdown, I want the price to retest the level at least once.
TLMUSDT - Descending Trendline, Breakout or Another Rejection?TLMUSDT remains in a long-term downtrend, defined by a Descending Trendline that has been respected since the market peak in 2021. This trendline has acted as a major dynamic resistance for several years, with every rally being rejected before a confirmed breakout could occur.
The current price is
TLMUSDT.P: short setup from daily support at 0.002213BINANCE:TLMUSDT.P is heading down after a pump. It's not totally obvious here that we will definitely keep falling, but the support level the asset is trading above is very obvious.
If the pump is over, the asset will most likely break this level, making it a good opportunity to take a short. But
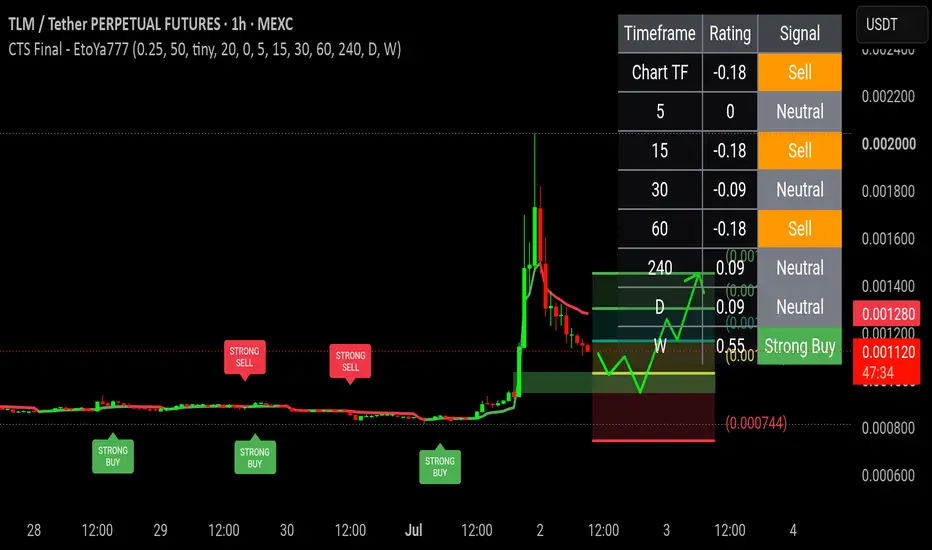
#TLM Possible Scenario Short-Term Trend: Downtrend (Correction). Following a powerful vertical spike up to nearly 0.002000, the price is undergoing an aggressive pullback, forming consecutive lower highs and lower lows on the 1-hour timeframe.
Medium-Term Trend: Neutral to Bullish. The price remains significantly higher
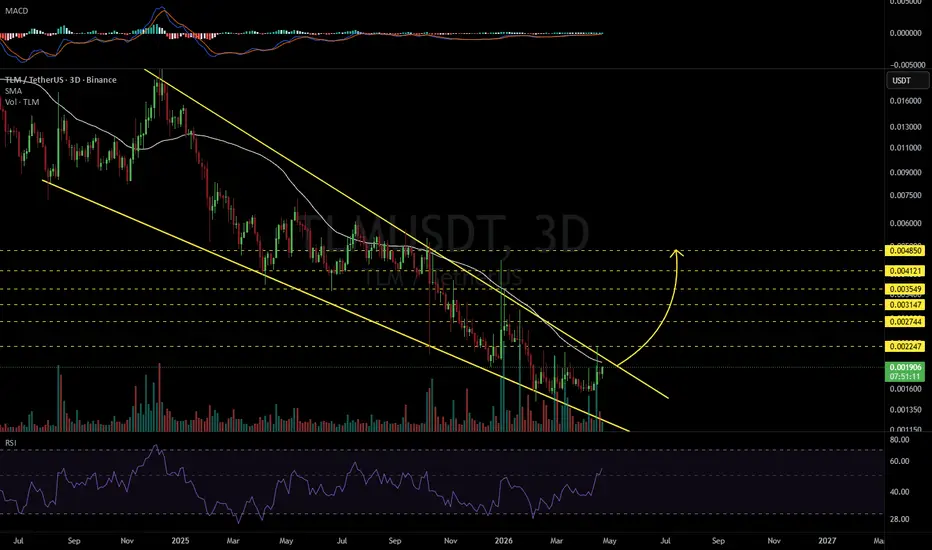
TLMUSDT 3D#TLM is trading within a falling wedge pattern on the 3-day timeframe. In case of a breakout above the wedge resistance and the 3-day SMA50, the potential upside targets are:
🎯 $0.002247
🎯 $0.002744
🎯 $0.003147
🎯 $0.003549
🎯 $0.004121
🎯 $0.004850
⚠️ Always remember to use a tight stop-loss and mai
TLMUSDT Forming Bearish ContinuationTLMUSDT is currently showing strong bearish continuation on the 4H timeframe, with price decisively breaking below the lower boundary of the descending channel.
The chart displays a clear breakdown from the channel structure, followed by lower lows and failed retests of the broken line. Momentum re
See all ideas
Summarizing what the indicators are suggesting.
Oscillators
Neutral
SellBuy
Strong sellStrong buy
Strong sellSellNeutralBuyStrong buy
Oscillators
Neutral
SellBuy
Strong sellStrong buy
Strong sellSellNeutralBuyStrong buy
Summary
Neutral
SellBuy
Strong sellStrong buy
Strong sellSellNeutralBuyStrong buy
Summary
Neutral
SellBuy
Strong sellStrong buy
Strong sellSellNeutralBuyStrong buy
Summary
Neutral
SellBuy
Strong sellStrong buy
Strong sellSellNeutralBuyStrong buy
Moving Averages
Neutral
SellBuy
Strong sellStrong buy
Strong sellSellNeutralBuyStrong buy
Moving Averages
Neutral
SellBuy
Strong sellStrong buy
Strong sellSellNeutralBuyStrong buy
Displays a symbol's price movements over previous years to identify recurring trends.
Frequently asked questions
The current price of Alien Worlds/Tether (TLM) is 0.0016471 USDT — it has risen 4.71% in the past 24 hours. Try placing this info into the context by checking out what coins are also gaining and losing at the moment and seeing TLM price chart.
Alien Worlds/Tether price has fallen by −7.93% over the last week, its month performance shows a −30.42% decrease, and as for the last year, Alien Worlds/Tether has decreased by −66.81%. See more dynamics on TLM price chart.
Keep track of coins' changes with our Crypto Coins Heatmap.
Alien Worlds/Tether (TLM) reached its highest price on Apr 14, 2021 — it amounted to 0.9412000 USDT. Find more insights on the TLM price chart.
See the list of crypto gainers and choose what best fits your strategy.
Alien Worlds/Tether (TLM) reached the lowest price of 0.0008091 USDT on Jul 1, 2026. View more Alien Worlds/Tether dynamics on the price chart.
See the list of crypto losers to find unexpected opportunities.
The safest choice when buying TLM is to go to a well-known crypto exchange. Some of the popular names are Binance, Coinbase, Kraken. But you'll have to find a reliable broker and create an account first. You can trade TLM right from TradingView charts — just choose a broker and connect to your account.
Crypto markets are famous for their volatility, so one should study all the available stats before adding crypto assets to their portfolio. Very often it's technical analysis that comes in handy. We prepared technical ratings for Alien Worlds/Tether (TLM): today its technical analysis shows the neutral signal, and according to the 1 week rating TLM shows the sell signal. And you'd better dig deeper and study 1 month rating too — it's sell. Find inspiration in Alien Worlds/Tether trading ideas and keep track of what's moving crypto markets with our crypto news feed.
Alien Worlds/Tether (TLM) is just as reliable as any other crypto asset — this corner of the world market is highly volatile. Today, for instance, Alien Worlds/Tether is estimated as 9.51% volatile. The only thing it means is that you must prepare and examine all available information before making a decision.
You can discuss Alien Worlds/Tether (TLM) with other users in our public chats, Minds or in the comments to Ideas.