TLM Compresses Below High-Volume Resistance: Breakout or AnotherTLM/USDT is approaching an important decision point on the 4-hour chart as price compresses between descending resistance and a developing higher-low structure.
Following the sharp expansion in early July, TLM reached approximately $0.0038 before entering a prolonged corrective phase. Since then, price has continued to form lower highs, keeping the broader short-term structure bearish. However, sellers have repeatedly failed to establish acceptance below the $0.00138 area, suggesting that demand is still present around the lower boundary of the range.
Why the Current Zone Matters
The volume profile shows that a significant amount of trading activity occurred around $0.00169, making this area an important point of control and market acceptance zone.
Price is currently trading near $0.00160, below both the point of control and the descending resistance structure. This means buyers have not regained control yet.
The recent push above the descending trendline briefly tested the $0.00169 to $0.00173 resistance zone but failed to produce sustained continuation. Until price closes and holds above this area, the move should be treated as a liquidity test rather than a confirmed breakout.
Bullish Scenario
The bullish scenario requires a decisive 4-hour close above the $0.00169 to $0.00173 resistance zone, preferably supported by expanding volume.
A breakout alone may not be sufficient. The stronger confirmation would be:
A 4-hour close above $0.00173
A successful retest of $0.00169 to $0.00173 as support
Continued formation of higher lows
Increasing volume during the upward move
If buyers establish acceptance above this zone, the next areas of interest are:
First target: $0.00185 to $0.00190
Second target: $0.00215 to $0.00230
Major target: $0.00260 to $0.00270
The $0.00260 to $0.00270 region represents the major horizontal resistance that previously rejected price during the July recovery.
Bearish Scenario
The structure remains vulnerable while TLM stays below $0.00173.
Another rejection from the descending resistance could push price back toward the rising support line and the major demand zone around $0.00138.
A confirmed 4-hour close below $0.001386 would weaken the higher-low structure and indicate that sellers have regained control. In that case, the next downside areas would be:
Initial support: $0.00120
Major support: $0.00110
Extended risk: A return toward the pre-expansion accumulation region
The bearish scenario becomes stronger if the breakdown is accompanied by increasing sell volume.
Key Levels
Current price: Approximately $0.00160
Point of control: $0.00169
Breakout zone: $0.00169 to $0.00173
Major support: $0.001386
Bullish target: $0.00260 to $0.00270
Bearish target: $0.00120 to $0.00110
Conclusion
TLM is not in a confirmed breakout yet. It is trading inside a compression structure where descending resistance, rising support, and the high-volume zone are converging.
The most important signal will not be a temporary move above the trendline. It will be whether price can establish sustained acceptance above $0.00173.
Until that happens, the market remains neutral to bearish, with $0.001386 acting as the critical invalidation level for the developing bullish structure.
This setup should therefore be approached as a confirmation-based trade rather than an anticipatory breakout.
In-depth trading ideas
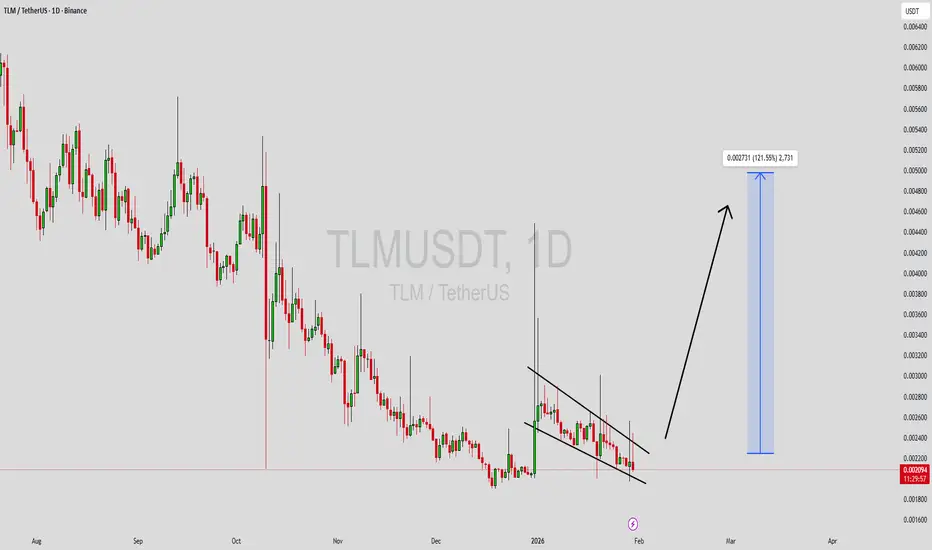
TLMUSDT Forming Bullish MomentumTLMUSDT is forming a clear bullish momentum pattern, a classic bullish wave signal that often indicates an upcoming breakout. The price has been consolidating within a narrowing range, suggesting that selling pressure is gradually weakening while buyers are beginning to regain control. With consistent trading volume confirming accumulation at lower levels, the current setup hints at a potential bullish breakout in the near future. If the breakout is confirmed, the projected move could lead to an impressive gain of around 190% to 200%.
This bullish momentum pattern is commonly seen at the end of downtrends or corrective phases, signaling a potential shift in market sentiment from bearish to bullish. Traders closely watching TLMUSDT are noticing strengthening momentum as the price approaches a critical breakout zone. Healthy trading volume adds confidence to this setup, indicating that market participants are positioning early in anticipation of a sustained upward move.
Growing investor interest in TLMUSDT reflects increasing confidence in the project's long-term potential and its current technical structure. If buyers successfully push the price above the key resistance level with sustained volume, it could mark the beginning of a fresh bullish leg. The ongoing consolidation phase suggests steady accumulation, creating favorable conditions for a strong continuation rally once the breakout is confirmed.
Traders may find this an attractive medium-term opportunity, especially as the bullish momentum pattern nears completion and buying pressure continues to build. A confirmed breakout could attract additional market participation and accelerate the move toward the projected upside target.
✅ Show your support by hitting the like button.
✅ Leaving a comment below! (What is You opinion about this Coin)
Your feedback and engagement keep me inspired to share more insightful market analysis with you!
TLMUSDT.P: short setup from daily support at 0.002213I had this setup recently, but back then we moved too far away from the level. Now we are back here, and I continue to expect a level breakout.
Right now, we have the beginning of a pre-breakout base formation. Before the breakdown, I want the price to retest the level at least once.
TLMUSDT - Descending Trendline, Breakout or Another Rejection?TLMUSDT remains in a long-term downtrend, defined by a Descending Trendline that has been respected since the market peak in 2021. This trendline has acted as a major dynamic resistance for several years, with every rally being rejected before a confirmed breakout could occur.
The current price is now approaching this critical resistance once again after rebounding from its recent lows. The market's reaction around this area will likely determine the next major directional move.
If a breakout occurs, several key horizontal resistance levels may become the next upside targets:
🎯 Resistance 1: 0.005858 USDT
🎯 Resistance 2: 0.008163 USDT
🎯 Resistance 3: 0.021706 USDT
---
🟢 Bullish Scenario
The bullish outlook strengthens if:
✅ The weekly candle closes above the Descending Trendline.
✅ The breakout is supported by increasing trading volume, reducing the probability of a fake breakout.
✅ The broken trendline is successfully retested and holds as new support.
If these conditions are confirmed, TLM could target:
🎯 Target 1: 0.005858 USDT
🎯 Target 2: 0.008163 USDT
🎯 Target 3: 0.021706 USDT
A breakout above a multi-year descending trendline often signals the beginning of a potential trend reversal, shifting market sentiment from bearish to bullish.
---
🔴 Bearish Scenario
The bearish trend remains intact if:
❌ Price is rejected once again at the Descending Trendline.
❌ The weekly candle fails to close above the major resistance.
❌ Buying momentum weakens while selling pressure increases.
If rejection occurs, TLM may:
Retest its recent support zone.
Continue making new lower lows.
Maintain its long-term lower high and lower low market structure, confirming that sellers remain in control.
---
📌 Pattern Explanation
A Descending Trendline is a dynamic resistance formed by connecting a series of lower highs over time.
Its characteristics include:
📉 Indicates that sellers continue to dominate the market.
📍 The longer the trendline remains valid, the more significant it becomes.
🚀 A confirmed breakout often serves as an early indication of a potential trend reversal.
⚠️ Until a valid breakout is confirmed, the primary trend should still be considered bearish.
On the TLMUSDT weekly chart, this trendline has remained intact for several years, making it one of the most important technical levels to monitor.
---
⚠️ Conclusion
TLMUSDT is currently trading at a decisive technical level.
A confirmed breakout above the Descending Trendline could trigger a long-term recovery toward the next resistance levels. However, another rejection would reinforce the ongoing bearish trend that has been in place since 2021.
The weekly candle close and trading volume will be the key confirmation signals before determining the next major market direction.
---
#TLM #TLMUSDT #AlienWorlds #Crypto #Cryptocurrency #Altcoin #Trading #TechnicalAnalysis #TradingView #PriceAction #ChartAnalysis #DescendingTrendline #Breakout #TrendReversal #SupportAndResistance #CryptoTrading #Bullish #Bearish #MarketAnalysis
TLMUSDT.P: short setup from daily support at 0.002213BINANCE:TLMUSDT.P is heading down after a pump. It's not totally obvious here that we will definitely keep falling, but the support level the asset is trading above is very obvious.
If the pump is over, the asset will most likely break this level, making it a good opportunity to take a short. But if the pump isn't over and we push higher, the setup is canceled.
Right now, the price is getting closer to the level, so it's worth putting this asset on the short watchlist.
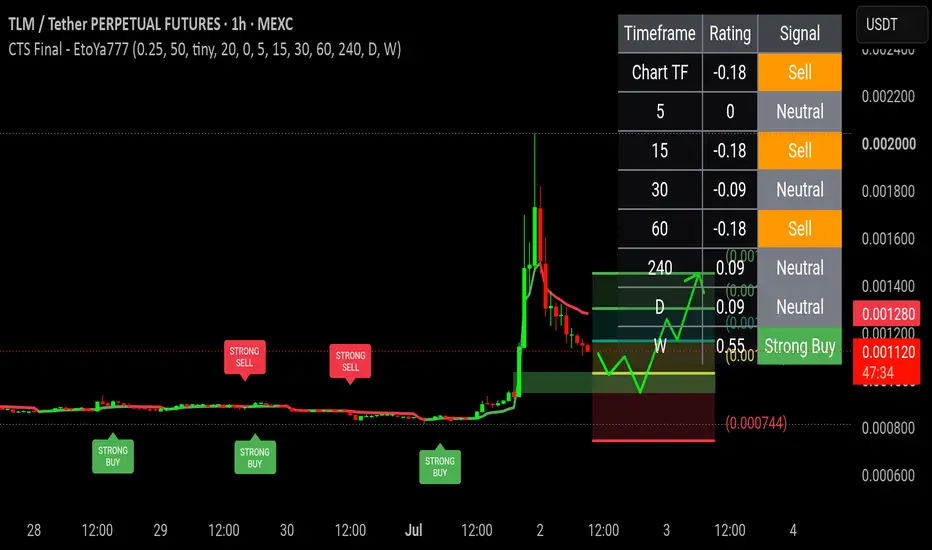
#TLM Possible Scenario Short-Term Trend: Downtrend (Correction). Following a powerful vertical spike up to nearly 0.002000, the price is undergoing an aggressive pullback, forming consecutive lower highs and lower lows on the 1-hour timeframe.
Medium-Term Trend: Neutral to Bullish. The price remains significantly higher than its consolidation base established around June 30th and July 1st, meaning the structural macro-trend is attempting to hold onto its gains.
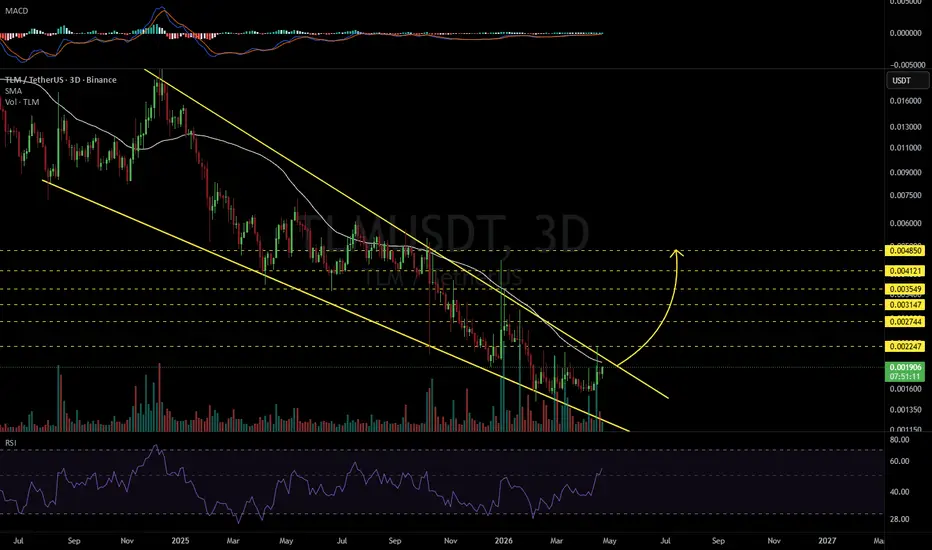
TLMUSDT 3D#TLM is trading within a falling wedge pattern on the 3-day timeframe. In case of a breakout above the wedge resistance and the 3-day SMA50, the potential upside targets are:
🎯 $0.002247
🎯 $0.002744
🎯 $0.003147
🎯 $0.003549
🎯 $0.004121
🎯 $0.004850
⚠️ Always remember to use a tight stop-loss and maintain proper risk management.
TLMUSDT Forming Bearish ContinuationTLMUSDT is currently showing strong bearish continuation on the 4H timeframe, with price decisively breaking below the lower boundary of the descending channel.
The chart displays a clear breakdown from the channel structure, followed by lower lows and failed retests of the broken line. Momentum remains downward (red candles dominating the recent sessions), and volume has not shown meaningful buying absorption on the minor bounces — this is typical of continuation rather than reversal.
Current price (~0.001567) is trading below the channel floor and sitting near the lower dotted support (~0.00150–0.00145 area). A clean close below this level with increased volume would likely accelerate the move toward the next major liquidity pocket around 0.00130–0.00120.
Watch closely for rejection or absorption at ~0.00145–0.00150. If it holds and we get aggressive buying volume + reclaim of 0.00170–0.00175, bulls could attempt a defense. Otherwise, lower targets remain the path of least resistance.
What's your current view on TLM — expecting more downside or looking for a bounce here? Drop your thoughts below!
✅ Smash the like button if this breakdown update was helpful
✅ Comment your bias on TLM right now — continuation lower or reversal incoming?
Your feedback keeps these real-time updates coming — let's stay ahead of the move together!
TLMUSDT Forming Falling WedgeTLMUSDT is forming a clear falling wedge pattern, a classic bullish reversal signal that often indicates an upcoming breakout. The price has been consolidating within a narrowing range, suggesting that selling pressure is weakening while buyers are beginning to regain control. With consistent volume confirming accumulation at lower levels, the setup hints at a potential bullish breakout soon. The projected move could lead to an impressive gain of around 90% to 100% once the price breaks above the wedge resistance.
This falling wedge pattern is typically seen at the end of downtrends or corrective phases, and it represents a potential shift in market sentiment from bearish to bullish. Traders closely watching TLMUSDT are noting the strengthening momentum as it nears a breakout zone. The good trading volume adds confidence to this pattern, showing that market participants are positioning early in anticipation of a reversal.
Investors’ growing interest in TLMUSDT reflects rising confidence in the project’s long-term fundamentals and current technical strength. If the breakout confirms with sustained volume, this could mark the start of a fresh bullish leg. Traders might find this a valuable setup for medium-term gains, especially as the wedge pattern completes and buying momentum accelerates.
✅ Show your support by hitting the like button and
✅ Leaving a comment below! (What is your opinion about this Coin?)
Your feedback and engagement keep me inspired to share more insightful market analysis with you!
$TLM 1W HIGHER TIME FRAME UPDATE
📌 MIL:TLM Technical Analysis: The market has endured a massive long-term dump, falling from historical levels near 0.032 down to roughly 0.002 over the last two years. After this prolonged decline, the price has entered a tight consolidation range, signaling that the extreme selling pressure is finally beginning to stabilize.
📌 Major Weekly Support Zone:
Buyers Defending: This zone is acting as a major floor where buyers are actively stepping in to prevent further downside.
The Opportunity: As long as this support holds, the downside remains limited, and the current consolidation can be viewed as an accumulation phase before a potential reversal.
📌 Bullish Confirmation Requirements: For a sustainable macro trend reversal to occur, the following milestones are needed:
Hold the Support: The price must firmly maintain its position within the green support zone without making new lower lows 🔥
Reversal Candles: Confirmation of the final impulsive leg will be signaled by strong reversal candles on the weekly chart, such as a Bullish Engulfing or Hammer pattern at the support level 🔥💸
TLM Impulsive Move Followed by Demand RetestTLM printed a strong impulsive breakout after a long consolidation phase, creating a clear displacement to the upside. Following this move, price entered a corrective phase and is now pulling back toward a well-defined demand zone formed between the Fibonacci retracement levels.
This zone represents a healthy retracement area rather than immediate weakness. As long as price holds above this demand region and shows stabilization, continuation toward higher resistance levels remains possible, including a retest of the recent highs and extension toward the upper resistance around zero point zero zero four.
If price fails to hold this demand zone, the correction could deepen toward the lower support levels below zero point zero two one, invalidating the bullish continuation scenario.
This setup is based on impulse–retracement structure, demand reaction behavior, and Fibonacci confluence. Confirmation from this zone will define the next directional move.
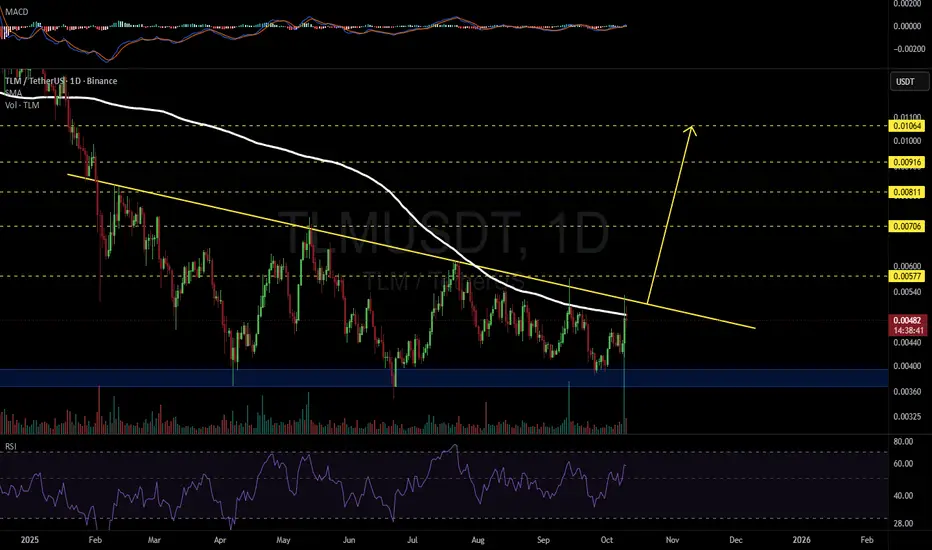
TLMUSDT 1D#TLM is trading within a descending triangle on the daily chart. In case of a breakout above the triangle resistance and the daily SMA200, the potential targets are:
🎯 $0.00577
🎯 $0.00706
🎯 $0.00811
🎯 $0.00916
🎯 $0.01064
⚠️ Always remember to use a tight stop-loss and maintain proper risk management.
TLM GROK: Since no specific asset or market data is provided in your request, I’ll walk through a general analysis and prediction process based on a hypothetical scenario involving a stock trade, putting myself in your shoes to ensure clarity. Let’s assume we’re analyzing a tech stock, XYZ Corp, based on its recent performance trends as of August 31, 2025.
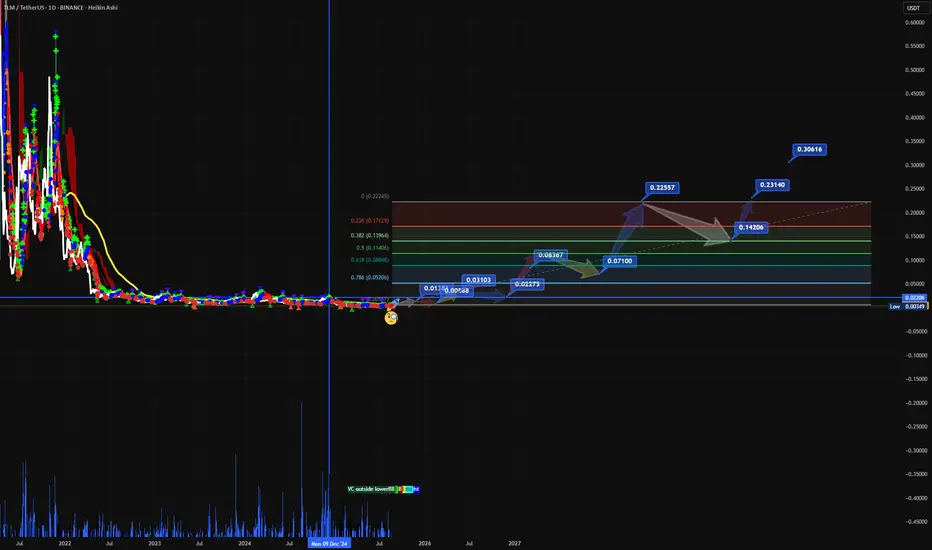
tlm target final🔹 TLM Price 0.0046 → 0.15 USD
Stage Price Range (USD) Description
1 0.0045 – 0.0050 Short-term consolidation, liquidity accumulation
2 0.0050 – 0.0070 Initial breakout, attracting early buyers
3 0.0070 – 0.0100 Mid-term resistance, monitor volume and trend
4 0.0100 – 0.0200 Strong bullish zone, potential entry for long-term investors
5 0.0200 – 0.0500 Accelerated growth, wider market adoption and hype
6 0.0500 – 0.1000 Major bullish trend, strong fundamentals required
7 0.1000 – 0.1500 Long-term target, high risk/high reward zone
---
🔹 Key Notes
Risk Level: Extremely high — this target is very ambitious and long-term.
Entry Zones: Best to enter gradually from stage 1–4 to manage risk.
Stop-Loss: Keep protective stop-loss below recent support levels (e.g., 0.0045 USD).
Indicators: Watch RSI, EMA9/21, VWAP, and trading volume for
TLM Ready for Breakout or Breakdown?Yello Paradisers, are you ready for what could be the final squeeze before TLM makes its next big move? After weeks of bleeding inside this descending channel, the price is now pressing hard against the upper boundary and a decision is coming fast.
💎#TLMUSDT has bounced from a clear support zone around $0.00470 and is currently showing bullish signs with a confirmed break of structure. But for any continuation to the upside, we must see a clean breakout above the descending resistance now acting as the barrier around the $0.0049–$0.0050 area. If that happens, there’s a clear path toward the minor resistance at $0.0056, and potentially a full swing toward the strong resistance zone near $0.0062.
💎However, if #TLM gets rejected here, the price is likely to revisit support, and any break below $0.0042 would invalidate the current bullish setup and confirm weakness returning to the market.This is not the time to trade emotionally. The chart is giving us a clear structure and until the breakout is confirmed, anything else is just noise.
Stay focused, wait for the confirmation, and trade like a pro.
MyCryptoParadise
iFeel the success🌴
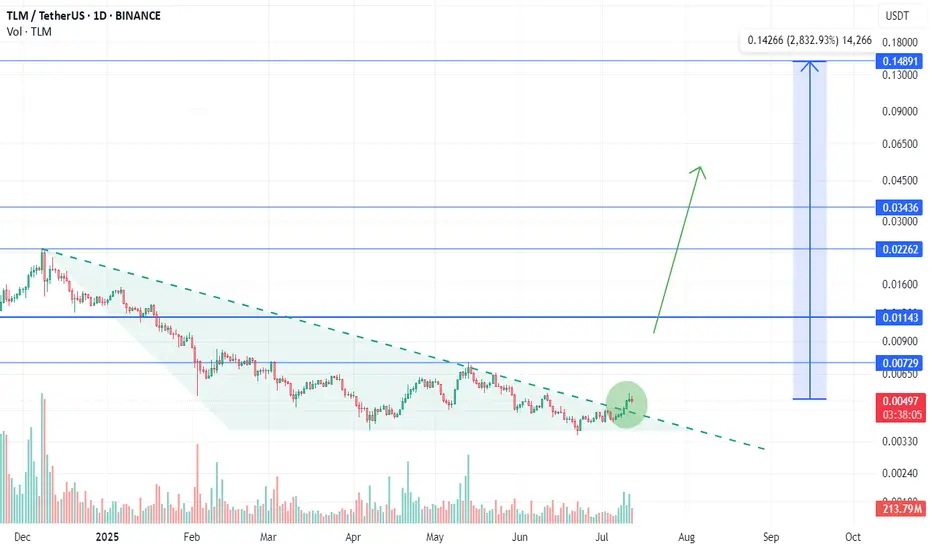
TLM 2800% SoonAlien Worlds
TLM
"Alien Worlds is an NFT metaverse running on the Ethereum, Binance Smart Chain and WAX blockchains."
A sleeping giant
It didn't get its chance because it was listed at the end of the previous bull market.
It's been in a downtrend for over a year.
The day before yesterday, this damned trend was broken.
I expect a very strong rise in the near future.
Targets on the chart:
Stop breaking the bottom and trading below it.
I wish everyone abundant profits.
Like and follow
for more.
TLM Looks Bullish (3D)It seems that a diametric has completed on the chart, or Wave G of a symmetrical pattern has ended, or the price is attempting to form a bullish X-wave.
There is a key zone on the chart that the price has reclaimed, marked in green.
As long as this zone holds, the price can move toward the targets, which are highlighted on the chart.
A daily candle closing below the invalidation level would invalidate this analysis.
For risk management, please don't forget stop loss and capital management
When we reach the first target, save some profit and then change the stop to entry
Comment if you have any questions
Thank You