#TOSHIUSDT #2D (Binance) Big falling wedge break & retest [LONG]TOSHI (Toshi The Cat) first printed a morning star then broke-out of the descending channel, looks bullish mid-term.
Now 50MA support is about to be regained, road towards 100EMA resistance seems next.
⚡️⚡️ #TOSHI/USDT ⚡️⚡️
Exchanges: Binance Futures, Bitget Futures
Signal Type: Regular (LONG)
Leverage: Isolated (3.0X)
Amount: 5.4%
Entry Targets:
1) 0.0001134 - 100.0%
Take-Profit Targets:
1) 0.0001557 - 50.0%
2) 0.0001980 - 50.0%
Stop Targets:
1) 0.0000993 - 100.0%
Trailing Configuration:
S
Toshi / USDT
No trades
No trades
In-depth trading ideas
#TOSHIThe price of #TOSHI is currently consolidating within a falling wedge pattern 📐. The falling wedge is typically a bullish pattern that suggests a potential breakout to the upside. The next target for #TOSHI after a breakout from the wedge is around 0.0001950 🎯.
#TOSHI #crypto #altcoin #trading
TOSHI Technical Analysis | Key Levels & Market OutlookDescription:
Toshi ($TOSHI) is a community-driven cryptocurrency built on Ethereum, focusing on decentralization and long-term adoption. Despite being relatively new, it has gained attention through strong community support and rapid trading activity.
In this analysis, I highlight critical support and resistance levels, trend structure, and potential breakout zones to watch. Market sentiment and volume dynamics remain essential in shaping short-term price direction.
⚠️ Disclaimer: This is not
ToshiToshi usdt Daily analysis
Time frame daily
First target Risk rewards ratio >1.3
First target ~0.0006$
Second target Risk rewards ratio =6 👈👌
Second target =0.0012
Reverse head and shoulders pattern
TLong
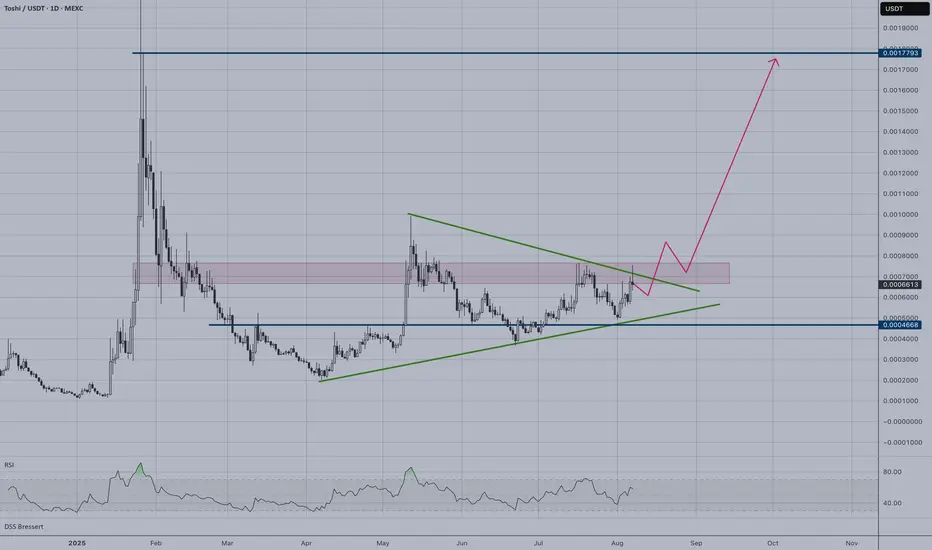
TOSHI | Triangle PatternTOSHI is forming a classic symmetrical triangle pattern on the daily timeframe, indicating consolidation before a potential major move. The price has been compressed between converging support and resistance lines for several months.
Key Technical Observations:
Triangle pattern nearing apex completion
RSI shows neutral momentum around 50 level
Volume compression typical of triangle formations
Breakout Scenarios:
Bullish Breakout:
Target: 0.0017793 USDT (upper resistance zone)
Entry: Abo
Awaiting entry, $TOSHIUSDT looks prime for a double top!Hard to gauge if we get a drop from here — but if we do, I’d love to see a ~20% flush into key support.
Not counting on it just yet, but the chart is coiled and primed for either direction. A potential 2x setup is on deck, so this one needs to be closely monitored given where it currently sits.
Two clear paths:
Flush into demand (my preferred entry)
Or a reclaim of the purple block to confirm continuation
⚠️ MEXC:TOSHIUSDT has strong technicals — keep it firmly on your watchlist.
2025 Altcoin LeaderTOSHI, the primary meme on BASE, is tightening up at the end of a 1.5 year base. Looking back at prior leaders like DOGE (2021) and XRP (2017), they based for ~1.5 years before breaking out and going on their huge runs.
BASE likely to lead crypto this year given Coinbase's efforts and connections with Washington and TradiFi firms like BlackRock.
TLong
Round 2TOSHI looks primed for another run. Getting pretty quiet in this base and showing relative strength while sentiment is god awful.
TLong
BUY OPPORTUNITYI see a long position from 0.00043262 all the way to 0.00073280 based on the clear triple bottom denoted in the chart with 3 arrows.
TLong
$TOSHI bounce incoming!I’m expecting a reaction near the previous breakout zone. At the moment, I’m not comfortable holding positions, especially in altcoins, until I see more confirmation. Only a few altcoins have strong structures, but the majority are just P&D setups.
Most meme coins are not worth buying right now, except for some of the newer ones within the $Binance ecosystem. CRYPTOCAP:SOL appears to be forming a new range, so it’s moving slowly there. The only coins I’m currently eyeing are $TOSHI, with pote
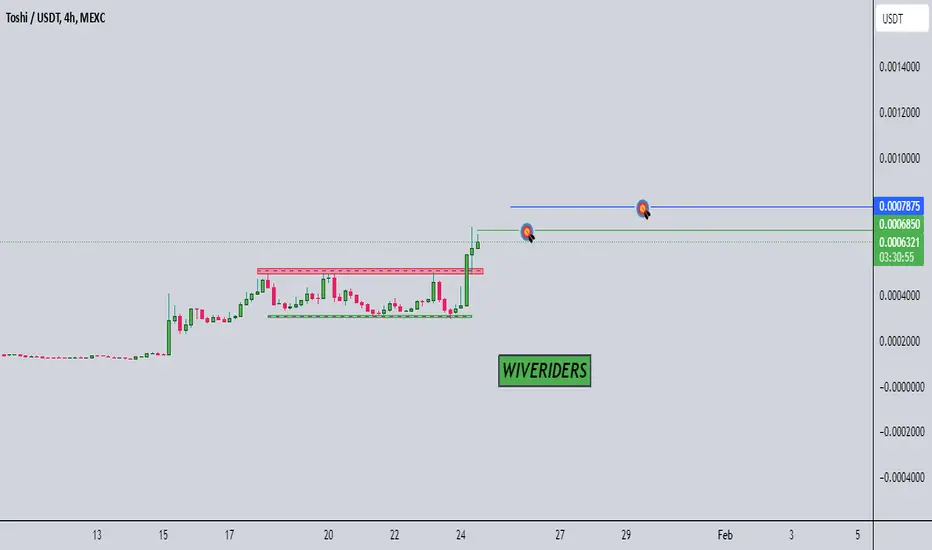
Toshi Bull-Market Signal: 260% Daily Bullish BreakoutThis is a signal signaling the start of the 2025 bull-market. This trading pair, TOSHIUSDT, broke up yesterday and produced a candle that topped at 260%+, within the day.
If we take the 13-Jan. low as the start of the bullish move to the peak yesterday we get a total breakout amounting to 300%. This is seen only and can be seen only within a bull-market. Since it is early, we can take it as the start of the next major bullish move. Early is good.
Join early and you get lower risk and higher po
This Hidden Gem Could Skyrocket 70% – Ultimate Chart BreakdownTraders! Today, we’re looking at a chart that could have huge potential and bring big gains if you know how to play it right. This isn’t just any regular analysis – we’re breaking it down step by step so anyone can follow along. Whether you’re experienced or new to trading, this setup could be a big opportunity. Let’s see what makes this chart so exciting!
1. General Chart Structure
Trend: The chart shows a clear upward momentum following a long period of consolidation. The breakout suggests p
TOSHI TRADE UPDATE. Bullish trade setup for next TOSHI PLAYToshi /usd Long trade setup on the 2 day chart is what im looking for. the last toshi vid i made for the 6hr trade setup play worked out nice , but we want those MULTIPLES ... those X's ... I KNOW I KNOW .. anyway... heres an update on how i see the safest, biggest return on a long play on TOSHI / USD . Patience is your biggest friend right now in my opinion. the reasons are in the vid explaining why the 2 day chart and what free indicators to use for setup rules i think will bring most returns
TLong
my next TOSHI trade move explainedTOSHI has retraced significantly for no reasons other than volatility and speculation imo. I will wait for the bullish confirmations to take place on the 6hr before I position a LONG trade on TOSHI/USD
TLong