ALTSEASON IMMINENT? Altcoins Massive Falling WedgeTOTAL3ESBTC | Altcoin Market vs. Bitcoin | Macro Setup
One of the most important charts I'm watching right now isn't an individual altcoin.
It's TOTAL3ESBTC — the total crypto market capitalization excluding Bitcoin, Ethereum, and stablecoins, measured against Bitcoin.
In simple terms:
When this ratio rises, the broader altcoin market is outperforming BTC.
And right now, the macro structure is getting very interesting.
A Multi-Year Falling Wedge
Since the 2021 cycle, the altcoin market ha
Ratio Total Market Cap Excluding BTC, ETH and Stablecoins to BTC
No trades
No trades
In-depth trading ideas
Smaller AltcoinsThis chart shows total crypto mc excluding Bitcoin Ethereum and all stablecoins / Bitcoin mc . Which is probably shows that we didn’t have altseason like what we used to have since 2021 . The good news is it shows signs of recovery although it’s still very risky, bb squeeze is tight and whichever direction it starts to go it will be explosive .
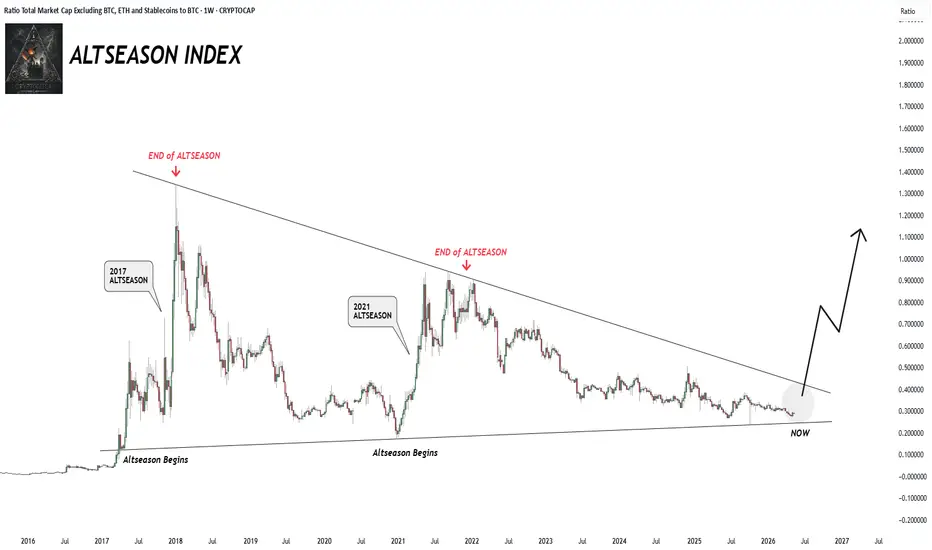
ALTSEASON INDEX TOTAL3/BTC RATIO -ALTSEASON INDEX
If you need everyone to agree, you are already late.
Altseason does not begin when CT is euphoric.
It begins when altcoins look dead against BTC.
2017 started there.
2021 started there.
Now the index is back in the same compression zone.
This is where disbelief turns into rotation.
It starts from BTC-relative compression, when most people think nothing is happening.
That zone is back.
Rotation begins in disbelief.
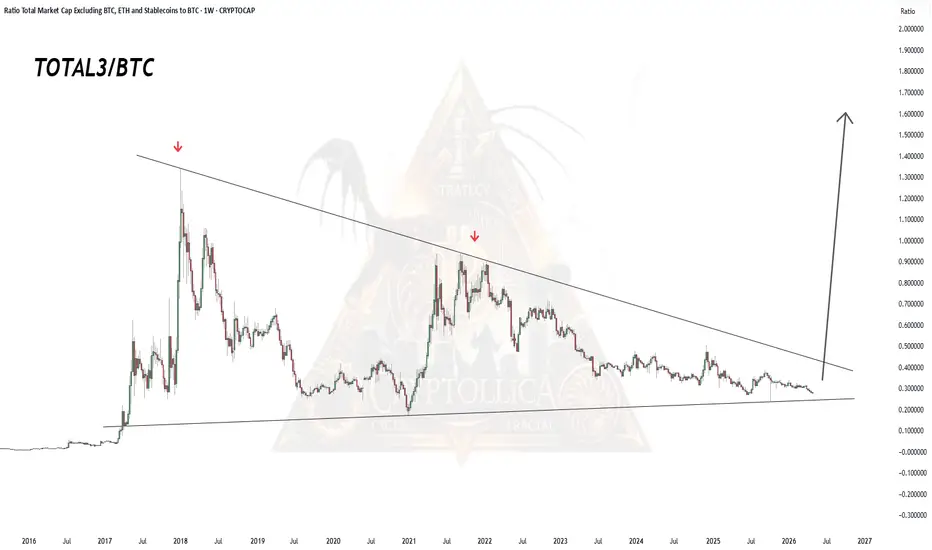
TOTAL3/BTC 8Year Macro CompressionMacro Compression Formation: The most prominent technical structure in the chart is the massive symmetrical compression (or broad descending wedge) formation that has been ongoing since the historical peak in 2018. The red arrows at the top indicate the major rejections the parity faced from the upper dynamic resistance line in 2018 and 2021.
As of now, the price has made a precise touch on the bottom macro support line, which has formed the main backbone of the altcoin market since 2017 and h
ALTSEASON INDEX !!ALTSEASON INDEX
Structure: 2-Week (2W) Altcoin/BTC relative strength ratio chart featuring a multi-year symmetrical triangle (yellow zone).
Symmetrical Compression The ratio has reached the terminal apex of a massive wedge. It is compressed between the descending resistance connecting the Jan 2018 and Nov 2021 cycle tops (red arrows) and the ascending support connecting macro bottoms (green arrows). Technical volatility is completely compressed.
Support Test: The ratio is currently testing
TOTAL3ESBTC Ratio – Watch for Big Moves AheadThe TOTAL3ESBTC chart tracks the total crypto market cap (excluding BTC, ETH, and all stablecoins) divided by Bitcoin's market cap.
Ultimately it shows how the "pure" altcoin sector — all those smaller, higher-risk coins — is performing compared to BTC, stripping out the influence of Ethereum and stablecoins for a cleaner view.
When the ratio climbs, smaller altcoins are gaining ground on Bitcoin, often an early warning of incoming "altseason." When it drops, BTC dominance strengthens and alts
total3esbtcI think in the next few months, liquidity will flow back into Bitcoin. Altseason probably won’t kick in until TOTAL3/ BTC drops to that key 0.2 level. This lines up with the last cycle too — altseason only took off after Bitcoin made a big move to the upside.
Here’s the fundamental breakdown:
1/ Right now, social risk is low — mostly long-term holders are in the game. But with the Fed’s recent rate cut, once Bitcoin makes a strong explosive move up, the hype will return. That’s when the YouTub
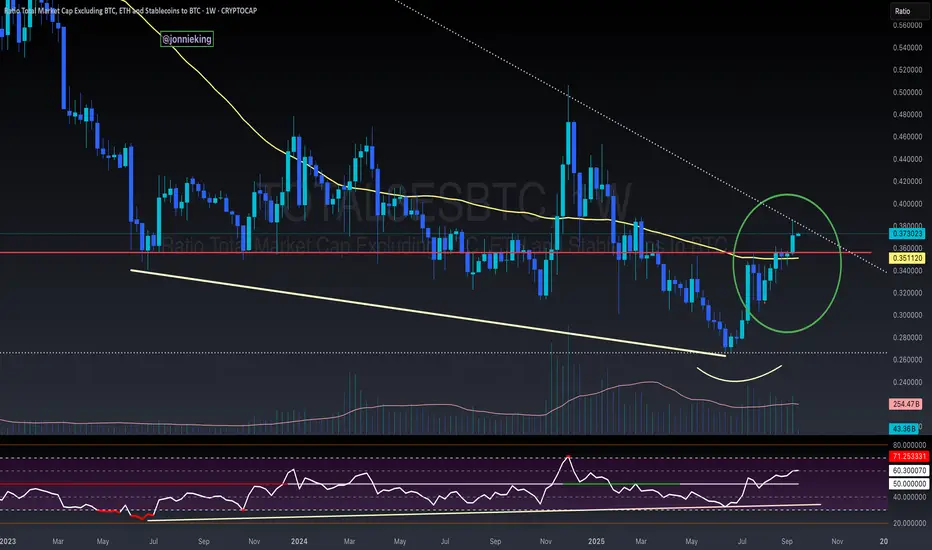
$TOTAL3 / $BTC More Confirmation for Alt Season RotationWe already saw this pattern play out with CRYPTOCAP:TOTAL2 / CRYPTOCAP:BTC and now we have it with CRYPTOCAP:TOTAL3 confirming the rotation into smaller caps.
4th consecutive Weekly close above the 50WMA.
Notice the Bullish Divergence with the RSI.
I’d like to see a few closes above this trend line for added confirmation, but I’m confident we’ve changed the trend.
Note CRYPTOCAP:OTHERS is not there yet, hence why its BTC -> ETH -> Large Caps (SOL).
Double Top (1h)TOTAL3ESBTC has formed and confirmed a textbook double top, with peaks near 0.347821 and a neckline at 0.336428 . The measured move projects a downside target of approximately 0.3250 , aligning closely with prior horizontal support.
Today’s hotter-than-expected PPI report adds macro pressure to an already bearish technical setup, potentially accelerating the move toward the target.
Key Points :
Pattern : Double top
Top : 0.347821
Neckline : 0.336428
Target : 0.3250 ( measured move
TOTAL3 / BTC - ALT SEASON BREAKOUT - Bullish Divergence SpottedBULLISH DIVERGENCE on CRYPTOCAP:TOTAL3 against CRYPTOCAP:BTC 🏁
You will see every time the RSI passed 50 on the Weekly chart in the post-Halving year it signaled Alt Season 🚀
This coincided with 3 tests of this level at 50, with the 3rd test being the real breakout 🤌🏼
Volume confirms change in trend 🏁
AWAITING CONFIRMATION 🚨
🅾️ Close several Weeks above key neckline resistance (currently here)
🅾️ Bullish Cross on the 20 / 50WMA
Is Your Altcoin on the Chopping Block?-Update: Originally posted on July 8, 2025… but swiftly vanished into the void by a moderator (rookie mistake—I neglected the sacred posting rules). Turns out, publishing has rules… that I did not interpret accurately?
To my loyal circle of 5 followers: if this feels like déjà vu, my sincerest apologies for the rerun. But with the winds shifting and the drums beating for alts season, I figured it was worth a resurrection.
Let the thrills—and the calls—begin. 🎭📈
Whenever you see “-Update:” tha
Altseason, just a thought ! Basically, right now we’re chilling in a major confluence zone — a whole bunch of important levels are stacked right here.
We’ve got:
The 0.78 Fib retracement holding it down
Volume profile support giving us a comfy cushion
That good old accumulation support from 2019–2021 saying “welcome back”
…just to name a few.
IMO, we’re in that sneaky “deviation/manipulation” phase before the real markup begins — a.k.a. altseason is warming up in the locker room.
If we actually hit the bull flag target…
Altcoins Near Key Support, Possible -20% Drop before reversal ?Sharing my analysis on the altcoin market cap (excluding BTC, ETH, and stablecoins) compared to BTC over the past 10 years
I have marked important zones (yellow circles) where altcoins have historically bounced after strong corrections.
Current Outlook:
- I expect a possible -20% more downside, bringing it near 0.22, which aligns with a key historical support zone.
- This level has acted as a strong base multiple times, in 2018, 2020 and 2021
What I’m Watching:
- If price reaches that zo
ALTseason May Show Up In 2025We found an interesting chart, which is showing us the ratio of TOTAL3(ALTcoins) market cap against Bitcoin with ticker TOTAL3ESBTC. Well, even this chart is showing that ALTcoins may start outperforming BTC soon. It can be finishing final subwave C of (Y) of a correction in blue wave B that can cause a new strong rally into wave C, which can bring the ALTseason similar as in the beginning 2021.