TRB/USDT — Bullish Reversal Setup After Trendline BreakTRB/USDT has been carving lower highs since the April top near $24, contained inside a clear descending trendline. Price has now broken above that trendline and pulled back to retest the former resistance zone (~$13.5–15.3), which is lining up as new support — a textbook break-and-retest setup.
Key Levels
Resistance-turned-support zone: $13.5 – $15.3
Reclaimed supply zone: $17 – $18
Upside target: $24.8 (prior swing high)
Invalidation: daily close below $13.5
Bias: Bullish while price holds above the retest zone. A move back through $17–18 would open the door toward $24.8.
Risk: Not financial advice. Confirm with volume/momentum before entry and size positions according to your own risk tolerance.
What's your take — trend reversal or just a bounce within the bigger downtrend? Drop your thoughts below. 🚀
In-depth trading ideas
TRBUSDT – Descending Trendline, Is a New Uptrend About to Begin?On the 4-day timeframe, TRB remains in a medium-term downtrend, capped by a Descending Trendline that has been in place since the early 2024 peak. However, recent price action shows growing buying pressure, with the price now testing the trendline as a key resistance level. 👀
If the candle manages to close decisively above the trendline, it could signal that seller dominance is weakening, increasing the probability of a trend reversal. 🚀📈
In addition, an increase in trading volume during the breakout would provide stronger confirmation that buyers are taking control of the market. 💪📊
---
📐 Pattern Formation: Descending Trendline 📉
The primary pattern on this chart is a Descending Trendline, a dynamic resistance line connecting a series of lower highs throughout the downtrend.
✨ Pattern Characteristics:
✅ Indicates that selling pressure is gradually weakening.
✅ The more times the resistance is tested without creating a new lower low, the higher the probability of a breakout.
✅ A valid breakout is typically followed by higher trading volume, a successful retest, and then continued upward momentum. 📈
As long as the price remains below the trendline, the bearish trend is still considered valid. However, a confirmed breakout could mark the beginning of a bullish market structure. 🟢
---
🟢 Bullish Scenario 🚀🐂
The bullish outlook becomes stronger if the price can:
✔️ Break out and close above the Descending Trendline.
✔️ Hold above the breakout area, turning it into a new support level.
✔️ Be accompanied by significantly higher trading volume. 📊
If this scenario unfolds, the next potential resistance targets are:
🎯 Target 1: 23 USDT
🎯 Target 2: 27 USDT
🎯 Target 3: 32 USDT
🎯 Target 4: 38 USDT
🎯 Target 5: 43.40 USDT
🎯 Target 6: 53 USDT
🔥 If bullish momentum continues to build, TRB could gradually recover toward these higher resistance levels.
---
🔴 Bearish Scenario 🐻📉
The bearish scenario remains valid if:
❌ The price fails to break above the Descending Trendline.
❌ A strong rejection occurs at the resistance area.
❌ Buying volume weakens, allowing sellers to regain market control.
📉 If these conditions occur, the price may revisit previous support levels and potentially continue its downtrend if those supports are broken.
⚠️ Therefore, the Descending Trendline is currently the most critical level that will likely determine TRB's direction over the coming weeks.
---
📌 Conclusion 📝
TRB is currently at a very important technical point, as it is testing a Descending Trendline that has capped price action for more than one year. ⏳
🚀 A confirmed breakout could become the first signal of a trend reversal from bearish to bullish.
📉 On the other hand, a failed breakout would increase the likelihood of another corrective move.
💡 Always wait for candle close confirmation and volume confirmation before making any trading decisions.
🛡️ Don't forget to apply proper Risk Management and Money Management to stay disciplined in every trade.
---
⭐ I hope this analysis is helpful. Always do your own research (DYOR) before making any investment decisions.
#TRB #TRBUSDT #Tellor #Crypto #Cryptocurrency #Trading #TradingView #TechnicalAnalysis #PriceAction #Bullish #Bearish #Breakout #Trendline #DescendingTrendline #Altcoins #Binance #Support #Resistance #CryptoTrading #SwingTrading #DYOR #RiskManagement
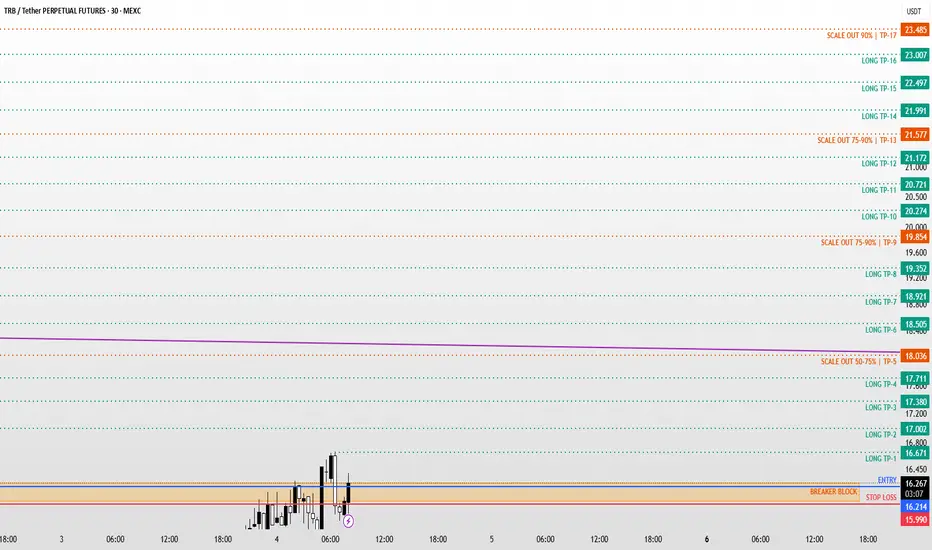
TRB / TRBUSDT Bullish Setup | Futures Trade IdeaMARKET ANALYSIS
TRB is currently reacting from a key technical area highlighted on the chart.
As long as the protected support zone remains intact, the bullish market structure remains valid and higher liquidity targets may continue to attract price action.
A breakdown below the invalidation level would weaken the current bullish scenario and require a reassessment of market conditions.
📍 Entry, Stop Loss and Take Profit levels are marked directly on the chart.
━━━━━━━━━━━━━━
⚠️ DISCLAIMER
This publication is provided solely for educational and market observation purposes.
Nothing contained in this analysis should be considered financial advice, investment advice, or a recommendation to buy or sell any financial instrument.
All trading and investment decisions remain solely the responsibility of the individual trader.
Always conduct your own research and apply proper risk management before entering any position.
━━━━━━━━━━━━━━
🎯 PARALOG
▪️Crypto Market Analysis
▪️BTC Futures Signals
▪️Bitcoin & Altcoin Market Analysis
Precision • Momentum • Timing
━━━━━━━━━━━━━━
Exchange: #MEXC Futures
#bitcoin #btc #crypto #futures #technicalanalysis
TRB is approaching the buyers' zone (1W)The correction in TRB appears to have started from the point marked by the red arrow on the chart.
This correction looks to be forming a Diametric pattern, and we believe the price is currently in Wave E of this formation. Given the strong selling pressure throughout this wave, we are only interested in buying within the green zone, not at higher prices.
If we see bullish reversal patterns, confirmations, or a valid entry trigger inside the green zone, it will provide a much safer long opportunity.
The profit targets are marked on the chart. Once Target 1 is reached, move your stop-loss to break-even to protect your position.
This analysis will be invalidated if a weekly candle closes below the invalidation level.
If you have a coin or altcoin you want analyzed, first hit the like button and then comment its name so I can review it for you.
Do you also think Tellor is bullish?
Tellor (TRB): Long-term bottom accumulation zone activatedA long-term support range which launched the previous bull market has been activated/challenged once on a wick last year and this year very briefly on two wicks.
After almost an entire year of fluctuations close to present price levels years ago, TRBUSDT (Tellor) produced a bullish cycle with more than 9,000% total growth.
The level in question was activated eight months ago and so at anytime time a similar event, a new bullish cycle can develop. Don't get me wrong, there can be more fluctuations or even months of sideways, up and down, and so on, but once the market turns bullish it will grow non-stop. We are entering the buy and accumulation zone.
This is a decent chart setup but buying here should be done spot while focusing on the long-term. Only later this year should we be more focused on short- to mid-term action but right now there is still some more waiting to do when it comes to this project.
This and others, there are always strong variations, can grow 100%, 200%, even 500% or more, but then they move back down and so on. The process continues until finally we get to the bull market with marketwide bullish action. It can start later this year but surely in 2027 we get to see green all across.
For now, only certain groups get to grow depending on the chart structure and positive conditions related to individual projects. There can be dozens growing but many more stay behind. Choose wisely I say and make sure to plan your strategy before buying; short or long-term? Leverage or spot? Investing or trading?
Patience is key.
Namaste.
$TRBUSDT : Breaking the Macro FractalBINANCE:TRBUSDT has broken out of an 840-day descending wedge, mirroring the 2021–2023 accumulation structure that triggered a massive rally.
Price reclaimed the key $20.56 breakout zone while weekly RSI moved above 50, keeping higher targets open if the 200 EMA holds.
Fundamentally, Tellor strengthened after the v6.1.5 upgrade and TokenBridge V2 rollout, improving cross-chain oracle security. Ongoing development and expanding DeFi integrations continue attracting long-term institutional interest.
TRBUSDT Forming Bullish MomentumTRBUSDT is forming a clear bullish momentum pattern, a classic bullish wave signal that often indicates an upcoming breakout. The price has been consolidating within a narrowing range, suggesting that selling pressure is weakening while buyers are beginning to regain control. With consistent volume confirming accumulation at lower levels, the setup hints at a potential bullish breakout soon. The projected move could lead to an impressive gain of around 50% to 60% once the price breaks above the wedge resistance.
This bullish momentum pattern is typically seen at the end of downtrends or corrective phases, and it represents a potential shift in market sentiment from bearish to bullish. Traders closely watching TRBUSDT are noting the strengthening momentum as it nears a breakout zone. The good trading volume adds confidence to this pattern, showing that market participants are positioning early in anticipation of a reversal.
Investors’ growing interest in TRBUSDT reflects rising confidence in the project’s long-term fundamentals and current technical strength. If the breakout confirms with sustained volume, this could mark the start of a fresh bullish leg. Traders might find this a valuable setup for medium-term gains, especially as the wedge pattern completes and buying momentum accelerates.
✅ Show your support by hitting the like button and
✅ Leaving a comment below! (What is your opinion about this coin?)
Your feedback and engagement keep me inspired to share more insightful market analysis with you!
TRB/USDT – Downtrend Under Pressure, Is a Breakout Imminent?On the TRB/USDT 4D timeframe, it is clearly visible that price is still within a strong long-term downtrend, marked by a descending trendline (yellow line) that has consistently acted as resistance since the previous peak.
However, price is now approaching a crucial area that could determine the next major move.
---
📊 Structure & Key Pattern
Pattern: Descending Trendline / Falling Resistance
Price continues to form lower highs & lower lows → confirms bearish structure
A compression / tight consolidation is forming near the trendline → potential breakout signal
Horizontal dashed lines represent layered supply & resistance zones
---
📍 Key Levels
Resistance levels:
23.00
27.00
32.00
38.00
43.40
53.00 (major resistance)
Support levels:
17.00 – 18.50 (current demand zone)
13.50 (lower support if breakdown occurs)
---
🚀 Bullish Scenario
Bullish confirmation occurs if:
Price breaks and closes strongly above the descending trendline
Supported by increasing volume (valid breakout)
Upside targets:
23.00 → initial resistance
27.00 → continuation confirmation
32.00 – 38.00 → mid-range targets
43.40 – 53.00 → major recovery zone
📌 A valid breakout could signal the beginning of a medium-term trend reversal
---
📉 Bearish Scenario
Bearish bias remains if:
Price fails to break the trendline
Strong rejection occurs around 21.00 – 23.00
Downside potential:
Retest 17.00
Breakdown → continuation to 13.50
📌 As long as price stays below the trendline, the primary trend remains bearish
---
⚠️ Key Insight
Price is currently in a decision zone
The longer price compresses below resistance → the stronger the potential breakout
The next move is likely to be explosive
---
🧠 Conclusion
TRB/USDT is at a critical point between continuation of the bearish trend and a potential bullish reversal. A breakout above the descending trendline will be the key signal for a shift in market direction.
#TRBUSDT #CryptoAnalysis #TechnicalAnalysis #Altcoins #BreakoutSetup #DescendingTrendline #BullishScenario #BearishScenario #CryptoTrading #PriceAction #MarketStructure
TRBUSDT Strong Bull Breakout TRBUSDT trades at 16.86 spot against 16.85 futures, near-zero premium. F/S ratio at 21.51x V.High with futures dollar volume at 39.23M against spot at 1.82M, thin spot market with futures dominant. Leverage at 21.5x V.High but Percentile at 5.3% Floor, AT Max was 1888.12x 872 bars ago showing extreme historical leverage events long behind it. Price at 12.8% Floor in the 200-bar range, AT Min at 7.01x just 977 bars ago, leverage unwinding has been sustained and deep.
36 of 112 signals bull against 13 bear with Clarity at 44%. EMA 7:1 clean, Ichi TK 10:4 solidly bull, C>T 9:5 confirming price above Tenkan on most timeframes. Candle 7:3 with 1 Star confirmation. SS/DD 3 demand against 10 supply, heavy overhead resistance is the primary structural headwind. Spread at 46.9% Strong. Price squeeze just FIRED with momentum Bull up and BW at 22.27% Normal, volatility expansion beginning from a compressed state.
Spot Z -0.77 Quiet and Futures Z -0.86 Quiet combine into F+S Z -0.86, volume remains subdued despite the squeeze fire. S.Mom Con down at 122.7% Coiling confirms volume has not yet expanded to match the price move. Spot:Fut Normal, Direct Neutral, Bull:Bear Z -0.42 against -0.57 both negative, no volume conviction behind the breakout yet.
Leverage Percentile at 5.3% Floor with sustained unwinding from 1888x peak to current 21.5x over 872 bars, one of the longest deleveraging sequences in this scan. OBV Z -1.17 Inflow is the key read, negative score but slope rising, quiet accumulation building while price sits at historical lows.
Retrace -1.3% Extreme BO with Bounce at 27.2% 21.2x Para is the standout number. Price has bounced 21 times the retrace distance from the low, a parabolic recovery structure. Combined with squeeze just firing and EMA 7:1 bull, the momentum structure is constructive.
The honest read: TRBUSDT has one of the cleaner setups in this batch. Squeeze fired, leverage at floor, parabolic bounce ratio, and sustained deleveraging all point in the same direction. The negatives are 10 supply zones overhead, thin spot volume, and 44% clarity meaning higher timeframes have not fully aligned. Volume is the missing confirmation — S.Mom Coiling means the squeeze fire has not yet attracted real participation. Watch for spot volume expansion on the next candle before sizing in, the structure is right but the fuel is not yet ignited.
Is That Crypto Pump Real? Data Says No. Here's Why.
Stop Losing Money to Fake Volume. Find Real Moves Now.
Trade the REAL Crypto Volume. Stop Getting Faked Out.
TRB / USDT on the verge of Trendline BreakdownTRB/USDT is currently testing a key trendline support and approaching a decisive zone. A confirmed breakdown below this level could trigger further downside momentum toward the $14.65 region.
Wait for a clean confirmation before entering, as fake breakdowns are possible near such levels. Always manage risk wisely and avoid early entries.
TRB Ready to Explode... or Crash?Yello Paradisers, are you watching what’s unfolding on TRB/USDT right now? After weeks of steady bleeding, the price has finally arrived at a critical decision point. This isn’t just another dip; this is a major support test, and what happens next could shape the next big move.
💎#TRBUSDT has been trading inside a well-defined descending channel, with the price respecting both resistance and support trendlines in a clean, controlled structure. At the time of writing, #TRB is sitting precisely on the lower boundary of that formation, rebounding off the $12.70 zone, a level we've had marked as key support.
💎What makes this moment even more interesting is the presence of bullish divergence on the MACD indicator. This is often a strong early signal that downside momentum is fading, and that a reversal could be in play if bulls respond with strength.
💎However, this setup only becomes valid with a confirmed breakout above the descending channel, followed by a successful retest of the broken resistance. Without that retest holding with momentum, any breakout would likely be a trap. If the structure holds, the first major resistance comes in at $16.76. If momentum carries further, the next logical targets are the $23.60 to $24.48 zone, where profit-taking pressure could start to build.
💎On the flip side, all bullish expectations are invalidated if #TRB breaks below $9.91. A breakdown beneath this level would mark a failure of the current structure and likely trigger deeper downside movement. Until that happens, this remains a high-probability setup that deserves full attention.
🎖Strive for consistency, not quick profits. Treat the market as a businessman, not as a gambler.
MyCryptoParadise
iFeel the success🌴
TRB Holding Falling Wedge SupportTRB is trading inside a clearly defined falling wedge on the daily timeframe. Price is currently positioned near the lower boundary of the wedge, which has acted as support multiple times in the past. This area is important, as falling wedges often show slowing downside momentum near their base.
As long as price holds above this lower trendline, the structure remains constructive and allows for a potential rotation back toward the upper resistance of the wedge. A strong bounce from this zone would be an early sign of buyers stepping in, while a confirmed breakout above the upper trendline would signal a larger trend shift.
If price loses the lower wedge support decisively, the bullish structure would weaken and could open room for further downside toward the next demand zone. For now, TRB is sitting at a key support area where direction is likely to be decided.
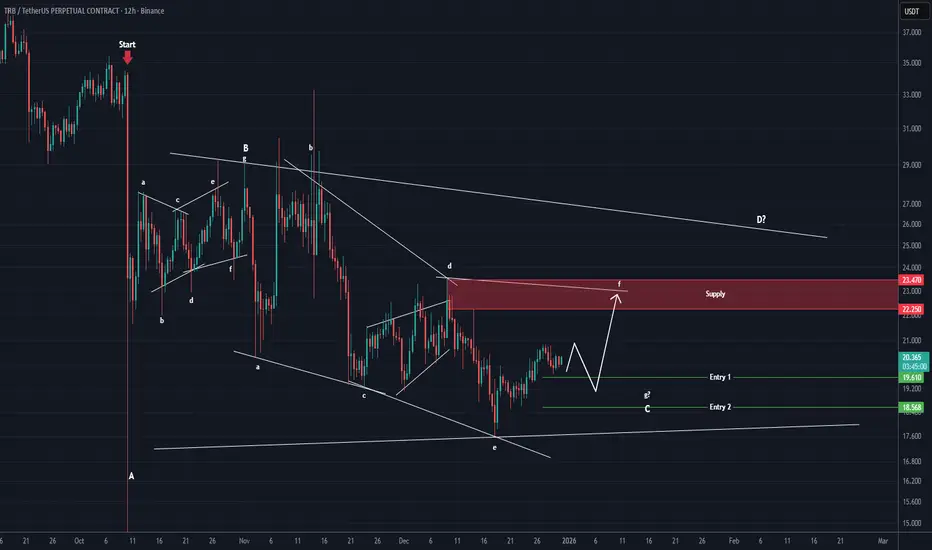
TRB Analysis (12H)From the point where we placed the red arrow on the chart, it appears that a triangle or a more complex pattern is forming on the TRB chart.
At the moment, we seem to be in wave C, which is either a diametric or a symmetrical pattern. Looking more closely, we are in wave f of wave C.
We have marked two green entry points where the position should be entered using DCA.
The targets have been marked on the chart.
A daily candle close below the invalidation level will invalidate this analysis
invalidation level: 17.818$
If you have a coin or altcoin you want analyzed, first hit the like button and then comment its name so I can review it for you.
This is not a trade setup, as it has no precise stop-loss, stop, or target. I do not publish my trade setups here.
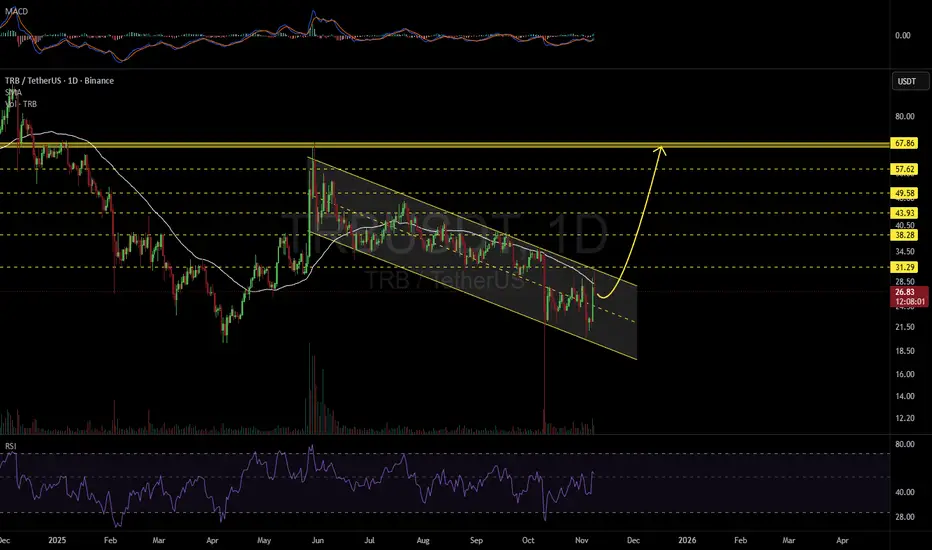
TRBUSDT 1D#TRB has been moving inside a descending channel on the daily chart for a long time. Time to move up! In case of a breakout above the channel and the daily SMA100, the potential targets are:
🎯 $31.29
🎯 $38.28
🎯 $43.93
🎯 $49.58
🎯 $57.62
🎯 $67.86
⚠️ Always remember to use a tight stop-loss and maintain proper risk management.
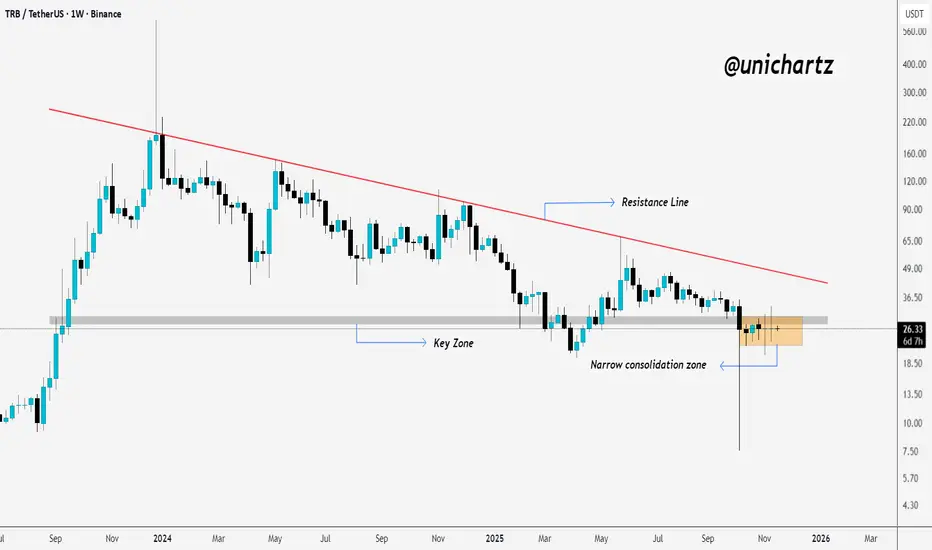
TRB Squeezing Into a Tight RangeLSE:TRB is holding above a key support zone while trading under a long-term downtrend line.
Price is stuck in a narrow consolidation, suggesting a bigger move is building.
A breakout from this range will likely decide the next direction.
DYOR, NFA
Please hit the like button if you like it, and share your views in the comments section.
TRBUSDT Forming Bullish Reversal TRB/USDT is setting up a potentially bullish reversal scenario, with price action forming a falling wedge pattern that suggests compression followed by an uplift. The pair has seen tightening price swings, several rejections of the lower trendline, and increasing volume, which indicates accumulation and heightened interest from traders. If that upper trendline breaks with strength, we could be looking at a significant breakout opportunity.
On the fundamentals side, TRB (Tellor) operates in the oracle services niche—keywords like decentralized oracle, data-feeds, blockchain infrastructure aggregator are highly searched right now. The project has a clear use-case in providing off-chain data for smart contracts, which is increasingly relevant as DeFi continues to evolve and demand for robust oracles grows. With an existing track record and evolving ecosystem, TRB is starting to draw more attention from investors seeking infrastructure tokens that support the blockchain stack.
From a strategy perspective, the trigger for me would be a breakout above the wedge’s upper trendline confirmed by a strong volume candle and subsequent retest of the breakout level acting as support. That entry offers favourable risk-to-reward, since the lower trendline or recent swing low provides a tight invalidation point. If the breakout holds, the price could push toward previous highs or liquidity zones, delivering attractive upside relative to the defined risk.
TRBUSDT 1D#TRB is currently trading within a descending channel on the daily chart. In case of a breakout above the daily SMA50 and the channel resistance, the potential upside targets are:
🎯 $31.29
🎯 $38.28
🎯 $43.93
🎯 $49.58
🎯 $57.62
🎯 $67.86
⚠️ Always remember to use a tight stop-loss and maintain proper risk management.
#TRB/USDT About to Explode or Fake Out Everyone Again ?#TRB
The price is moving within a descending channel on the 1-hour frame, adhering well to it, and is heading for a strong breakout and retest.
We have a bearish trend on the RSI indicator that is about to be broken and retested, which supports the upward breakout.
There is a major support area in green at 30.00, representing a strong support point.
We are heading for consolidation above the 100 moving average.
Entry price: 32.00
First target: 33.28
Second target: 34.50
Third target: 36
Don't forget a simple matter: capital management.
When you reach the first target, save some money and then change your stop-loss order to an entry order.
For inquiries, please leave a comment.
Thank you.
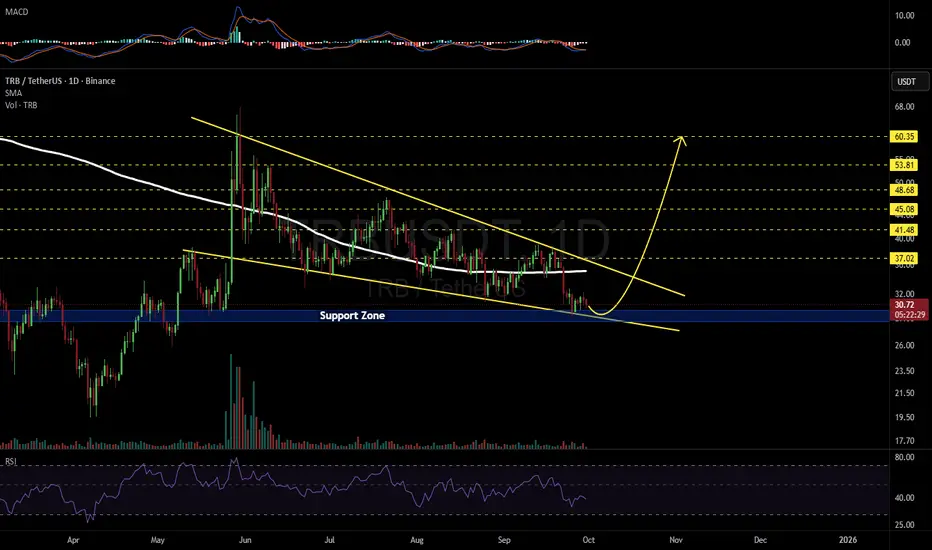
TRBUSDT 1D#TRB is moving inside a falling wedge pattern on the daily chart. We can be bullish if it manages to hold the support zone and break above the wedge resistance and the daily SMA200. In that case, the potential targets are:
🎯 $37.02
🎯 $41.48
🎯 $45.08
🎯 $48.68
🎯 $53.81
🎯 $60.35
⚠️ Always remember to use a tight stop-loss and follow proper risk management.