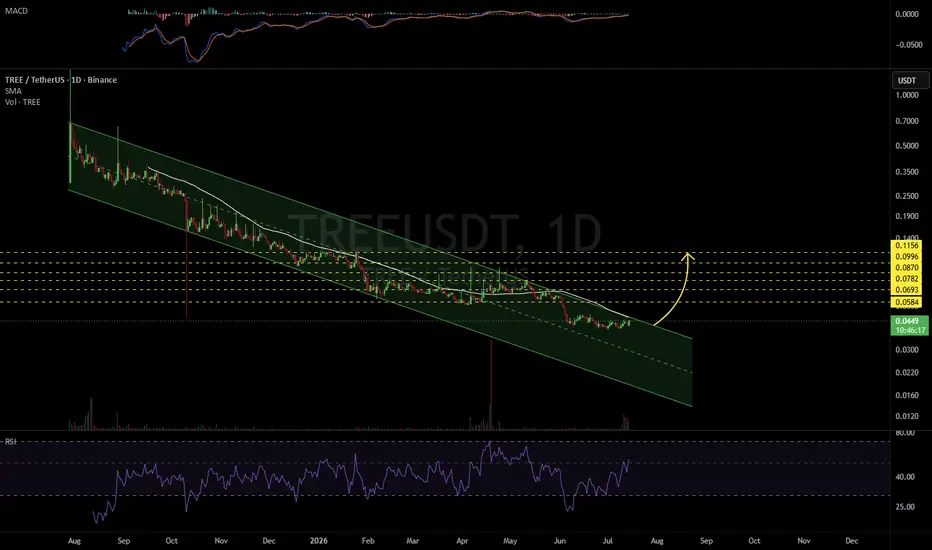
TREEUSDT 1D#TREE is attempting to break out above the long-term descending channel resistance and the daily SMA50.
If the breakout is confirmed, the potential upside targets are:
🎯 $0.0584
🎯 $0.0693
🎯 $0.0782
🎯 $0.0870
🎯 $0.0996
🎯 $0.1156
⚠️ Always remember to use a tight stop-loss and maintain proper risk
TREEUSDT Forming Bullish MomentumTREEUSDT is forming a clear bullish momentum pattern, a classic bullish wave signal that often indicates an upcoming breakout. The price has been consolidating within a narrowing range, suggesting that selling pressure is weakening while buyers are beginning to regain control. With consistent volume
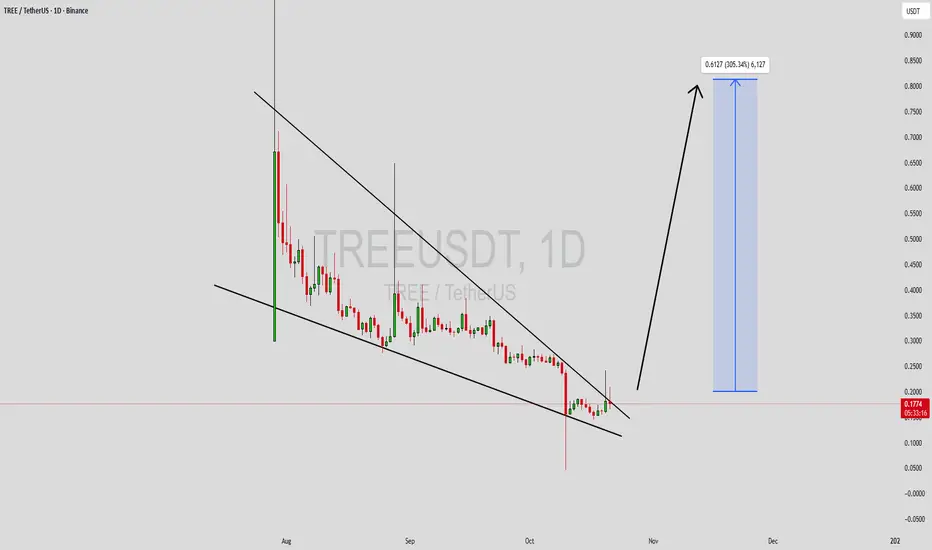
TREEUSDT Forming Falling WedgeTREEUSDT is forming a clear falling wedge pattern, a classic bullish reversal signal that often indicates an upcoming breakout. The price has been consolidating within a narrowing range, suggesting that selling pressure is weakening while buyers are beginning to regain control. With consistent volum
TREEUSDT Forming Falling WedgeTREEUSDT is currently forming a falling wedge pattern, which is often recognized as a strong bullish reversal signal in technical analysis. This pattern usually occurs after a prolonged downtrend, signaling that selling pressure is weakening and a potential breakout is on the horizon. The good tradi
TREEUSDT 1D#TREE is moving inside a descending channel on the daily chart. In case of a breakout above the channel resistance, the potential targets are:
🎯 $0.2238
🎯 $0.2701
🎯 $0.3469
🎯 $0.4090
🎯 $0.4711
🎯 $0.5594
🎯 $0.6720
⚠️ Always remember to use a tight stop-loss and maintain proper risk management.
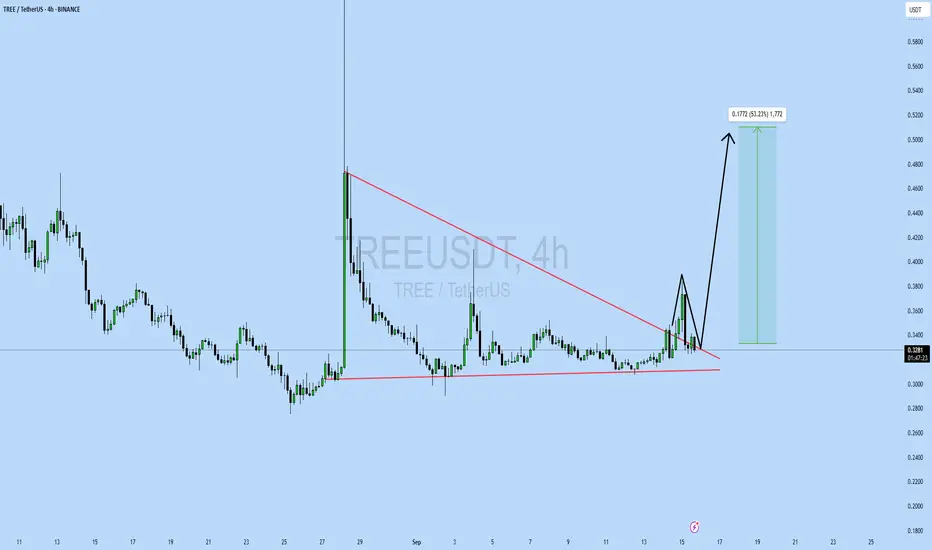
TREEUSDT Forming Potential BullishTREEUSDT is currently displaying a strong technical setup that suggests a potential bullish breakout. After a long consolidation phase, the chart is shaping into a clear wedge structure, supported by steady volume. Such patterns often act as continuation signals, and with the current market sentimen
TREEUSDT UPDATE#TREE
UPDATE
TREE Technical Setup
Pattern: Bullish Falling Wedge Pattern
Current Price: $0.328
Target Price: $0.505
Target % Gain: 53.23%
NASDAQ:TREE is breaking out of a falling wedge on the 4H timeframe. Current price sits at $0.328 with a projected move toward $0.505, giving over 53% potent
See all ideas
Summarizing what the indicators are suggesting.
Oscillators
Neutral
SellBuy
Strong sellStrong buy
Strong sellSellNeutralBuyStrong buy
Oscillators
Neutral
SellBuy
Strong sellStrong buy
Strong sellSellNeutralBuyStrong buy
Summary
Neutral
SellBuy
Strong sellStrong buy
Strong sellSellNeutralBuyStrong buy
Summary
Neutral
SellBuy
Strong sellStrong buy
Strong sellSellNeutralBuyStrong buy
Summary
Neutral
SellBuy
Strong sellStrong buy
Strong sellSellNeutralBuyStrong buy
Moving Averages
Neutral
SellBuy
Strong sellStrong buy
Strong sellSellNeutralBuyStrong buy
Moving Averages
Neutral
SellBuy
Strong sellStrong buy
Strong sellSellNeutralBuyStrong buy
Displays a symbol's price movements over previous years to identify recurring trends.