TRUMP Reclaims Key SupportTRUMP has shown early signs of strength after reclaiming the higher-timeframe support around the $1.50 region. This reclaim is an important technical development, as it suggests buyers are beginning to regain control following an extended period of selling pressure. The focus now shifts to whether price can establish a solid base above this level.
Holding above $1.50 would increase the probability of a rotational move toward the next major high-timeframe resistance around $1.80. A sustained recovery from current levels could also trigger a short squeeze, as traders holding short positions may be forced to cover if bullish momentum continues to build. Given the aggressive nature of the preceding downtrend, even a modest shift in sentiment could result in a sharp relief rally.
However, for the bullish scenario to develop, trading volume must support the move. Strong volume would confirm genuine buying interest and improve the likelihood that the rally can extend beyond the initial resistance. Without increased participation, the recovery risks becoming another temporary bounce within the broader trend.
For now, the technical outlook has improved following the reclaim of support. As long as TRUMP continues to hold above $1.50, the probability favors a move toward $1.80, with volume remaining the key factor that will determine whether the recovery develops into a sustained bullish continuation.
In-depth trading ideas
TRUMP: Attention Became LiquidityTRUMPUSDT is trading around $1.69, and the chart still looks heavy despite being in discount.
The important part is the overhead supply stack.
Price is below:
EMA20: $1.77
EMA50: $1.96
EMA200: $3.46
That keeps the broader structure bearish until proven otherwise.
The main decision zone is the bearish order block between $1.94 and $2.12. That zone also lines up with the active descending resistance structure, which is why I am not treating every bounce as a reversal.
The money-flow angle
The bigger story here is not that Trump made crypto money by perfectly timing the market.
The reported 2025 crypto windfall appears to come mainly from brand monetization: memecoin royalties, World Liberty token-sale distributions, equity/unit-sale proceeds, and stablecoin-related business activity.
That matters for traders because celebrity and political tokens often work differently from normal crypto investing.
The issuer monetizes attention.
Retail often provides the liquidity.
The chart later decides who is left holding risk.
The Technical Reality
Bearish signals:
Price below EMA20, EMA50, and EMA200
Bearish OB overhead at $1.94-$2.12
Unfilled bearish FVG at $1.77-$1.84
MACD remains bearish
Volume is below average
Descending resistance still active near $1.94
Bullish signals:
Price is in discount
Higher low structure still exists
Ascending support from $1.29-$1.52 is still relevant
Stochastic is not stretched upward
The Trade Setup
My base case is simple: sell the rally if price rejects the $1.94-$2.12 supply zone.
Target:
First downside magnet: $1.49
If $1.49 breaks: weak-low sweep/liquidity hunt
Invalidation:
4H close above $2.12
If TRUMP reclaims $2.12, the bearish order block is no longer controlling the chart, and the setup needs to be reassessed.
My Verdict
TRUMP can bounce, but the chart has not earned a bullish reversal yet.
Until $2.12 is reclaimed, rallies still look like liquidity tests into supply rather than confirmed accumulation.
The headline says “over $1B in crypto.”
The chart says: be careful who is supplying the exit liquidity.
Are you fading the $2.12 zone, or waiting for a reclaim first?
Not financial advice. Always manage risk.
TRUMP IN STRONG ACCUMULATION ZONEI still believe $TRUMP has strong long-term potential.
Possibly bottom is in for TRUMP…
When momentum fully returns, this coin could move aggressively and surprise a lot of people.
The current phase feels more like accumulation than weakness.
For anyone looking at long-term plays, $TRUMP is definitely one to watch closely. Once the real breakout starts, it may not respect many resistance levels on the way up. 🚀
If it breaks out and continue to hold above 1.5$ on HTF…. then it can shoot 15$ - 18$…
macro invalidation - monthly close below 1.5$…
lets see how it goes…
OFFICIAL TRUMP First Higher Low, 1,000% Uptrend Starts Now!The recovery witnessed two weeks ago is turning out to be the real deal—this is big. With the end of the downtrend, the bear market, we get a new market trend and this means years of sustained bullish action. $14 & $22.2 on TRUMPUSDT would only be easy targets, it can take months to get there.
Notice the downtrend. Just the last portion, October 2025 through June 2026, lasted eight months. This is just one portion and it goes for so long. Now think of the same but in reverse. We can see 4, 6, 8 months of sustained bullish action; a pause, correction or retrace followed by additional growth. We have Bitcoin as a great example.
We saw how Bitcoin grew 90 days non-stop, February through May, the correction lasted only 30 days, May through June, now we get growth again. The beauty of the bull market is that each bullish wave is set to last 2-3 times longer compared to a corrective wave. Again Bitcoin's example: 1 month bearish, 3 months bullish and now we get another 3-4 months bullish or more.
These numbers are just examples and approximations, we are building a long-term map. The bullish wave that is starting now can easily last 6 months of more, higher highs and higher lows. It also depends on the trading pair in question. A project like this one, TRUMPUSDT, can produce sustained growth because of the prolonged bearish period that preceded it. The market always seeks balance.
We will aim for 237% as the easy target, ~$6.50. We will aim for 660% as the main conservative target for this bullish wave. We will secure 1,000% profits potential when TRUMPUSDT reaches $22.2 long-term, with 100% certainty of course, the bull market is confirmed through the end of the bear market. It is now or never. Early is better than late.
Thank you for reading.
Namaste.
TRUMPUSDT Forming Falling WedgeTRUMPUSDT is forming a clear falling wedge pattern, a classic bullish wave signal that often indicates an upcoming breakout. The price has been consolidating within a narrowing range, suggesting that selling pressure is weakening while buyers are beginning to regain control. With consistent volume confirming accumulation at lower levels, the setup hints at a potential bullish breakout soon. The projected move could lead to an impressive gain of around 90% to 100% once the price breaks above the wedge resistance.
This falling wedge pattern is typically seen at the end of downtrends or corrective phases, and it represents a potential shift in market sentiment from bearish to bullish. Traders closely watching TRUMPUSDT are noting the strengthening momentum as it approaches a key breakout zone. The healthy trading volume adds confidence to this setup, showing that market participants may be positioning early in anticipation of a trend reversal.
Investors' growing interest in TRUMPUSDT reflects increasing confidence in the coin's current technical structure and potential upside. If the breakout confirms with sustained volume, it could signal the beginning of a strong bullish leg. Traders may find this an attractive setup for medium-term gains, especially as the falling wedge pattern nears completion and buying momentum starts to accelerate.
A confirmed breakout above resistance could attract additional buyers and further strengthen bullish sentiment. As momentum builds, TRUMPUSDT could become one of the more closely watched opportunities among traders looking for high-upside setups in the current market environment.
✅ Show your support by hitting the like button!
✅ Leave a comment below! (What is your opinion about this coin?)
Your feedback and engagement keep me inspired to share more insightful market analysis with you!
$TRUMP volume just exploded 541% in a single day — and.....🔥 $TRUMP volume just exploded 541% in a single day — and most traders are still asking "is this real?"
The ones asking that question are the ones who'll chase at the top. The setup is happening right now at the pullback, not the pump.
📰 24H NEWS SNAPSHOT
GetTrumpMemes announced a new exclusive Mar-a-Lago gala luncheon for the top 297 $TRUMP holders — the same event structure that triggered a 35–54% surge in March 2026.
24H volume hit $598M, up 541% from the prior day.
Daily token unlocks of ~900K TRUMP from vesting schedules are adding drip supply — but today's demand completely overwhelmed it. Watch the unlock schedule; it's a quiet headwind on every rally per on-chain tracking.
📊 MARKET BIAS
Bullish short-term — event-driven catalyst, volume confirmation, and price pulling back into a clean demand zone.
🎯 TRADE LEVELS
📍 Entry Zone: $2.015 – $2.060
🛑 Stop Loss: $1.915 (-5.0% | Risk: max 1–2% of portfolio)
🎯 TP1: $2.241 (+11.2% | 2.2:1 RR)
🎯 TP2: $2.515 (+24.8% | 5.0:1 RR)
📐 Overall R:R: up to 5:1
🧠 CHART ANALYSIS
$TRUMP spiked to $2.388 on the news catalyst, then pulled back into a defined support zone ($2.060–$1.968) — this is a classic buy-the-news-pullback setup.
The 1H chart shows the support zone held as a prior consolidation base before the breakout. Entry at $2.015 sits inside the demand zone with the stop cleanly below the structure low at $1.915. TP1 at $2.241 reclaims the recent high; TP2 at $2.515 is the next resistance cluster. Invalidation: clean 1H close below $1.915.
🛡️ RISK MANAGEMENT TIP
Meme coins move fast in both directions — this is NOT a set-and-forget trade.
Use a hard stop at $1.915 and consider taking 50% off at TP1 ($2.241). Never size in large on politically-driven meme tokens. 1–2% of portfolio max.
📚 EDUCATIONAL NUGGET
A 541% volume spike on a meme coin is called a "volume catalyst event" — it signals a new wave of buyers entering, not just existing holders moving coins.
When volume leads price, the move tends to have follow-through. When price leads volume (no spike), it's usually a fakeout. Know the difference.
🔁 Most traders saw the 19% pump and froze — waiting for a "safer" entry that already passed. The pullback to $2.015 was the setup.
The 541% volume spike already told you the direction.
💬 Are you buying the pullback or waiting for a new high? Drop your level 👇
#TRUMP #OfficialTrump
TRUMPUSDT 1D#TRUMP is currently trading within a descending channel on the daily chart and has bounced from the channel support.
In case of a breakout above both the channel resistance and the Ichimoku Cloud, the following upside targets could come into play:
🎯 $2.518
🎯 $2.811
🎯 $3.103
🎯 $3.518
🎯 $4.048
⚠️ Always remember to use a tight stop-loss and maintain proper risk management.
TRUMP - Descending Trendline, – Reversal or Temporary Bounce?On the 3-Day (3D) timeframe, TRUMP/USDT remains in a medium- to long-term downtrend, marked by a prominent Descending Trendline (yellow line) connecting a series of lower highs since the all-time high. 📉
Currently, price is trading near a major support zone and has started showing a bullish reaction after touching the low area around 1.49 USDT. 🟢
As price approaches the end of the descending trendline, it enters a critical area that often leads to significant volatility expansion and a potential trend-defining move. ⚡
This chart suggests that TRUMP is now testing the primary trendline resistance that has suppressed price action for several months. 🎯
---
📐 Pattern Formation
🔻 Descending Trendline (Bearish Structure)
The dominant pattern on this chart is a Descending Trendline, indicating that sellers have maintained control of the market throughout the broader trend. 🐻
📌 Pattern Characteristics:
✅ A sequence of Lower Highs has been established.
✅ Selling pressure remains dominant, although it appears to be gradually weakening.
✅ The longer price trades below the trendline, the stronger the potential breakout can become once resistance is successfully breached.
✅ The current structure may represent an accumulation phase following an extended decline.
Price is now approaching a critical decision point where breakout probabilities are beginning to increase. 🚀
---
🟢 Bullish Scenario
🚀 Bullish Trigger: Descending Trendline Breakout
The bullish outlook becomes significantly stronger if the 3D candle can:
✅ Break above the descending trendline.
✅ Close above the 2.47 USDT resistance level.
✅ Show increasing trading volume during the breakout. 📊
✅ Form a higher low after the breakout confirmation.
If a breakout is confirmed, the next upside targets are:
🎯 Target 1: 2.87 USDT
🎯 Target 2: 3.85 USDT
🎯 Target 3: 4.81 USDT
🎯 Target 4: 5.72 USDT
💡 These levels represent major horizontal resistance zones that previously acted as key supply and distribution areas.
If bullish momentum accelerates, a move toward 5.72 USDT could generate a substantial rally from current price levels. 📈🔥
---
🔴 Bearish Scenario
⚠️ Rejection from the Descending Trendline
The bearish scenario remains the primary risk as long as price fails to break out of the long-term downtrend structure.
🚨 Bearish Signals:
❌ Failure to break above the descending trendline.
❌ Strong rejection around the 2.47 USDT resistance zone.
❌ Weakening buying volume.
❌ Formation of another lower high.
If these conditions occur, price may revisit:
📉 First Support: 1.70 USDT
📉 Major Support: 1.49 USDT
A breakdown below 1.49 USDT would increase the probability of creating a new lower low and extending the bearish trend that has been in place since the asset's launch. 🐻⚡
---
🎯 Conclusion
TRUMP/USDT is currently trading at one of its most important technical levels since entering its prolonged downtrend. 🔥
🔹 Price is testing the major Descending Trendline resistance.
🔹 The 2.47 USDT level serves as the key breakout confirmation zone.
🔹 As long as price remains above the recent low, recovery potential remains intact.
🔹 A successful trendline breakout could trigger a bullish rotation toward the 2.87 – 5.72 USDT range. 🚀
🔹 However, until a breakout is confirmed, the overall market structure remains bearish, and further downside risk should not be ignored. ⚠️
📌 Traders may prefer waiting for a confirmed breakout rather than entering aggressively before the primary resistance is successfully cleared.
#TRUMPUSDT #TRUMP #Crypto 🚀 #Cryptocurrency 💰 #TechnicalAnalysis #Altcoin #BullishBreakout 🟢 #BearishTrend 🔻 #DescendingTrendline #TrendlineBreakout #PriceAction #CryptoTrading 📈 #SupportAndResistance #MarketStructure #SwingTrading #Altcoins
$TRUMP Showing Strong Bullish Momentum
TRUMP has successfully reclaimed the 4H 200 EMA and continues to print higher highs and higher lows across lower timeframes. The recent breakout confirms that buyers are currently in control, while price remains above key support levels and moving averages.
For now, the focus is on whether the market can hold the breakout zone around 2.16-2.22. As long as that area is defended, the bullish structure remains intact and continuation toward higher liquidity levels becomes increasingly likely.
The main invalidation level remains below 1.99. Until that level is lost, the trend favors buying pullbacks rather than looking for shorts. A healthy retracement into support followed by a bullish reaction would provide the strongest opportunity for continuation.
Analysis by Leo524. 🚀
OFFICIAL TRUMP Recovers—Bearish Continuation or New Bull Market?TRUMPUSDT has been dropping for what feels like 100 years. In truth, it's been one year and five months, since January 2025. After this prolonged bear market, this project still has a very strong price, $2.14 currently.
The October 2025 low continues to be the all-time low and recently we have a double-bottom (shy higher low).
A recovery? It looks like the real deal as volume is rising rapidly on the current active session, an entire month of bearish action has been erased in a matter of days. But, seeing how this project kept on moving lower, we will need to see follow through from buyers to confirm a change of trend.
The low from October 2025 being matched is a very strong signal and this chart supports higher prices. This long-term double-bottom took eight months to be completed. The recent low can easily be the end of the bearish trend for TRUMP. An end to the bearish cycle can only result in long-term growth, there is no other choice. Either it goes down or it goes up.
TRUMPUSDT went down for 1.5 years and now we are getting a very strong, but still early, reversal signal.
What will happen next? When you least expect it, everything changes. I had completely forgotten about this trading pair; as soon as you forget because it has been bad, down and boring for too long, out of nowhere, we get a very strong bullish cycle. TRUMPUSDT is going up.
Namaste.
short squeeze - Making new lows and taking out the short sellersMaking new lows and taking out the short sellers is what I'm waiting for.
Algos will start hunting shorts' stop-losses.
Bears will be forced to panic-buy at market price to avoid getting liquidated.
With zero sell-side liquidity in the order book, this buying cascade will send the price vertical.
Satoshi Frame | TRUMP Breakout Setup AnalysisWelcome to Satoshi Frame channel.
After the recent sell off, TRUMP has entered a 4H box range. A breakout from either side could trigger a strong move, and the potential risk to reward setup looks attractive.
A breakout above the 4H resistance at 2.118, the top of the box, with rising volume could offer a risky long opportunity on TRUMP. As mentioned, it’s aggressive, but the target could extend toward 2.309.
But what if the market drops? A break below the daily support at 1.975 could trigger further downside pressure, especially since TRUMP has been printing lower lows consistently over the past weeks.
Final confirmation for the long scenario comes from the overbought level at 56.16, while confirmation for the short setup comes from the oversold level at 37.11. The DMI indicator also suggests the market may range a bit more before the actual breakout happens.
Risk management and capital management are essential in trading. Always trade based on your own strategy and risk tolerance. Every trading decision and its outcome are entirely your own responsibility.
TRUMPUSDT Daily | Bearish Bias with Potential Short Setup#TRUMP was trending again yesterday, but it looks more bearish. If it provides a short opportunity, it should be taken, as it may even drop to the yellow zone. However, if it reaches that area, it could also offer a short-term long opportunity. We are keeping an eye on it 👀
#TRUMPUSDT setting up for its next leg higher.#TRUMP
The price is moving within a descending channel on the 1-hour timeframe and has reached the lower boundary. It is now poised for a bounce and is expected to retest this boundary.
The Relative Strength Index (RSI) indicates a downward trend, which is likely to continue given the overbought conditions.
There is a key support zone (in green) at 2.25, and the price has bounced off this zone several times, making it a strong support level.
The price is trending towards the 100-period moving average, which we are approaching. This trend supports an upward move.
Entry Price: 2.36
First Target: 2.40
Second Target: 2.44
Third Target: 2.49
You can stop at the first and second targets and close below them, or continue towards the third target.
Stop Loss: At the resistance zone (in green).
Remember this simple rule: Money Management.
Any questions? Please leave a comment.
Thank you.
#TRUMP Preparing for a Violent Move Most Traders Are Not Ready!Yello Paradisers! Are you prepared for a potential sharp move on #TRUMP, or are you still underestimating what’s quietly building behind the scenes? At first glance, this structure might seem like a simple and healthy pullback. But when we strip away emotions and analyse the chart objectively, a completely different narrative emerges. This is not random price action — this is a high-risk, high-opportunity zone where discipline matters far more than opinions.
💎#TRUMP has just printed a classic selling climax, followed by a climactic action candle with ultra-high volume. This is a textbook indication of accumulation behaviour. We have seen this pattern repeatedly in the past when smart money begins positioning before a significant move unfolds. It’s subtle, but very powerful for those who understand it.
💎#TRUMP swept sell-side liquidity with a shakeout test, followed by a clean two-bar reversal pattern. This creates additional bullish confluence and increases the probability of continuation as long as price continues holding inside the Order Block and Fair Value Gap support zone. The first important resistance level to monitor remains around 3.030. A successful reclaim of this level could accelerate momentum very quickly.
💎#TRUMP has also swept liquidity of selling climax with an automatic rally and followed it with a strong momentum candle breaking above the upper trend-line of the automatic rally structure. This is an important probability because it suggests weak hands are slowly getting forced out of the market while stronger participants continue absorbing positions.
💎the key confirmation level now sits above the high of the climactic action candle. If bulls manage to reclaim that zone with strong momentum and volume confirmation, the next major structural resistance stands around 3.460.
💎If #TRUMP fails to hold bullish momentum and a momentum candle closes below 2.145, the current bullish probability becomes invalid. In that case, we could see further downside pressure.
That is why Paradisers, we are playing it safe right now. If you want to be consistently profitable, you need to be extremely patient and always wait only for the best, highest probability trading opportunities only on confirmations.
MyCryptoParadise
iFeel the success🌴
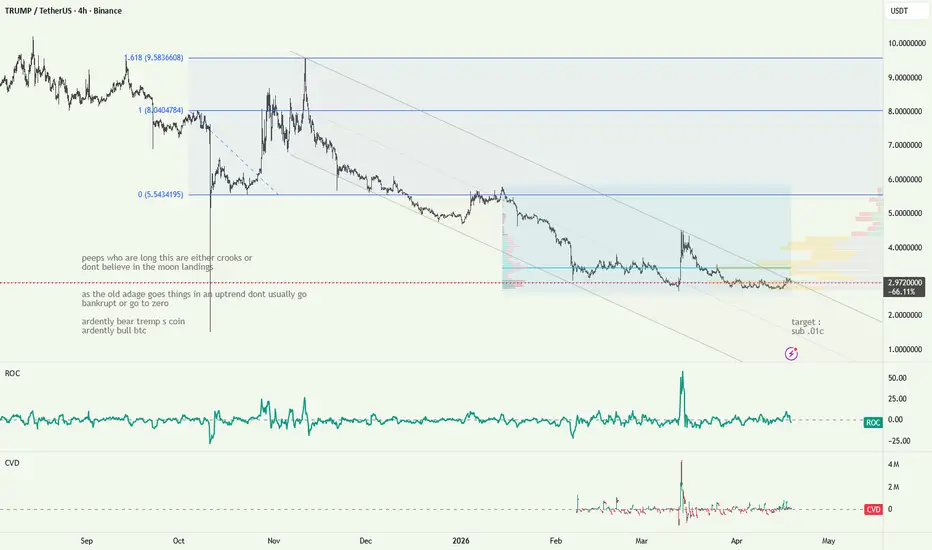
"things in uptrends dont usually go bankrupt or broke" TRUMPUSDTthis is a beautiful channel of course channels dont do anything other than frame the obvious but there's plenty of numties bidding the rips, all the bias is created by the chart not by umm anything else, nothing else ...at aaawwwllll $$
$TRUMPUSDT 1H | REJECTION AT RESISTANCE??BINANCE:TRUMPUSDT coin is currently facing strong resistance pressure on the 1H timeframe, and the structure is leaning bearish.
After multiple attempts to push higher, price is now rejecting a key supply zone, suggesting sellers are stepping in aggressively.
Key Levels:
• Resistance Zone: $2.858 – $2.868
• Entry Zone: $2.855 – $2.865
• Stop Loss: $2.883
Targets:
• TP1: $2.815
• TP2: $2.758
Chart Insight:
Price is trading below key EMAs, showing weak bullish momentum. The repeated rejections at resistance confirm this zone as a strong supply area.
Current structure indicates lower highs + consolidation, which often leads to a breakdown if buyers fail to reclaim higher levels.
Trade Idea:
This is a rejection-based short setup — best entries come on confirmation (wick rejection / bearish candle close).
A clean rejection → continuation lower
Break above resistance → invalidation
Final Thought:
If resistance holds, BINANCE:TRUMPUSDT could see a controlled move toward lower liquidity zones. Patience is key here.
TRUMP: ready to ride the election wave? key levels to watch!TRUMPUSDT
Who’s ready to trade the election meme coin instead of reading polls all day? According to market chatter, politics‑related tokens are heating up again as headlines cycle around upcoming debates and legal drama, and TRUMP has started to attract fresh volume on Binance after that long bleed‑out.
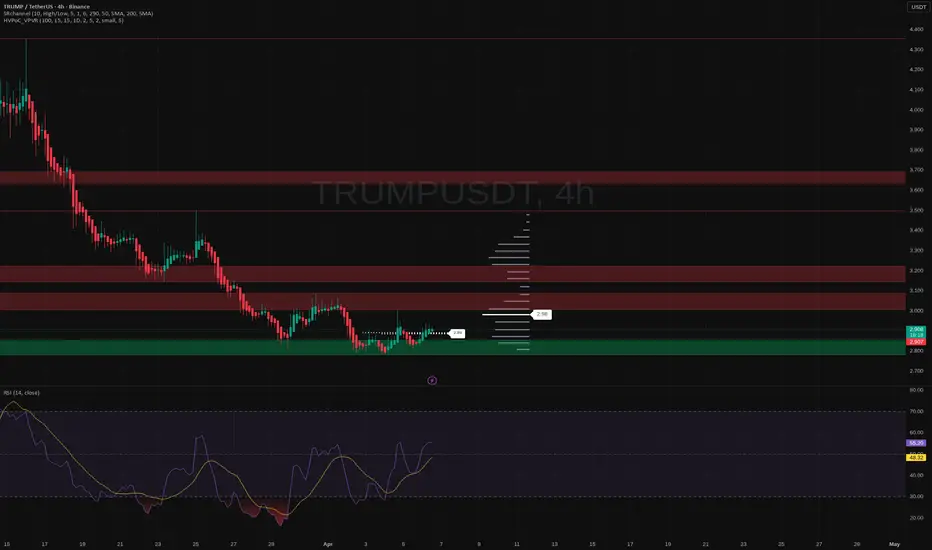
On the 4H chart we’re sitting in a big green demand block after a brutal downtrend, with RSI curling up from oversold and pushing above the midline. Volume profile shows a fat liquidity gap above current price, so if buyers manage to hold this base, I’m leaning toward a squeeze into the first red supply zone around the 3.05‑3.15 area. I might be wrong, but this has all the ingredients of a classic sentiment pop rather than a slow grind.
My plan: as long as price holds this green zone, I treat dips as potential scalps toward that 3+ range, taking profit into the red bands. ✅ If we lose the lower edge of demand and close below it on 4H, the idea is invalid and I step aside, looking for a deeper flush before trying again. I’m watching for a strong 4H candle with rising volume to confirm the move; no confirmation, no hero trades.
$TRUMPUSDT Sitting on Support — Bounce or Bust From This ZoneBINANCE:TRUMPUSDT is holding up pretty well after the recent bounce, and now we’re seeing a pullback right into a key support zone.
Support Zone (Buy Area):
$2.928 – $2.909
This is a clean demand zone with multiple reactions, showing strong buyer presence and solid base formation.
Entry Zone:
$2.92 – $2.93 area (dip buy territory)
Stop Loss:
$2.897 (below support = setup invalidated)
Targets:
Target 1: $3.002
Target 2: $3.077
What’s the play?
Price is consolidating after the recovery move, and this pullback into support looks like a potential continuation setup. If this zone holds, we could see another push toward the upside targets.
If support breaks, expect a quick downside move — so no blind entries, wait for confirmation.
Bias: Bullish as long as $2.90 holds
This is a clean range support bounce setup. Don’t chase the move — let price come into the zone and react.
TRUMP-USDTAfter a sweep into the capitulation zone below the April lows, the price has returned to the resistance area of the descending channel. A classic range breakdown–retest structure is forming, with price now consolidating within the resistance zone — a typical accumulation phase before a potential breakout.
Further movement may turn into an impulse, depending on the broader market context — either breaking out of the channel or retesting lower levels once more.
📊 Watch the price reaction in this zone — it will define the next medium-term move.