TRON: Why a Quiet Market Deserves AttentionMost traders look for opportunities in markets that move.
I'm often more interested in markets that stop moving.
Following a sharp decline, TRON has transitioned into a well-defined trading range. At first glance, the lack of direction may appear unremarkable. In reality, prolonged balance often represents the stage where supply and demand gradually reach equilibrium before the market commits to its next major move.
What makes this structure particularly interesting is the behaviour of sellers. Despite several attempts to regain control, each downside move has struggled to produce meaningful follow-through. Rather than accelerating lower, price repeatedly finds demand near the lower boundary of the range, suggesting that selling pressure is being absorbed instead of expanding.
The broader backdrop also supports that observation. TRON continues to maintain one of the most consistently active blockchain ecosystems, with stable network usage and transaction activity even during periods when sentiment across the digital asset market has become more cautious. While fundamentals alone do not determine price direction, they often provide a supportive foundation once market participation begins to improve.
For now, the range remains intact, and that means patience is likely more valuable than anticipation. Markets rarely offer their clearest signals in the middle of consolidation.
The next meaningful clue will come from whichever side proves capable of breaking this balance with conviction. Until then, the structure deserves attention—not because it is exciting, but because quiet markets often precede the most decisive moves.
In-depth trading ideas
TRXUSD 1W MA50 break-down expected soon.Tron (TRXUSD) has been consolidating for the past 1 year within a wide Rectangle pattern. Since the May 25 2026 High and the subsequent rejection, the price has found Support exactly on its 1W MA50 (blue trend-line) and is consolidating for the past 6 weeks.
As long as it continues to do, the trend will stay neutral. A 1W candle closing below it however, would target the 1W MA100 (green trend-line) at 0.2800, close to Support 1 and the bottom of the Rectangle.
If on top of that, it delivers a 1W closing below Support 1 as well, the Rectangle would be invalidated and the market could target Support 2 and the 1W MA200 (orange trend-line) at 0.20250.
---
** Please LIKE 👍, FOLLOW ✅, SHARE 🙌 and COMMENT ✍ if you enjoy this idea! Also share your ideas and charts in the comments section below! This is best way to keep it relevant, support us, keep the content here free and allow the idea to reach as many people as possible. **
---
💸💸💸💸💸💸
👇 👇 👇 👇 👇 👇
TRX: recovery grind toward the $0.345 capThe Macro Picture 🗺️
TRX pulled back from its $0.378 May peak into a $0.31 base, but rather than break down it has quietly rebuilt structure — carving a series of higher lows off the macro floor since June. Price now sits at the $0.33 equilibrium with RSI grinding back above its midline, reflecting the steady, low-volatility recovery this asset is known for. The macro range between $0.31 and $0.378 stays intact, and the constructive tone of the higher lows tilts the path of least resistance back toward the range highs.
The Setup ⚙️
The Floor: The $0.31 macro support (solid green) has anchored every dip, stacking with the $0.315 local low to form a high-confluence demand shelf. The rising sequence of lows off this zone is the tell that buyers are in control of the base.
The Ceiling: The $0.345 local decision (red dashed) is the pre-breakdown shelf and first real test. A decisive daily close above it opens the path toward the $0.378 macro top.
The Range Play: The $0.315–$0.33 band creates a structural playground for grid-based accumulation — mechanical entries stacked across the range while price grinds higher, no directional bet required until the break confirms.
The Roadmap: Primary target sits at $0.345 — the green roadmap points toward a push into the range ceiling as the higher-low structure holds. Invalidation: a sustained 1D close below $0.31 would break the base and reopen downside toward fresh lows.
More setups in profile.
TRX Is My Favorite Crypto Chart Right NowTRX Is My Favorite Crypto Chart Right Now 🚀📈
Out of more than 150 charts I regularly analyze, TRX currently stands out as my favorite setup. It checks nearly every condition I look for before considering a trade: structure, trend, support, and clearly defined risk.
The first key level is 0.3188 , which is acting as a very solid support zone. As long as price respects this area, the technical outlook remains constructive.
Switching over to the 12-hour chart reveals something even more interesting. While many cryptocurrencies remain well below their all-time highs, TRX continues to demonstrate exceptional relative strength. That isn't happening by accident. Projects with real utility and adoption tend to attract stronger long-term demand, and TRX has continued to build within the crypto ecosystem.
Technically, the chart looks clean:
✅ Bullish market structure
✅ Price trading above my secret EMA
✅ Ascending channel in play
✅ A second ascending channel nested inside the primary channel
This "channel within a channel" creates one of my favorite trading environments because we're currently positioned near the lower boundary , giving a favorable risk-to-reward profile.
Potential Targets 🎯
Support: 0.3188
Target 1: 0.361
Target 2: 0.421
Extended Target: 0.530
A practical approach is keeping risk defined below approximately 0.319 while allowing the trade room to develop toward each objective.
As always, I prefer scaling out of positions rather than waiting for one final target. Taking profits incrementally helps reduce risk while allowing participation if momentum continues.
Trading Wisdom 📜
The best trades rarely come from chasing candles—they come from patiently waiting for structure to align. Strong risk management doesn't just protect capital; it allows us to stay in the game long enough to catch the biggest moves.
Nothing I post is financial advice. It's perspective. I’ve mastered the art of prognosis, but you are the one behind the trigger. Always know your levels, and respect your risk. and remember to hedge with a chart that looks the opposite of this...i might serve you one in the coming posts
One Love,
The FXPROFESSOR 💙
Tron to accelerate into the next bull market 3 x cup and handle Bullish on TRX Tron because it has performed relatively well during the bear market against its piers
Its price is sitting over a trend line which if you extrapolate and assume the bullish cycle lasts about the same 3 years. It takes us to the Cup and handle target.
The cup-and-handle pattern shown is based on several assumptions, using a line of best fit across the key support and resistance levels. The spike lows have been treated as valid data points, while the spike highs have been discounted due to the lower volume traded at those levels compared to the lows.
This analysis produces a target around the whole number "1" together with a possible wedge continuation pattern enroute
In a bull market, I would expect TRX to outperform and potentially deliver more than a 3x return. However, a 3x gain is still a respectable outcome for a top-10 cryptocurrency that has remained relatively strong throughout the bear market. Could it go much higher? Absolutely. But it's important to remain realistic and manage risk appropriately.
Personally, I'd be happy to bank a 3x return rather than endure excessive drawdowns chasing larger gains. As long as price remains above the dotted trend line, this appears to be a reasonable strategy for potentially tripling your investment. This isn't financial advice—just a practical approach based on risk versus reward.
The timeframe for this setup is approximately three years. If TRX experiences a strong move earlier than expected, there may be an opportunity to take profits and rotate that capital into another token that tends to perform later in the bull cycle. In that scenario, you could potentially achieve a 3x return on TRX and then another 2x–3x elsewhere.
That would result in an overall return of 6x–9x during the cycle, while starting from a relatively conservative position. Of course, "safe" is a relative term in cryptocurrency, which remains a high-risk asset class, but the goal is to maximize returns while minimizing unnecessary risk.
Old Cycle Tops Are Becoming Support -TRONTRON is showing one of the cleaner long-term structures in the altcoin market.
Many old altcoin charts are still fighting below their 2021 highs. Some are still trapped under multi-year resistance. TRX is different. The chart has already reclaimed the 2021 ATH region, moved toward the 2018 ATH zone, and is now consolidating near one of the most important historical resistance areas in its entire structure.
That is the key message of this chart.
This is not a random sideways range. It is a high-timeframe market structure where old cycle tops are being tested as support. The 2021 ATH zone around the lower horizontal level has already been reclaimed and defended. That level used to represent cycle exhaustion. Now it is acting more like a structural base. This is important because strong assets often reveal themselves by turning old ceilings into new floors.
The next major reference is the 2018 ATH region. Price is now sitting near that level. This area is not just resistance. It is the line that separates a long historical recovery from a new repricing phase.
If TRX can continue holding above the reclaimed 2021 structure and gradually build pressure near the 2018 ATH region, the chart remains constructive. The market would be showing that the old cycle highs are no longer acting as permanent rejection zones. Instead, they are becoming part of the new base.
The rising trendline from the long-term lows also supports this idea. Since the major 2020 low, TRX has been building a clear upward structure with higher lows. Even during corrections, price has continued to respect the broader ascending base. That makes the current consolidation more meaningful.
The chart is telling a very simple story:
TRX has not collapsed back into its old range.
It has climbed above the 2021 cycle high.
It is now challenging the 2018 cycle high.
And it is doing this while the broader structure continues to rise.
This is usually how long-term repricing structures develop. First, the market reclaims old resistance. Then it spends time consolidating above it. The crowd often calls that boring or weak. But structurally, that boring phase can be the market building a new floor. The important area to watch is the reclaimed zone between the 2021 ATH region and the 2018 ATH region. As long as TRX remains above the old 2021 cycle top area, the chart continues to look like a market building strength above old resistance. A clean move above the 2018 ATH region would be a major structural signal. It would mean TRX is no longer only recovering from past cycles. It would be entering price discovery relative to its previous historical ceiling.
TRX/ETH
TRON is not showing a dead old-cycle structure.
It is showing old cycle tops turning into support.
And when old resistance starts becoming a base, the market is usually preparing for a larger repricing phase.
TRX Tron Point and Figure Targets Hello all,
Did you notice that TRX has just broken through the long term bear trend line which makes it bullish again?
You could argue that its still in an uptrend bullish since August 2024
I have included some of the PnF vertical counts for interest, often they act as key levels of support / resistance and the price can inflect around these levels
Maybe this helps someone out there, good luck trading the market loves you and wants to give you gifts
Chart is squashed to be able to fit on the upside targets the lines actually run at 45 deg
TRXUSD: Long term bullish trend unaffected.Tron may be bearish on 1D due to this week's correction but remains bullish overall on its 1W technical outlook (RSI = 61.292, MACD = 0.013, ADX = 61.678). The reason is the strong rally it's been on since the February 2nd Low, which is part of the 18 month Channel Up. In fact it is the latest bullish wave, with the last one peaking on the 1.382 Fibonacci extension. This is what we are aiming for again, TP = 0.40750.
## If you like our free content follow our profile to get more daily ideas. ##
## Comments and likes are greatly appreciated. ##
TRX | May, 2026 | Continued stock growth- Timeframe: Weekly
- Trade type: Buy stop order
- Price: 0.35736
- Take Profit: Open
- Stop Loss: 0.34691 (-2.90 %)
Idea: Long on a breakout above last week's high — bullish momentum continuation.
Entry: Buy stop above last week’s high.
Stop-loss: Below the low of the same candle.
If the weekly candle closes below this level, the trade is invalidated.
Take Profit: Trailing stop following the lows of new weekly candles.
TRON (TRX) – Bullish Conviction: No Return Below 0.33After extensive work on TRON’s price movement ratios, I see it as highly unlikely that TRX will ever drop below $0.33 again.
Given that TRON has been showing stronger relative strength compared to Bitcoin for a considerable time, I’ve made a decisive move. As a long-term Bitcoin holder, I have decided to convert all my BTC holdings into TRON for a minimum of 6 months.
In my view, TRON will break its all-time high of $0.45 within the next 6 months.
TRXUSD Will it repeat a strong drop to the 1W MA200?Tron (TRXUSD) has been showing incredible resilience as of late, as despite the correction of the last few months, it is about to test the August 2025 Highs.
Its 1W RSI pattern though, which is under Lower Highs with the price testing the trend-line now, is on a similar pattern as the 2021-2022 Bear Cycle. It was during that 3rd rally and Lower Highs test (May 02 2022) that TRX got rejected and started its final Bearish Leg.
That final correction hit and bottomed on the 1W MA200 (orange trend-line), which was also on the Support level of the Bear Cycle as formed by the June 21 2021 Low. At the same time, the 1W RSI bottomed around 33.00 (almost oversold).
Pay particular attention to the 1W RSI as its December 02 2024 High was priced on the same level as the March 29 2021 High of the previous Bear Cycle. If this symmetry continues, we may also see it bottoming on the 33.00 Support again.
As a result, taking into account all the above parameters, TRX's 0.20250 Support seems like a strong candidate for this Bear Cycle bottom, which by October - November 2026, may again make contact with the 1W MA200. If however the 1W RSI hits the 33.00 Support first, we will turn long-term bullish on Tron regardless of the price.
---
** Please LIKE 👍, FOLLOW ✅, SHARE 🙌 and COMMENT ✍ if you enjoy this idea! Also share your ideas and charts in the comments section below! This is best way to keep it relevant, support us, keep the content here free and allow the idea to reach as many people as possible. **
---
💸💸💸💸💸💸
👇 👇 👇 👇 👇 👇
TRX | Day Chart | April 2026- T.A explained -
Range = two or more consecutive color candles.
DISTRIBUTION RANGES DEFINED: BackSide (BS) Candle - First distribution candle in a distribution range. Expectation = strong reaction to price. long wicks reaching to or away from level.
FrontSide (FS) Candle - Last distribution candle in a distribution range. Expectation = reversal, create a trend in the opposite direction. Distribution candles are used as support.
ACCUMULATION RANGES DEFINED:
Inverse BS (Inv.BS) - First Accumulation candle in an accumulation range. Expectation. = strong reaction to price. long wicks reaching to or away from level.
Inverse FS (Inv.FS) - Last accumulation candle in an accumulation range. Expectation = reversal, create a trend in the opposite direction. Accumulation candles are used as resistance.
Horizontal Ray tool on BS & FS levels are default support levels when dashed lines, tested when dotted lines and resistance when solid lines.
Horizontal Ray tool on Inverse BS & Inverse FS levels default as resistance and shown with a dashed line, tested when 1x dotted line, and support when solid line.
The inverse is true for the Inv. BS Inv. FS levels, they are resistance as dashed lines, tested as dotted and support as solid lines.
Monthly timeframe is color pink
weekly grey
daily is red
4hr is orange
1hr is yellow
15min is blue
5min is green if they are shown.
strength favors the higher timeframe.
Good Recent Performance, but Waiting for a Base Line Before GoinIn my opinion, TRON’s performance over the past few days has been good. However, before taking a long position, I am still waiting for a base line to form.
Therefore, for the next one to two months, I will keep it under observation for a potential buy entry.
Tron USD resolves upside ?Bullish long term because the old point and figure vertical count from Jan 2018 still has an upside target of say approximately 0.73 which its working towards
Other horizontal and vertical counts show greater bullish potential
So long as the price action stays above the long term green bullish trend line then this is an upside continuation pattern
The move still to be had is approx 2x from here
Morgan Stanley’s Record Bitcoin ETF Launch DayMorgan Stanley has made a powerful entry into the crypto market with the launch of its spot Bitcoin ETF. The product delivered the strongest day-one performance of any ETF the firm has ever introduced, marking a historic milestone for both the bank and the broader digital asset space.
The launch generated immediate traction, drawing significant investor attention and setting a new internal benchmark for ETF debuts. It also reinforces how quickly traditional finance is moving from observation to active participation in crypto markets.
Strong Demand Signals Growing Institutional Confidence
The numbers behind the launch highlight its impact. The ETF recorded over $30 million in inflows, saw more than 1.6 million shares traded, and accumulated roughly 444 BTC on its first day. These figures place it among the top-performing ETF launches in the market.
Such strong early demand reflects rising institutional confidence in Bitcoin. ETFs provide a regulated and familiar structure, making it easier for large investors to gain exposure without directly holding crypto. This opens the door to new capital inflows, which can support long-term market stability and growth.
A major advantage lies in Morgan Stanley’s distribution network. With millions of clients and a vast advisor base, the firm can directly introduce the ETF to investors, accelerating adoption. Combined with competitive fees, this creates a strong value proposition that can quickly capture market share.
ETF Competition and the Future of Crypto Integration
This launch reflects a broader shift across financial markets. Traditional institutions are no longer standing on the sidelines—they are building products that integrate crypto into mainstream portfolios. As more firms enter the space, competition among Bitcoin ETFs is intensifying.
Increased competition typically leads to lower fees, better product structures, and improved access for investors. This benefits the overall market while accelerating adoption of digital assets. It also strengthens Bitcoin’s position as a recognized financial asset within global portfolios.
The bigger picture is clear. The line between traditional finance and crypto continues to blur. With major players like Morgan Stanley stepping in, the market is entering a new phase—one defined by institutional scale, accessibility, and long-term integration.
TRON Integrates Hyperlane for 150-Chain Smart Contract MessagingThe TRON DAO has announced a major integration, connecting its network to over 150 blockchains through Hyperlane. This marks a significant step toward true interoperability, positioning TRON as a more connected player in the evolving multichain ecosystem.
Unlike traditional blockchain expansions, this move focuses on connectivity rather than isolation. As the crypto industry shifts toward a future where multiple networks coexist, integrations like this play a crucial role in enabling seamless interaction across platforms.
Beyond Token Transfers: Full Cross-Chain Communication
Most cross-chain solutions primarily enable token transfers. This integration goes further by allowing full smart contract messaging between chains. That means data, instructions, and execution logic can move freely—not just assets.
This advancement unlocks new possibilities for developers building on TRON. Applications can now interact across multiple blockchains in real time, creating more dynamic and interconnected systems. Interoperability removes the limitations of isolated networks and enables a more efficient and unified ecosystem.
With this capability, TRON can support advanced DeFi use cases such as cross-chain lending, multichain governance, seamless stablecoin transfers, and interconnected decentralized applications. This significantly expands the scope of what can be built and deployed.
Ecosystem Growth and the Multichain Future
The integration creates a major growth opportunity for TRON. More connections lead to increased user activity, improved liquidity, and stronger competitiveness in the DeFi space. Interoperability is rapidly becoming a key differentiator among blockchain networks.
Hyperlane plays a central role by acting as a permissionless bridge. Developers can use it freely, which accelerates innovation and aligns with the decentralized nature of blockchain technology. This flexibility allows new applications to emerge without heavy restrictions.
At a broader level, this move reflects a major industry trend. The future of crypto is not about a single dominant chain but about multiple networks working together. TRON’s integration highlights this shift toward deeper connectivity, where collaboration between blockchains drives the next phase of growth and adoption.
Tron Wave Analysis – 25 March 2026
- Tron reversed from resistance zone
- Likely to fall to support level 0.3000
Tron cryptocurrency recently reversed from the resistance zone between the resistance level 0.3175 (low of correction (2) from January), upper daily Bollinger Band and the 50% Fibonacci correction of the downward impulse from August.
The downward reversal from this resistance zone created the daily Shooting Star, which stopped the previous ABC correction 2 from the start of February.
Tron cryptocurrency can be expected to fall to the next support level 0.3000 (which reversed the price earlier this month).
TRX/USD Swing Opportunity After Technical Breakout!🚀 TRX/USD - "TRON VS U.S. DOLLAR" | Crypto Swing Trade Blueprint 📈
💎 CURRENT MARKET STATUS (December 30, 2025)
TRX is trading at $0.2818 USD with 24-hour volume of $566.75M and market cap of $26.68B, ranked #8
📊 TRADE SETUP ANALYSIS
Plan: BULLISH momentum confirmed
Simple Moving Average pullback pattern identified
TRX holding higher timeframe supports with accumulation signs on daily chart
Weekly chart shows bullish engulfing pattern suggesting strong buyer momentum
Entry: Market execution at current levels (~$0.2818)
TRX has high correlation with Bitcoin, positioning it for amplified gains during BTC bull runs
Smaller market cap makes percentage expansions more feasible than BTC
Stop Loss: $0.27900
⚠️ Risk Disclosure: Ladies & Gentlemen, this is MY protective stop level. Adjust YOUR stop loss based on YOUR strategy, risk tolerance, and portfolio size. I'm NOT recommending you copy my exact levels - manage your own risk!
Take Profit Target: $0.28900 (Triangular MA resistance zone)
📌 Profit Management Note: This target represents strong resistance + potential oversold bounce correlation. However, YOU decide when to secure profits. This is NOT financial advice - take profits at YOUR comfort level based on YOUR trading plan!
🔗 CORRELATED PAIRS TO WATCH
Direct Pairs:
TRX/BTC - Analyst notes TRX less than 2 days from fresh breakout on monthly vs BTC, with 465 satoshi conservative target
TRX/USDT - Primary trading pair, highest liquidity
TRX/ETH - Cross-correlation play
Market Correlation Analysis:
TRX demonstrates high correlation with Bitcoin measured by Pearson coefficient; tokens with strong BTC correlation tend to amplify gains during bull cycles. Recent market saw $242M liquidations with BTC at $87,000 and TRX at $0.285, showing synchronized movement.
Related Assets to Monitor:
BTC/USD - Lead indicator for TRX direction
ETH/USD - Layer-1 competitor gauge
USDT dominance - TRON surpassed Ethereum in USDT volume, with over $80B USDT on TRON network
📰 FUNDAMENTAL & ECONOMIC FACTORS
Recent Bullish Catalysts:
Network Growth 📊
TRON accounts reached record 355.4M in December 2025, with 240,000 new accounts created daily
Perpetuals volume hit $1.1B on December 23, showing heightened leveraged trading interest
Institutional Integration 🏦
TRON integrated with Base (Coinbase's Layer 2) via LayerZero in December 2025
TRON DAO announced real-world settlement powered by USDT on TRON with RealOpen Crypto on December 26, 2025
Technical Upgrades 🔧
GreatVoyage v4.8.1 mainnet upgrade deployed with improved EVM compatibility
Token-agnostic gas payments launched late 2024, allowing any TRC-20 token for fees
Stablecoin Dominance 💵
TRON leads in USDT/USDD utility with cross-chain liquidity expansion
T3 Financial Crime Unit froze over $300M in criminal assets, strengthening ecosystem trust
Market Sentiment:
Price prediction models suggest 12-18% increase potential, reaching $0.32-$0.34 by December 2025
RSI at 67.87 indicates approaching overbought territory but still accumulation phase
Bearish Risks:
TRX down 16% in Q4 2025, tracking worst quarterly performance despite network growth
Centralization concerns regarding token distribution
Resistance at $0.30 zone with potential liquidity traps
⚡ KEY TAKEAWAYS
✅ Strengths:
Dominant stablecoin infrastructure
Record user growth and network activity
Major institutional integrations (Coinbase/Base)
High Bitcoin correlation for bull-run amplification
⚠️ Watch Out For:
Resistance clusters at $0.30-$0.31
Broader crypto market volatility
BTC price action as lead indicator
💬 Let me know your TRX targets in the comments! Are you bullish or bearish? 🚀📉
🔔 Follow for more crypto swing trade setups and market analysis!
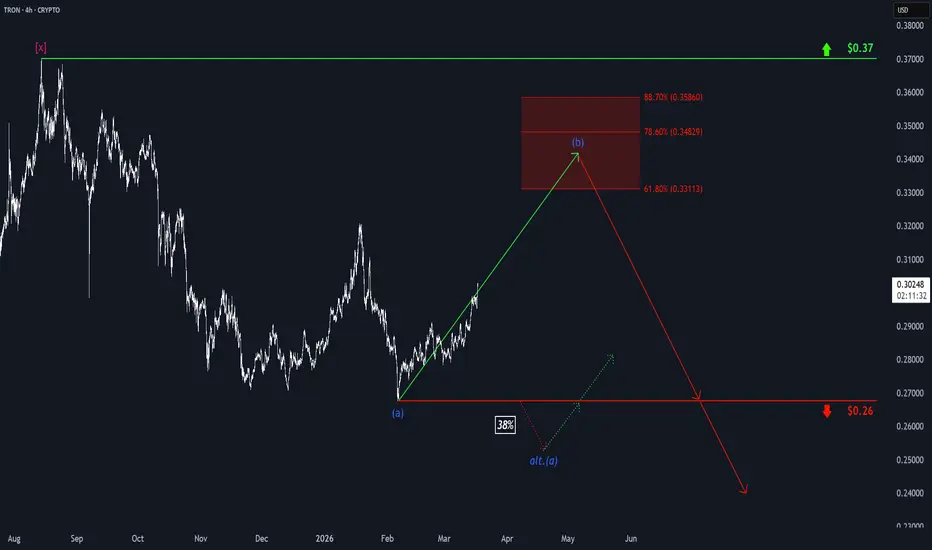
Tron: Progress!TRX has recently climbed considerably. Under our primary scenario, the altcoin should maintain this upside momentum in the near term. First, Tron should extend its corrective advance into our red Target Zone at $0.33 to $0.35. From there, the broader downtrend should resume, initially pushing price below the support at $0.26. In our alternative scenario, TRX would first slip below the support at $0.26 before rebounding towards the red Target Zone, which would need to be adjusted slightly in that case (probability: 38%).