TRX/USDT: Symmetrical Triangle Target & Short SetupHi!
TRON is breaking out of a multi-month symmetrical triangle on the daily chart. Price cleared the upper trendline and the 100 SMA, and is currently holding the retest as support around 0.3319.
Long Target (Triangle Measured Move): 0.3440 – 0.3480 (Supply Zone)
Reversal Short Entry: 0.3480 – 0.3500
Game Plan: Expect price to push into the upper supply zone (0.3440–0.3480) to complete the triangle target, then look for a bearish rejection setup to take a short back down to local support.
In-depth trading ideas
TRX/USDT H1: Range with range dominance🎯 TP1: $0.335841 (+0.31%) │ TP2: $0.335179 (+0.50%)
🛑 SL: $0.338705 (-0.54%) │ R/R: 1 : 0.93
⚠️ The stop is wider than TP2 (R/R < 1) — the closer target is hit more often, but adjust your position size according to the stop loss.
FUNDAMENTAL BACKGROUND
TRX is trading without its own catalysts — there is no fresh news on the project, which is typical for its behavior in the absence of impulses from the broader crypto market. Yesterday's US inflation data showed moderate growth: core CPI for July came in at +0.2% vs. the previous 0%, which did not trigger a sharp market reaction. Today, the Producer Price Index (PPI) is expected to be published at 12:30 GMT, but its impact on TRX is usually indirect.
TECHNICAL PICTURE
The price is fluctuating around the $0.34 level, where the EMA 20 and EMA 50 converge, confirming the range-bound mode. ADX 29.6 indicates a formally strong trend, but its direction is unclear — the MACD histogram is at zero, and VWAP is also at $0.34. The current price is in the upper part of the $0.329–0.338 range, but there is no volume for a breakout.
PROBABILITY MODEL
The probability of the range persisting is 90%, corresponding to a low ATR of 0.00073 (<0.5% volatility). The model estimates a 67% confidence level, considering the convergence of key indicators and the absence of clear signals.
DIRECTION
🔴 SELL — weak downward impulse when testing the upper boundary of the range.
TRX Breaks a Two-Month Range — Acceptance or Deviation?TRX has finally pushed above the upper boundary of the broader 4H range around 0.3334, after spending roughly two months trading below it. The initial structure following the breakout is constructive: price moved above the range, pulled back toward the breakout area and has so far remained above it.
────────────────────────────
4H CONTEXT
────────────────────────────
The 4H chart is the main context here. The former range high around 0.3334 was tested repeatedly during June and July before the current expansion finally moved through it. Price is now trading above that level while the broader structure remains bullish.
For now, that looks more like an acceptance attempt above the old range than a simple wick through resistance.
────────────────────────────
1H STRUCTURE
────────────────────────────
The 1H chart adds useful detail underneath the breakout. Bullish OBs have formed around the move, the pullback held above the broader breakout area, and the structure has continued with additional bullish BOS.
That gives the current move some internal structure rather than just one isolated push above the range.
────────────────────────────
RETEST OR DEVIATION?
────────────────────────────
The key distinction now is whether the former range high can remain accepted structure.
If TRX continues holding above roughly 0.3334 while the 1H structure remains constructive, the breakout-and-retest interpretation stays intact.
If price loses that area and begins closing back inside the old range, the move above the highs starts looking more like a deviation than a successful breakout.
────────────────────────────
CURRENT READ
────────────────────────────
At the moment, the evidence leans toward bullish breakout acceptance, with 4H and 1H structure aligned in the same direction. The 15m also remains constructive, but I would treat that as lower-timeframe detail rather than the main reason for the view.
The level that matters most is still the old 4H range boundary. The next few higher-timeframe closes should make the distinction between acceptance and deviation much clearer.
Would you classify this as a clean breakout/retest already, or are you still waiting for more acceptance above the former range high?
Structure observations, not signals.
Tron TRX price analysis🪙 For the first time in many years, CRYPTOCAP:TRX is trading below its long-term trendline.
And the clouds around the project seem to be getting darker.
First came the UK sanctions against #HTX, then the EU joined in. Before that, around $344M was blocked across the #TRON / #TRX network.
And I probably don't need to remind anyone:
HTX = Justin Sun = TRX.
❗️ So now OKX:TRXUSDT has a pretty simple task — quickly reclaim $0.35 and hold above it.
That would at least show that the market considers these problems temporary and that the situation remains under control.
📉 Because technically, this kind of trendline breakdown usually gets traded further to the downside.
And if CRYPTOCAP:TRX loses $0.325, the road opens toward the much more critical $0.25–0.27 zone — the same area we've been talking about since the beginning of the year.
🌟 So... is the multi-year trendline finally breaking this time? 👀
______________
◆ Follow us ❤️ for daily crypto insights & updates!
🚀 Don’t miss out on important market moves
🧠 DYOR | This is not financial advice, just thinking out loud
#TRXUSDT Ready to go higher
#TRX
The price is moving within a descending channel on the 1-hour timeframe and has reached the lower boundary. It is now poised for a bounce and is expected to retest this boundary.
The Relative Strength Index (RSI) indicates a downward trend, which is likely to continue given the overbought conditions.
A key support zone (in green) has been identified at 0.3180. The price has bounced off this zone several times, making it a strong support level.
The price is trending towards the 100-period moving average, which we are approaching. This trend supports an upward move.
Entry Price: 0.3418
Target 1: 0.3346
Target 2: 0.3376
Target 3: 0.3418
You can close at the second target or wait for the third target. The choice is yours.
Stop Loss: At the resistance zone (in green).
Remember this simple rule: Money Management.
Any questions? Please leave a comment.
Thank you.
TRX/USDT 4H - Tightening structure, breakout aheadKatsu on the Bridge. Let’s quickly check the TRX radar.
On the TRX 4H chart, we can see a nicely tightening structure. Price is building higher lows, while it has already been rejected several times near the 0.3315-0.3330 resistance zone. This means buyers are gradually pushing price higher, but sellers are still defending the upper area.
For me, the current picture is slightly bullish, but not blindly long. The ascending trendline is still holding, the MACD is improving, and the RSI is already quite high, so I would not want to chase a long entry here. A cleaner entry would come either from a retest or from a clear breakout.
The black path shows a more bullish scenario, where TRX may still revisit the support zones and then attack the upper resistance again. The red dashed path shows the opposite idea, where if the supports fail, the current upward structure can fade quickly.
Important Zones
Resistances
0.3315-0.3330 - nearby decision zone, price has already stopped here several times
0.3365 - next bearish zone, where seller reaction may appear
0.3400 - upper target / stronger resistance
Supports
0.3285 - nearby support, first retest zone
0.3265-0.3252 - more important bullish OB / defensive zone near the trendline
0.3245 - deeper blue support
0.3195-0.3175 - if this area comes into play, the bullish structure is already weakening
0.3143 - deeper defensive zone
Simple Battle Plan
Long Entry - From a Retest
I would not look for a long by chasing the current price. I would be more interested if price revisits 0.3285, or even better, the 0.3265-0.3252 zone, and gives a buyer reaction there.
What I want to see
retest into the 0.3285-0.3252 zone
the trendline does not break strongly
rejection wick or strong green candle
bullish ChoCh on the lower timeframe
the zone holds after the retest
In simple terms: support → sweep → bullish reaction → ChoCh → long
Possible long plan
Entry: 0.3285-0.3255, after confirmation
Stop Loss: below 0.3240
TP1: 0.3315
TP2: 0.3330
TP3: 0.3365-0.3400
This long only makes sense if TRX does not just drift into the zone, but buyers actually show up there.
Short Entry - From the Upper Resistance
I would look for a short around the 0.3315-0.3330 zone, but only if price cannot stay above it.
What I want to see
wick into the 0.3315-0.3330 zone
weakening momentum
rejection wick
bearish ChoCh on the lower timeframe
drop back below 0.3285
In simple terms: resistance → wick up → rejection → bearish ChoCh → short
Possible short plan
Entry: 0.3315-0.3330, after confirmation
Stop Loss: above 0.3345
TP1: 0.3285
TP2: 0.3265-0.3252
TP3: 0.3195-0.3175
If TRX closes steadily above 0.3330 on the 4H timeframe and then holds the retest, I would let this short idea go, because the market could then look toward the 0.3365-0.3400 zone instead.
TRX is now close to a decision point. Buyers are building higher lows, but the 0.3315-0.3330 resistance is still in the way.
The plan is simple:
I am looking for a long reaction between 0.3285-0.3252.
I am looking for a short reaction between 0.3315-0.3330, if rejection appears.
Above 0.3330, the short idea weakens, and 0.3365-0.3400 can come next.
Below 0.3245, I would be more careful with the long side.
The zone is not the entry, only a radar signal. The entry comes from the reaction.
This is not financial advice. The raccoon was simply thinking out loud about JUP today.
I wrote down what I see, what I think, and how I would trade it.
Then either I am right... or we learn from it. :))
IMPORTANT!
The entry prices and stop-loss levels are not set in stone. These are my own plans, and I share them only to teach the thinking process behind the setup. Never enter a trade blindly just because someone said so. Check it, verify it, and make your own decision. This is exactly how I explain it to my students as well, because this way the logic is easier to follow, and it becomes clearer what I actually mean when I talk about Order Blocks.
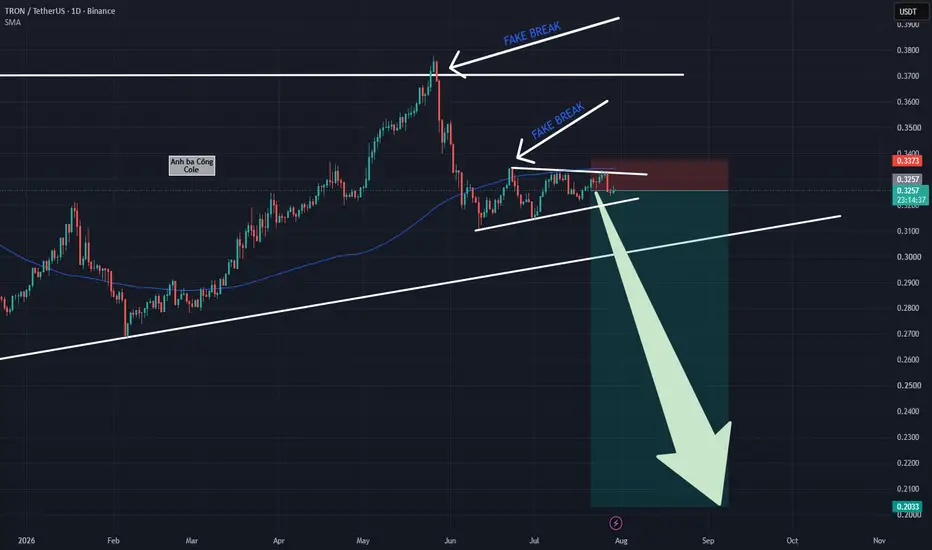
TRX: Price Compression Beneath MA100 Following Bull TrapTRX: Price Compression Beneath MA100 Following Bull Trap – Strategic Short Execution with Tight Risk Control
Tron (TRX) is flashing strong technical signals leaning heavily toward a bearish continuation as buy-side momentum shows complete exhaustion at key overhead resistance barriers. Although the macro chart reflects ongoing consolidation within a long-term ascending triangle, a sharp fakebreak at the upper boundary was rapidly crushed by aggressive selling pressure, driving price action into a deep retracement.
Based on the visual data from the daily chart , price action is currently coiling tightly inside a minor secondary triangle directly underneath the dynamic MA100 trendline resistance. The fact that prices spend the vast majority of time operating beneath the MA100 line—coupled with a secondary fakebreak rejection at this dynamic trendline—confirms absolute seller dominance. Every minor bullish recovery attempt is swiftly absorbed by overhead supply, building momentum for an imminent downside breakdown.
This technical environment delivers a prime trend-following Short opportunity. Executing a Short position while price action coils right underneath the MA100 line around the $0.331 level allows for an exceptionally tight stop-loss placement directly above $0.339, targeting the deep macro support floor at $0.205.
Disclaimer: This is not financial advice, DYOR.
Two path for TRXMy bot has calculated and displayed the following key support and resistance levels. Taking these levels into account, along with the triangle formation on the chart, where price is compressing against the upper resistance, I assume the odds are 50/50 for a move in either direction. If price breaks above the resistance level, after a retest, the nearest target will be around 0.345$. If the pattern resolves to the downside, the nearest target will be in the 0.313$ area.
TRX: Sequential Fakebreaks Reconfirm Bearish DominanceTRX: Sequential Fakebreaks Reconfirm Bearish Dominance – Dual Strategic Short Execution Framework
Tron (TRX) is flashing clear signs of technical exhaustion following repeated failures to sustain upward momentum into higher price territories. Despite operating within a long-term ascending triangle structure, a prominent fakebreak in late May was swiftly rejected by aggressive selling pressure, driving the price action deep beneath the dynamic MA100 trendline resistance.
Based on the visual data from the daily chart , price action is currently coiling tightly inside a secondary minor triangle directly underneath the MA100 line. Crucially, the local high within this consolidation range proved to be yet another failed bull trap at the MA100 level. This persistent rejection confirms that sellers aggressively suppress any price recovery, maintaining absolute structural control across both short-term and long-term timeframes.
This technical framework delivers two flexible Short trading strategies for investors:
Option 1: Proactively execute a Short entry within the minor triangle to optimize for a tightly placement stop-loss parameter, albeit requiring patience during range consolidation.
Option 2: Patiently await a confirmed daily candle close decisively breaking below the lower boundary of the minor triangle to trigger a trend-following Short, accepting a wider stop-loss for stronger directional confirmation.
Disclaimer: This is not financial advice, DYOR.
TRX: Ascending Triangle Breakout Faces Its First TestAscending Triangle Breaks Higher
TRX has pushed through the $0.3343 resistance that had repeatedly capped rallies since late June. The breakout follows a steady series of higher lows, giving the recent structure an increasingly bullish appearance.
Can $0.3343 Flip to Support?
The first test is whether bulls can now defend the former $0.3343 resistance as support. Price has already pulled back into this area after reaching an intraday high of $0.3385.
Bullish Structure Remains Intact
The 100/50-Day EMAs remain bullishly crossed despite recently contracting, while price continues to trade above both averages. RSI also remains above 50, supporting the broader bullish picture.
$0.3257 Protects the Pattern
The recent swing low around $0.3257 provides another important area of support beneath the breakout. A decisive break below this level would weaken the bullish structure and likely invalidate the ascending triangle setup.
All-Time High Still Some Distance Away
A successful breakout would turn attention back towards the May 26 all-time high at $0.3775. However, neutral volume and an overbought StochRSI suggest bulls still have plenty of work to do before that level comes into serious contention.
In Summary
TRX is attempting to confirm its ascending triangle breakout, with $0.3343 now facing its first test as new support. The broader setup remains constructive, with price above the bullishly crossed 100/50-Day EMAs and RSI above 50. Holding the breakout would keep the focus on further upside and eventually $0.3775, although neutral volume and an overbought StochRSI warrant some caution. A break below $0.3257 would significantly weaken the bullish setup.
TRON: Consolidation Continues Below Major ResistanceResistance Still Holding Firm
TRON has once again failed to break above the $0.3330-$0.3336 resistance zone, with the latest swing high at $0.3312 marking another rejection. This area has repeatedly capped advances, leaving the bulls with more work to do.
Momentum Has Stalled
The 100/50-Period EMAs have flattened and are now moving sideways, reflecting the lack of clear directional momentum. Price continues to oscillate around these averages as consolidation persists.
Support Remains Intact
Initial support sits around $0.3254, where buyers have so far managed to prevent a deeper pullback. As long as this level holds, bulls still have an opportunity to mount another challenge of resistance.
A Break Could Set the Next Move
A decisive break and close above $0.3336 would strengthen the bullish case and increase the probability of a move towards the May high at $0.3775. Conversely, a break below $0.3254 would increase the odds of a retest of the July 17 swing low at $0.3217.
In Summary
TRON remains trapped in a well-defined consolidation range, with neither bulls nor bears yet able to seize control. Resistance around $0.3330-$0.3336 continues to reject advances, while support at $0.3254 is preventing a deeper decline. Until one of these levels gives way, the market is likely to remain range-bound. The eventual breakout should provide a clearer indication of the next meaningful directional move.
TRON: Bulls Face Another Test at Key ResistancePrimary Trend
TRON continues to outperform much of the altcoin market, with the 100/50-Day EMAs still bullishly crossed. However, both moving averages have begun to flatten and contract, suggesting bullish momentum is starting to slow.
Resistance
Price has once again rallied into the $0.3330-$0.3340 resistance zone, an area that has repeatedly capped advances since June. Bulls need a convincing break and close above this level to shift the focus back towards the May 26 high at $0.3775.
Support
Initial support sits around the July 17 swing low at $0.3217. This level has held on recent pullbacks, but a decisive break below it would increase the odds of a resumption of the medium-term downtrend.
Momentum
RSI continues to chop around the 50 level, reflecting the current lack of directional conviction. Meanwhile, the StochRSI remains in the mid-range, suggesting neither bulls nor bears have a clear momentum advantage.
What to Watch
A breakout above $0.3340 would strengthen the bullish case and open the door to a retest of $0.3775. Until then, repeated failures beneath resistance keep the risk of another rejection alive.
In Summary
TRON remains one of the stronger cryptocurrencies from a relative strength perspective, but it is once again approaching an important technical hurdle. The $0.3330-$0.3340 resistance zone has repeatedly rejected buyers, making this a pivotal test. A convincing breakout would improve the outlook and put the May high back in focus. Failure to clear resistance, however, would leave the market vulnerable to another pullback, particularly if $0.3217 fails to hold.
TRX Breaks Bullish Flag, Eyes Next Major RallyTRX Breaks Bullish Flag, Eyes Next Major Rally
TRX just broke out of an ascending flag pattern which shows that the bulls are back in the game.
If we look at the left side of the chart, we can see that the price started the upward movement after breaking out of the ascending triangles.
The same thing is happening now.
The first and most important target is near 0.3330.
If the price manages to break through this area, then it should rise further with targets at 0.3400 and 0.3500.
You can find more details on the chart.
Thank you and good luck! 🍀
⚠️PS: Do your own analysis and use your own strategy to join the trade.
❤️ If this analysis helps your trading day, please support it with a like or comment ❤️
Bearish Ascending Triangle pattern for TRXUSDT on Dailywe can see that clearly on Chart that TRXUSDT forming a clear bearish ascending triangle on Basic Chart Pattern Theories.
Lookin for entry if you notice that TRX forming a weak candle, we can sell on weakness. As always use proper money management and Trade Wisely guys. Happy Profit :)
TRX: Sequential Fakebreaks EmergeTRX: Sequential Fakebreaks Emerge – Strategic Short Setup Aligned with Bearish Trend Momentum
TRX is flashing clear technical weakness as bullish expansion attempts repeatedly encounter intense selling pressure at key resistance ceilings. Within its macro framework, the price action continues to consolidate inside a large ascending triangle. However, the upward push on May 26–27 was swiftly validated as a fakebreak, driving the price into a sharp decline back beneath the dynamic MA100 trendline.
Based on the visual data from the daily chart image_input.png, TRX's short-term structure is coiling sideways within a smaller secondary triangle. Notably, the local breakout attempt on June 22–23 failed again, printing a second fakebreak below the dynamic MA100 ceiling. On July 26, as price candles retested the upper boundary of the smaller triangle, sellers immediately suppressed the price into a steep slide, reinforcing total bear dominance.
The current setup presents two highly actionable Short trading strategies. Traders can proactively initiate sell orders directly around the current resistance cluster to optimize risk-to-reward (RR) metrics, given that the upper boundary of the short-term triangle has been retested twice with strong rejections. Alternatively, patient traders can await a confirmed breakdown below the lower triangle baseline to trade the continuation wave while avoiding holding fees.
Disclaimer: This is not financial advice, DYOR.
TRX: Bulls Defending Key SupportPrimary trend remains bullish
TRON continues to outperform much of the crypto market, with the primary trend still pointing higher. Unlike many major altcoins, price remains relatively close to its all-time high after producing a strong recovery from the early-2026 double bottom.
Moving averages support the trend
The 21/8-week EMAs remain bullishly crossed, with price continuing to hold above both moving averages. As long as this structure remains intact, the longer-term technical outlook continues to favour the bulls.
Support and resistance converging
The $0.32 area continues to act as an important support and resistance zone, while the recent swing high around $0.334 is the first hurdle for the bulls. A convincing break above this level would increase the likelihood of another test of the all-time high.
Support remains key
Repeated bounces from the $0.32 region highlight its importance. A sustained hold here could provide the platform for the primary uptrend to resume, while a decisive loss of support would be the first warning that bullish momentum is fading.
Momentum remains constructive
RSI continues to hold just above the 50 level, while the StochRSI remains in oversold territory. Selling volume has picked up slightly but remains relatively neutral, suggesting neither side has taken firm control.
In Summary
TRON remains one of the stronger charts in the market, with the bullishly crossed 21/8-week EMAs continuing to support the broader uptrend. The $0.32 support and $0.334 resistance are the key levels to watch. A break above resistance would put the all-time high back into focus, while a loss of support would increase the risk of a deeper pullback.
TRX Tron +100% this year, 10x in 3 years (Parabolic, S&P Crypto)Tron is very special, it's the only altcoin that has been pretty much steadily bullish since 2019. As you can see on the chart, this coin is ready for another big, huge pump! I recommend buying TRX immediately because there is a bullish structure (ascending triangle) on the daily chart and fundamentals have never been better.
I think +100% this year is definitely doable and +1000% in the next years as well. Why is TRX different from other altcoins? Well, it's an easy question, you can look at any altcoin, and you will see a huge downtrend of -50% or -95%. On TRX there is no downtrend - it's been going pretty much only up since 2019.
TRX is starting a parabolic phase, number 4. TRX is pretty much like a stock market, it's moving similarly.
Fundamentals and positive news:
1) S&P Crypto Index Inclusion: In July 2026, TRON was selected as one of 18 tokens in S&P's first-ever crypto index, significantly boosting its institutional credibility with traditional investors.
2) TRON remains a primary global blockchain for moving Tether (USDT), hosting over $86 billion in stablecoin supply.
3) High Activity: Processed nearly 950 million transactions with strong daily active user counts and institutional backing.
4) Global Payment Dominance: Crypto payment card volumes grew to $2.4 billion in Q2 2026, capturing a 34% share of all chain-level volume due to widespread merchant acceptance via Visa-linked stablecoin cards.
5) Pyrrho Upgrade Compatibility: A upcoming mandatory node upgrade on August 16, 2026, will introduce the Pyrrho release, improving the network's security and Ethereum Virtual Machine (EVM) compatibility.
TRX: local squeeze with $0.34819 destinationThe Macro Picture 🗺️
TRX pulled back from the $0.37722 macro ceiling into a tight consolidation and now sits at $0.33108, holding above the $0.31382 local low. Price is coiling in the middle of the range with the floor intact — a base rebuilding, not a breakdown.
The Setup ⚙️
The Range Floor 🟢
$0.31382 (Local Low) is the demand shelf, with $0.30743 (Macro Support) as the deeper backstop just below. Both have held, and that's the base this range pivots on.
The Decision Point 🔴
$0.34721 (Local High) is the gate. A daily close above it flips the local structure bullish; the $0.34819 measured-move target sits just above it as the first objective.
The Roadmap 🛣️
Hold above $0.31382 → break $0.34721 → run toward $0.34819. Invalidation is a clean daily close below $0.30743 — that breaks the range.
This is a GRID Range Play: a defined band to rotate, buying the lower half and scaling out into the breakout.
More setups in profile.
#TRX #Tron #crypto #trading #TA #3Commas #GRID
TRON Nears Key Support: A Potential 10% Drop Toward $0.29Hi,
TRON is currently near a key daily support level. If it breaks, I’m expecting a short-term drop of around 10% toward the next weekly support, with a target of $0.29.
Need a little love!
We pour love into every post your support keeps us inspired! Don’t be shy, we’d love to hear from you on comments. Big thanks