Orezone Gold Corporation
No trades
No trades
In-depth trading ideas
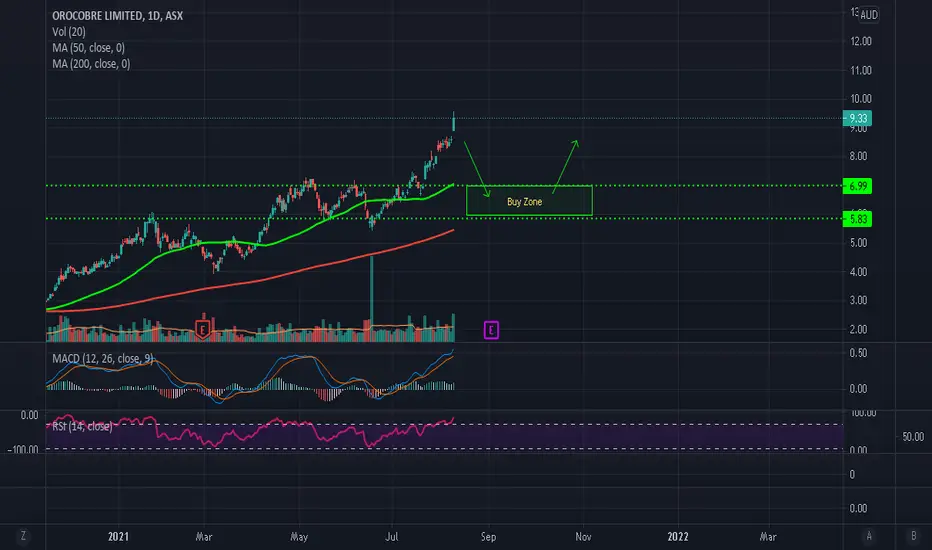
ORE - Trade PlanORE is in a strong uptrend making consecutive higher highs and higher lows. This chart looks healthy but currently the last swing high seems quite overbought as the RSI indicator is in the Overbought Zone. We could see a pullback, and if we do then I would be a buyer at a lower price. My Buy Zone is between $6.00 - $7.00, a good Support zone, and if price comes lower within this zone, I would certainly look for bullish price action to ride the next swing.
Please note these are my own notes, by
Orocobre Time and Price HarmonyOrocobre is a Lithium miner in Australia.
One interesting fact is that on Friday, June 28, extremely high volume pushing the price up 3.5%.
Corrective comes in 3 waves usually and i believe it has just completed Wave 3 on June 18. Wave 1 started on May 6. Usually the end of the wave is confirmed by high volume.
Using Gann analysis, the tops from May 6 to point B is 32 days. The bottoms from A and C is 31 days. Both wave A & C are almost equivalent in price.
In Gann we call it time and
Lithium play on ASXWhile almost every EV stocks are up to the moon in Nasdaq, so as some of the Lithium play on ASX.
Looking at PLS, LYC and ORE in particular, all have been hitting the uptrend since Nov, matching with the Biden's winning of the presidency whom everyone knows is a big advocate of EV. But IMHO, we couldn't ignore the underlying imbalance of Lithium supply when the biggest EV market in the world, China, are making a huge push for EV production in country.
Out of the these three Lithium players on A
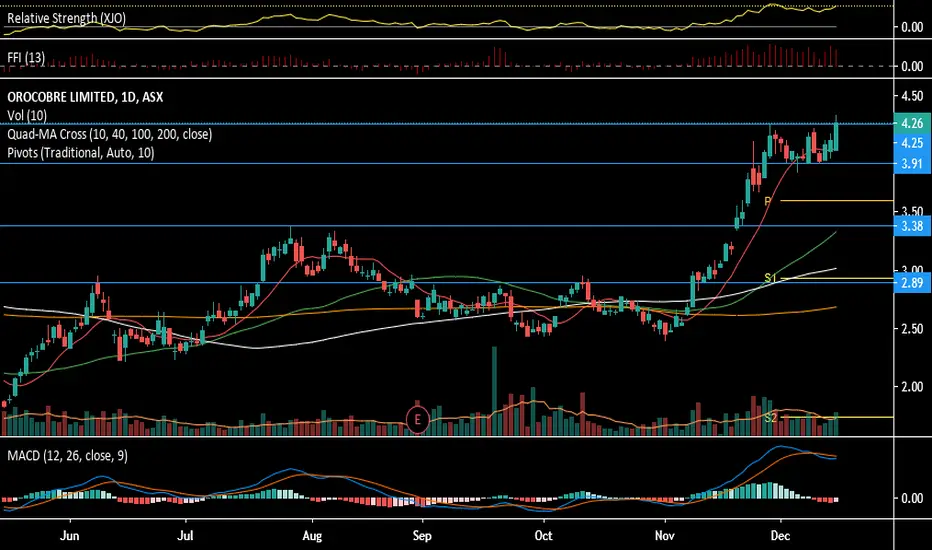
ORE Lithium is on the boomSince November Lithium stocks have continued to rise rapidly. ORE appears to be forming a cup and as such I feel people may want to start taking profits near the previous ATH.
If a cup does form there is no way to tell how long the handle will last as it is too far away for that however Ive marked an area where I feel it may land.
Ill be looking over the area this the next day and deciding If an entry will be made.
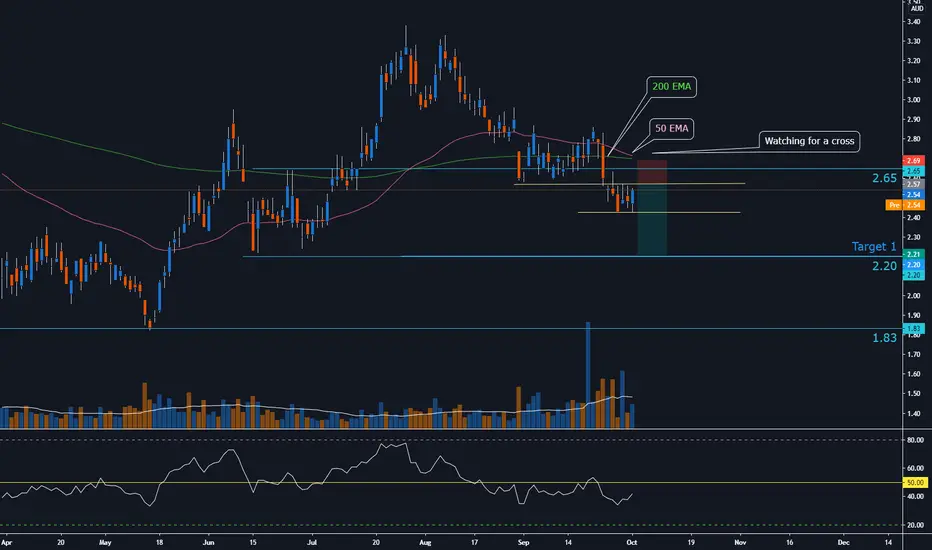
ORE.ASX weakness may continue through $2.20Hello Fellow Trader!
ORE.ASX - Lithium producers have been some of Australia’s favourite stocks for several years supporting the worlds change turning to renewable energy in the battery space lead by Elon Musk and Tesla.
Last weeks Tesla Battery Day was hyped up to be an extremely positive presentation that would skyrocket lithium back into the Australian headlines. Sadly, Elon mentioned how Lithium is not scarce and they have also found ways to extract the commodity from the ground using sal
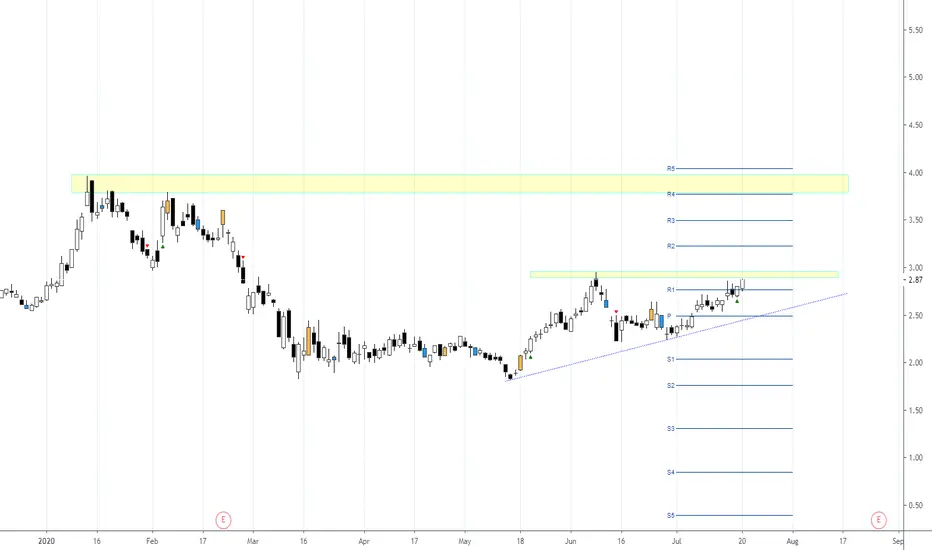
Stock of the week ASX:OREASX:ORE has been on a visible uptrend for the last few days. This chart shows a bullish trend based on following indicators:
- price above historic Resistance zone: 2.8 to 3$
- price above 50MA
- price above 200MA
- velocity is positive
- price above LSMA
- price above 0.618 fib
- chart pattern looks almost like a cup and handle formation though not exactly a cup and handle.
- Increased volume as the price increases.
This stock volatility level is high but it has proven in past to be source of
Stock of the week; ASX:OREASX:ORE has played it right since the mid May. Is this the start of a new uptrend towards the 4$ or maybe towards 6$ ? Lets analyze what the charts say.
Since the day ASX:ORE broke the 50MA - green line - it has been on unstoppable uptrend. This trend has been able to break the 200MA - red line - which historically has acted as resistance. This tells me the bulls have more juice than bears.
On other indicators we can see LSMA showing upward momentum, price above the AVWAP retracing to the Marc
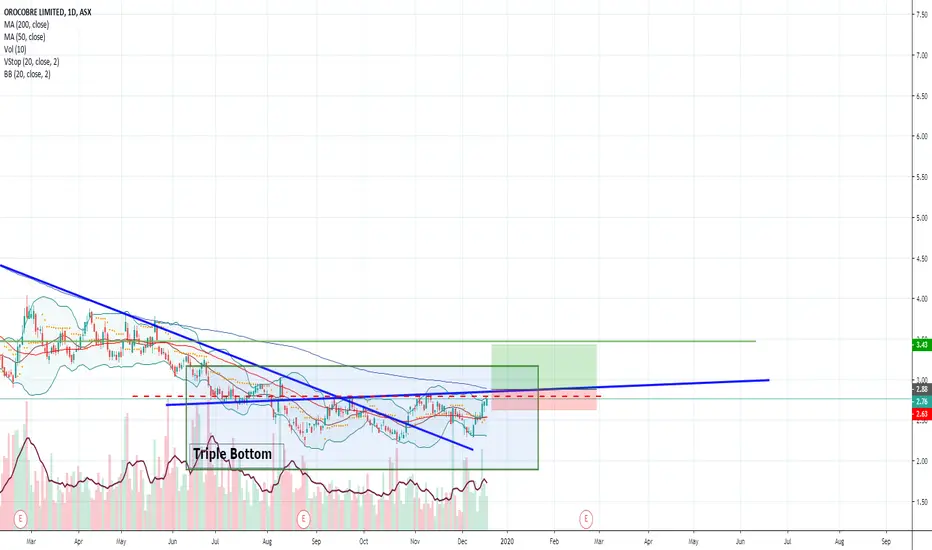
ASX:ORE - Trend break retest (buy the dip?)Anticipating a drop into the green box as a greedy entry point, perhaps on the back of a "sell the news" earnings report which is coming up. Bullish for this year with a belief that a local bottom has been put in for the time being.
Reasoning for the trade:
Location: Reload zone within a reload zone (0.786 line up)
Structure: Triple bottom formed, followed by a volume breakout.
Trend: Break of a 5 touch trend
Impending golden cross on the 1D chart
Cheeky weekly gap
1D chart:
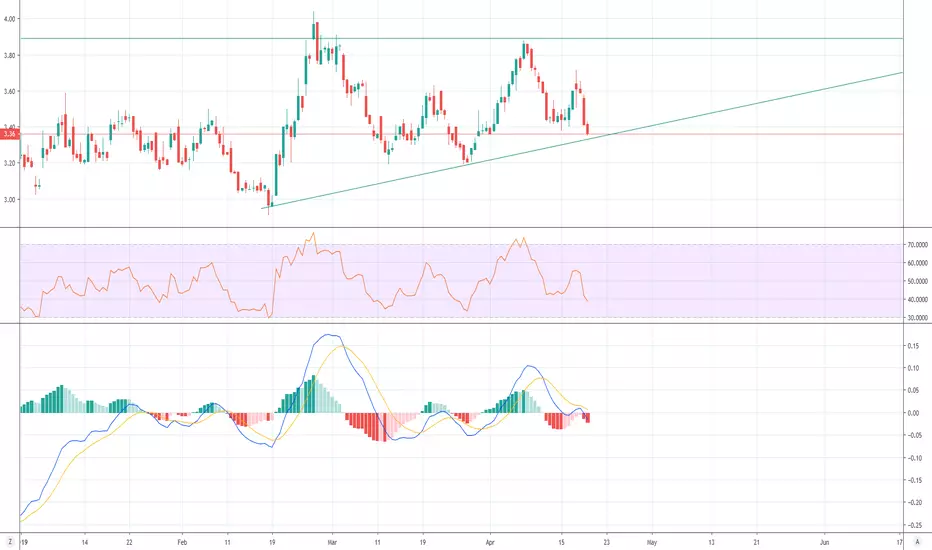
ORE retracement in makingLast post I did on ORE i gave different target for taking profit. My last target was not achieved but I anticipated such retracement. I am waiting to see if 3.2 will hold to buy more positions to see in the 4$ range. Different fibs levels can be target or at least SL level once price crosses them. I will keep you updated.
ORE Trend Line TradeThis is a pretty basic trade. After a very long downtrend the price has reached the bottom and a triple bottom has formed. The lower horizontal trend line indicates the immediate short term price target, however we can use this for a trigger in combination with a cross on the 200 day MA. Now normally the peak line of the triple bottom will be flat, as indicated by the dotted red line I have drawn in. However I'm going to do it different today. The lower trend line is anchored back on a congestio