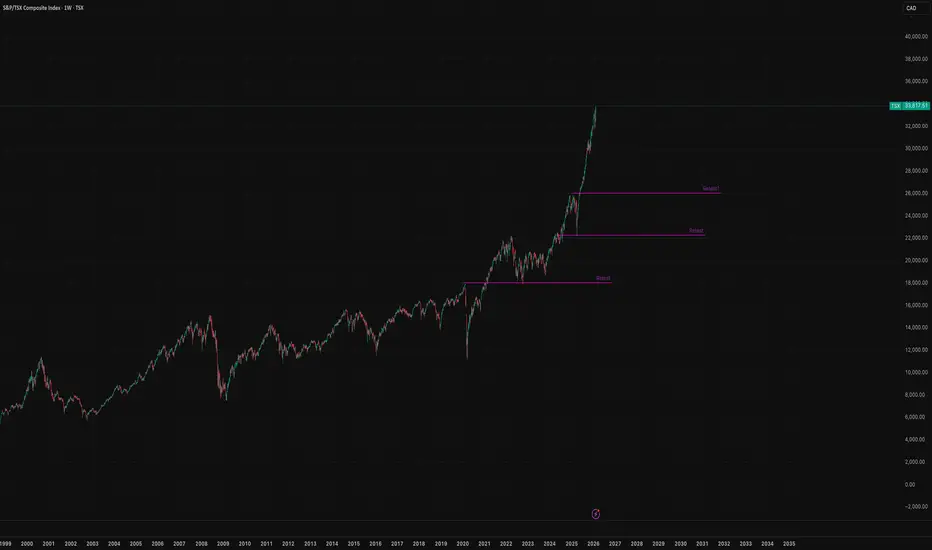
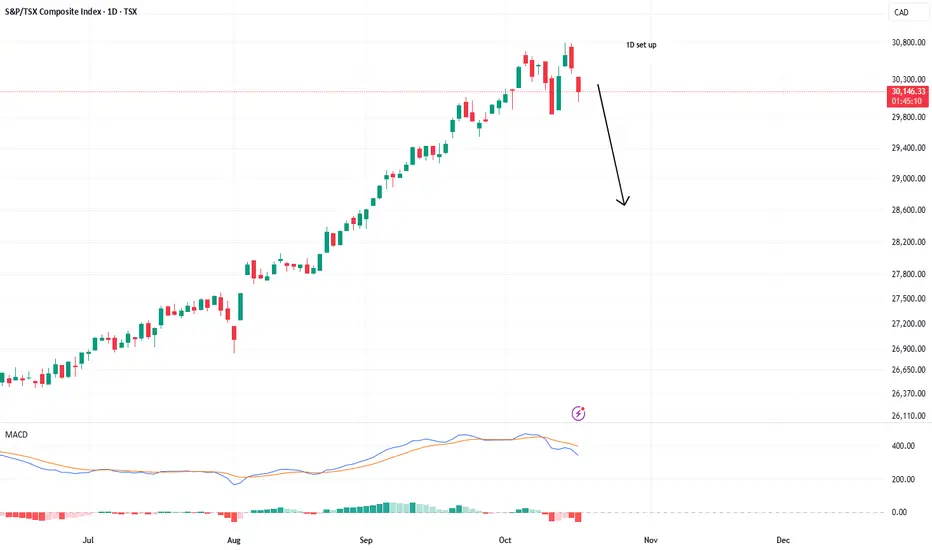
TSX Composite Index — Bearish Setup | Selling MomentumThe S&P/TSX Composite Index is developing a more fragile short-term structure, with recent price action showing repeated downside pressure and increased volatility. The index closed at 35,800.89 on 25 September 2026, after trading between 35,587.49 and 35,844.24 during the session.
From a technical perspective, the selling setup is built around the recent sequence of weakness and the inability of price to sustain stronger advances. The index has experienced several sharp directional swings thro
S&P/TSX Composite Index
No trades
No trades
In-depth trading ideas
TSX Potential ImbalanceThe S&P/TSX Composite enters a pivotal week as Canada’s major banks report ( TSX:BMO TSX:RY TSX:CM TSX:BNS TSX:NA TSX:TD ) earnings within a compressed timeframe (Feb 24-26, 2026), creating the potential for short-term market imbalance. With financials representing roughly 30% of the index, even modest earnings disappointments or cautious forward guidance could disproportionately pressure the broader market. Investors are closely watching credit loss provisions, net interest margin
TSX Canadian stock index DAILY BULLISHThe primary Canadian stock index is the S&P/TSX Composite tracking about 250 large-cap companies listed on the Toronto Stock Exchange.
Index Details
Launched in 1977, it's market-cap weighted with heavy emphasis on financials (~33%), energy (~17%), materials (~12%), and industrials, reflecting Canada's resource-driven economy. A
CA10Y (Canada 10-year government bond yield) and BOC (Bank of Canada) rates significantly influence TSX price action through borrowing costs, economic growth signals, an
TSX Canadian stock index The primary Canadian stock index is the S&P/TSX Composite tracking about 250 large-cap companies listed on the Toronto Stock Exchange.
Index Details
Launched in 1977, it's market-cap weighted with heavy emphasis on financials (~33%), energy (~17%), materials (~12%), and industrials, reflecting Canada's resource-driven economy. A
CA10Y (Canada 10-year government bond yield) and BOC (Bank of Canada) rates significantly influence TSX price action through borrowing costs, economic growth signals, an
The TSX is forming a rare Head & Shoulders top reversal patternA head and shoulders top is a common chart pattern in technical analysis that signals a potential reversal from an uptrend to a downtrend. Here’s how it works:
The Setup:
The price of an asset is rising in an uptrend.
The pattern forms as the price creates three peaks (or highs) with two valleys (or lows) in between.
The Pattern:
Left Shoulder: The price rises, then dips slightly.
Head: The price rises again, this time higher than the first peak, and then dips.
Right Shoulder: The price
S&P/TSX Composite Index Continues Record-Breaking MomentumCurrent Market Situation:
The S&P/TSX Composite Index closed slightly above 24,050 on Friday, marking a 0.7% weekly gain and continuing its record-breaking trend.
Driving Factors:
Weak GDP data for August pointed to economic stagnation, reinforcing expectations of a dovish stance from the Bank of Canada, which improved market sentiment.
Gains in energy and financial sectors helped buoy the index. Notable stocks like Imperial Oil and TD Bank rose over 0.6%.
Challenges:
Declines in major stocks
TSX Index SeasonalityThe TSX index doesn't react exactly the same every year, however it's interesting to note how closely 2023 followed the 42 year historical trend. Seasonality helps you to figure out the market general direction instead of having to fight it.
Comment below if you have ideas to improve on the strategy!
TSX high volume + High risk shortDaily high volume at the top of the resistance line
Not high volume on break of resistance line
Trend still bounce between support and resistance lines
However oil is super strong which could be bullish for TSX
Fed decision this coming Wednesday
High risk: Short to support line
or wait to evaluate next week
HXD or HXU
TSX, Low-Momentum Market, FLAG-FORMATION Sets Up A HUGE PLUNGE!Hello There!
Welcome to my new analysis about the TSX CANADIAN STOCK MARKET INDEX on the 2-day timeframe perspectives. When approaching this stock market index it is necessary to view the prevailing sector stocks market situations firstly, in the recent times a precarious devaluing in the Canadian Dollar CAD has taken place, this has shown up within the Canadian Dollar Currency Index CXY as well as the fact that the Canadian central bank is continuing with aggressive rate hikes to tackle a wi
TSX, Setting Up To For Possible A Alteration In Perspective!Hello Traders Investors And Community,
Welcome to this analysis where we are looking at TSX 4-hour timeframe perspective which is showing up some quite interesting signals at the moment. As the main market has recovered from the corona-breakdowns seen this year the meaningful question is now if these recoveries are fundamentally backed to follow-up into a healthy market environment or if the bear-market-pressure will increase again similar to those price-actions contributed this year, as the b
TSX will continue its sidewaysAfter the recent low move ,TSX will continue move in the sideways .
The sideway move will continue for some time.
The next move will be decided based on the side moves .Looking at the Global moves after the side move market will go up.
More Ideas and Scripts :
www.tradingview.com
www.tradingview.com
TSX RecessionThe S&P/TSX Composite Index is the benchmark Canadian index, representing roughly 70% of the total market capitalization on the Toronto Stock Exchange with about 250 companies included in it. The Toronto Stock Exchange is made up of over 1,500 companies. It replaces the earlier TSE 300 index.