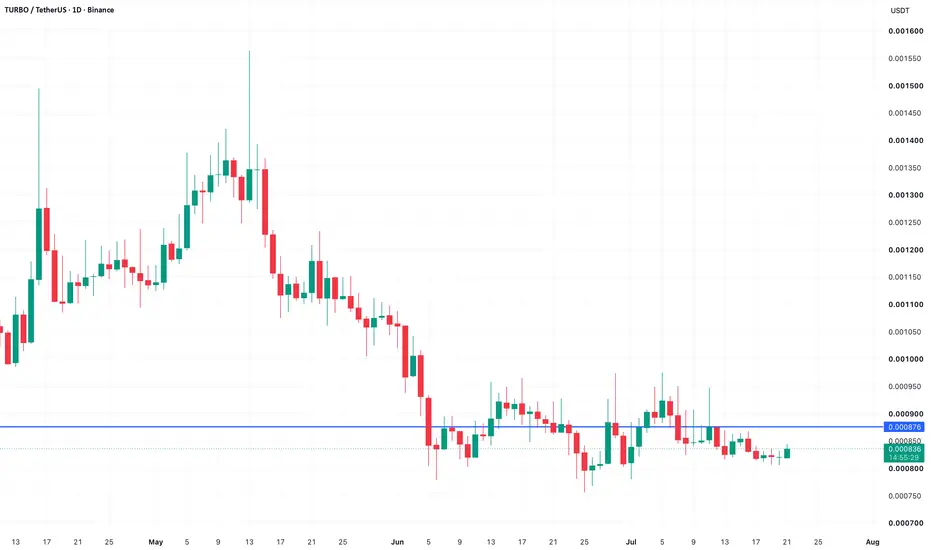
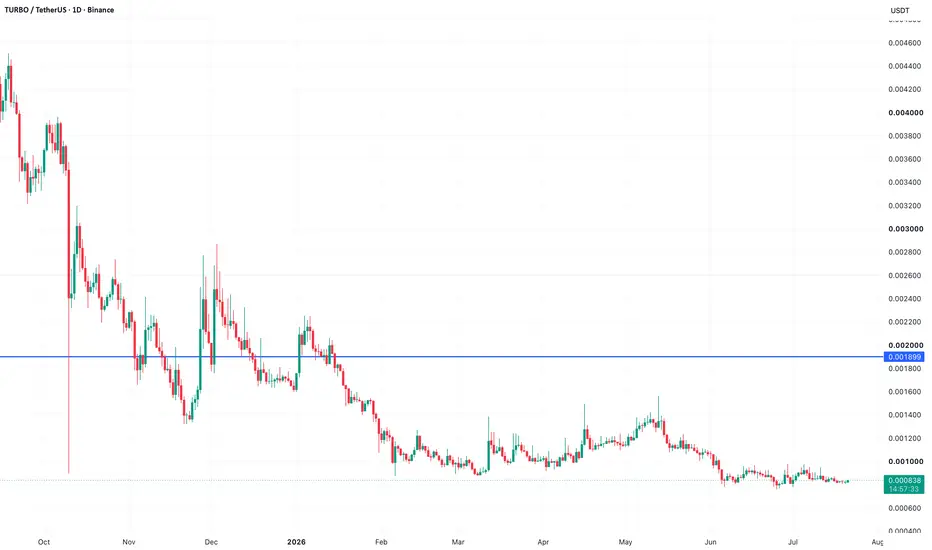
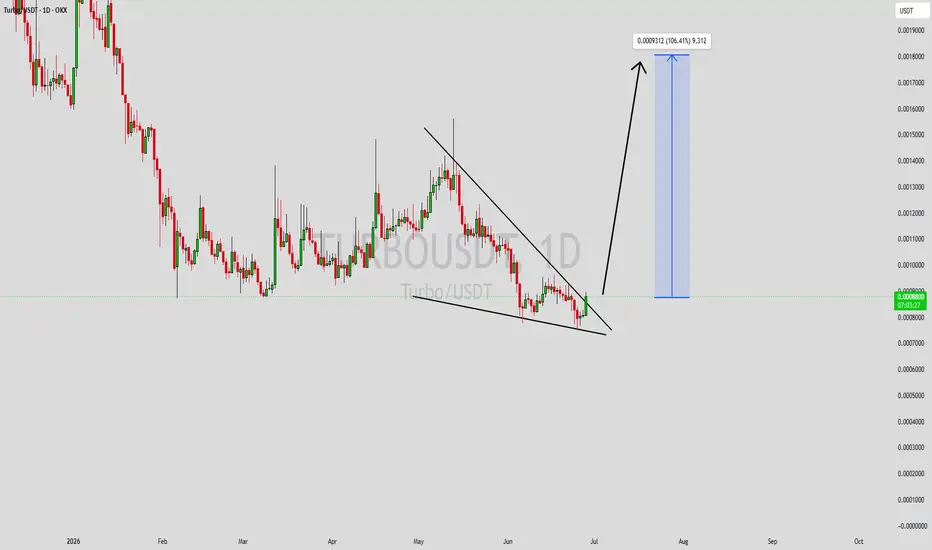
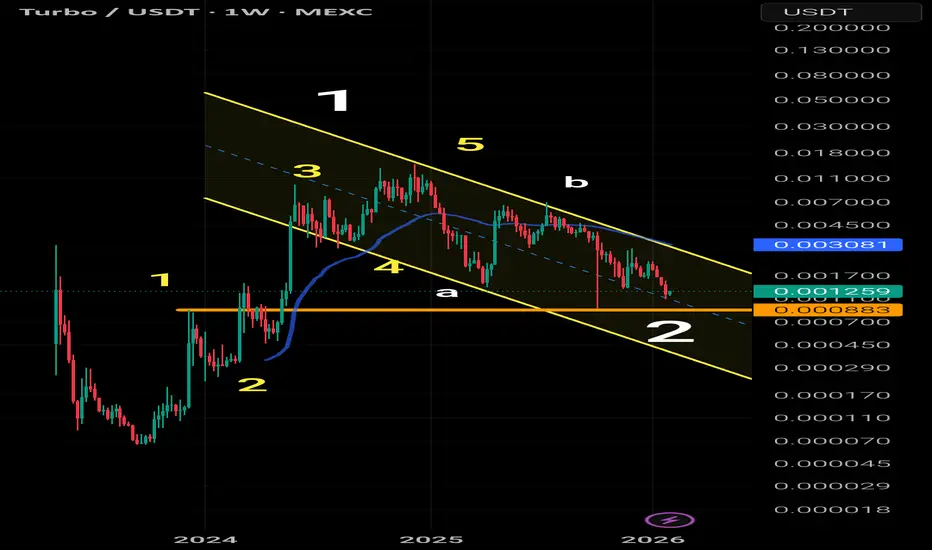
TURBO ForecastBINANCE:TURBOUSDT Trade Logic 📈
Turbo structure is bullish. On the lower time frame, we have a healthy correction, with the final bearish leg losing momentum.
This could signal another bullish move, but the setup isn’t strong enough for aggressive targets.
Risk: ~0.5% — Small risk. Controlled trade!
I appreciate hearing your technical opinions and insights on this potential scenario.
⚠️ Risk Disclaimer
All analyses, market views, and scenarios presented on this page are provided for inform
TURBO / TetherUS
No trades
No trades
In-depth trading ideas
TURBO — Falling Wedge, Breakout or Breakdown?📊 Technical Analysis — SET:TURBO
Time Frame: ⏳ 5D
Current Price: 💵 ~0.0010115 USDT
Pattern: 📐 Long-Term Falling Wedge
Structure: 🔴 Bearish trend, but approaching a potentially important bullish reversal zone
---
📐 🔻 Pattern: Long-Term Falling Wedge
TURBO has been forming a large Falling Wedge pattern over an extended period following the major high around 0.01445 USDT.
The structure is defined by two descending trendlines:
🔻 Upper descending trendline — acting as dynamic resistance and r
TURBOUSDT Forming Bullish MomentumTURBOUSDT is forming a clear bullish momentum pattern, a classic bullish reversal signal that often indicates an upcoming breakout. The price has been consolidating within a narrowing range, suggesting that selling pressure is weakening while buyers are beginning to regain control. With consistent volume confirming accumulation at lower levels, the setup hints at a potential bullish breakout soon. The projected move could lead to an impressive gain of around 40% to 50% once the price breaks abov
$TURBO Breakout Could sent 20x From Accumulation Zone?SET:TURBO Is Compressing For A Massive Breakout | Could $0.011 Be The Next Target?
#TURBO is trading inside a prolonged descending structure on the weekly timeframe, with price compressing between a descending resistance trendline and long-term dynamic support.
The key development is the reaction from the $0.00077–$0.00090 accumulation zone, where downside momentum has repeatedly been absorbed. Price is now pressing toward the structural breakout area around $0.00110.
A decisive weekly close
TURBOUSDT 1D#TURBO is moving inside a falling wedge pattern on the daily chart. Consider entering this coin only after a confirmed breakout above the wedge resistance.
In that case, the potential upside targets are:
🎯 $0.001115
🎯 $0.001255
🎯 $0.001397
🎯 $0.001539
🎯 $0.001740
🎯 $0.001997
⚠️ Always remember to use a tight stop-loss and maintain proper risk management.
TUBOUSDT Forming Falling WedgeTURBOUSDT is forming a clear falling wedge pattern, a classic bullish wave signal that often indicates an upcoming breakout. The price has been consolidating within a narrowing range, suggesting that selling pressure is weakening while buyers are beginning to regain control. With consistent volume confirming accumulation at lower levels, the setup hints at a potential bullish breakout soon. The projected move could lead to an impressive gain of around 90% to 100% once the price breaks above the
TURBO Testing Key Breakout Zone Inside Macro DowntrendTURBO has been trading inside a long-term descending channel, but recent price action is starting to show a structural shift.
After forming a rounded base near the channel lows, price created an ascending structure with higher lows and is now pressing against the key resistance zone around 0.00115 – 0.00120.
What’s happening:
Bullish accumulation forming near the bottom of the channel
Higher lows continue to build pressure
Price attempting breakout from short-term ascending triangle structure
TURBOUSDT Forming Falling WedgeTURBOUSDT is forming a clear falling wedge pattern, a classic bullish reversal signal that often indicates a potential breakout after a prolonged corrective move. The price has been steadily compressing within a narrowing downward channel, showing that selling pressure is gradually weakening while buyers are beginning to step in at lower levels. This tightening structure often signals that the market is preparing for a shift in momentum.
The projected breakout from this falling wedge could lead
TURBO/USDT – Descending Channel: Reversal or Another Dump?On the 2D timeframe, the TURBO/USDT pair is moving within a clearly defined Descending Channel pattern.
This channel is characterized by:
🔻 Consistent Lower Highs (LH) at the upper trendline (red resistance)
🔻 Maintained Lower Lows (LL) at the lower trendline (yellow support)
📉 This structure reflects a dominant bearish trend in the medium term
However, price is now approaching the channel resistance area ⚠️, which is a critical point for determining the next move.
---
📐📉 Pattern Explan
TURBOUSDT Forming Bullish MomentumTURBOUSDT is forming a clear bullish momentum pattern, a classic bullish wave signal that often indicates an upcoming breakout. The price has been consolidating within a narrowing range, suggesting that selling pressure is weakening while buyers are beginning to regain control. With consistent volume confirming accumulation at lower levels, the setup hints at a potential bullish breakout soon. The projected move could lead to an impressive gain of around 90% to 100% once the price breaks above t
TURBOUSDT UPDATETURBO Technical Setup Pattern: Falling Wedge Breakout Current Price: $0.001216 Target Price: $0.00200 Target % Gain: 75.94% TURBO is breaking out of a falling wedge pattern on the 1D chart with price reclaiming resistance and showing bullish momentum after a prolonged downtrend, structure suggests a potential reversal with continuation likely if volume supports the move Time Frame: 1D
TURBOUSDT 1DConsider buying a bag of #TURBO. Volume is strong, and the chart looks promising. In case of a breakout above the descending resistance and the Ichimoku Cloud, the upside targets are:
🎯 $0.001386
🎯 $0.001699
🎯 $0.001952
🎯 $0.002205
🎯 $0.002565
🎯 $0.003024
⚠️ Always remember to use tight stop-losses and maintain proper risk management.
#TURBO#TURBO has broken out of a falling wedge pattern 🚀 and is currently consolidating near the 0.0010166 level. The falling wedge breakout suggests a potential trend reversal 🔄 with increased buying pressure. The next target for #TURBO is around the 0.0010700 resistance level🎯.
Always wait for confirmation before entering a trade and manage your risk accordingly ✍️.
#TURBO #crypto #trading #altcoin
TURBO/USDT — strong momentum, but speed is the riskFast markets attract attention.
But they don’t forgive bad positioning.
Right now TURBO is trading around 0.00117 after a strong impulsive move, holding near short-term support.
The structure is bullish — but the environment is aggressive.
What the current structure shows
• Strong bullish bias (buyers in control)
• Price holding near support → structure intact
• Momentum still active
At the same time:
• High volatility
• Speculative liquidity
This is key.
High volatility + speculative f
TURBOUSDT Forming Falling WedgeTURBOUSDT is forming a clear falling wedge pattern, a classic bullish reversal signal that often indicates an upcoming breakout. The price has been consolidating within a narrowing range, suggesting that selling pressure is weakening while buyers are beginning to regain control. With consistent volume confirming accumulation at lower levels, the setup hints at a potential bullish breakout soon. The projected move could lead to an impressive gain of around 140% to 150% once the price breaks above
TURBOUSDT Forming Falling WedgeTURBOUSDT is forming a clear falling wedge pattern, a classic bullish reversal signal that often indicates an upcoming breakout. The price has been consolidating within a narrowing range, suggesting that selling pressure is weakening while buyers are beginning to regain control. With consistent volume confirming accumulation at lower levels, the setup hints at a potential bullish breakout soon. The projected move could lead to an impressive gain of around 90% to 100% once the price breaks above
Just a couple of lines.Depending on what waves of liquidity will be pumped from bitcoin to slagcoins,
many things are possible. Faster? Lower price.
Slower? More accumulation, stronger level protection.
LaRSI may be preparing to storm the 20 line on the weekly chart.
Positive.
You may agree or disagree, at your discretion.