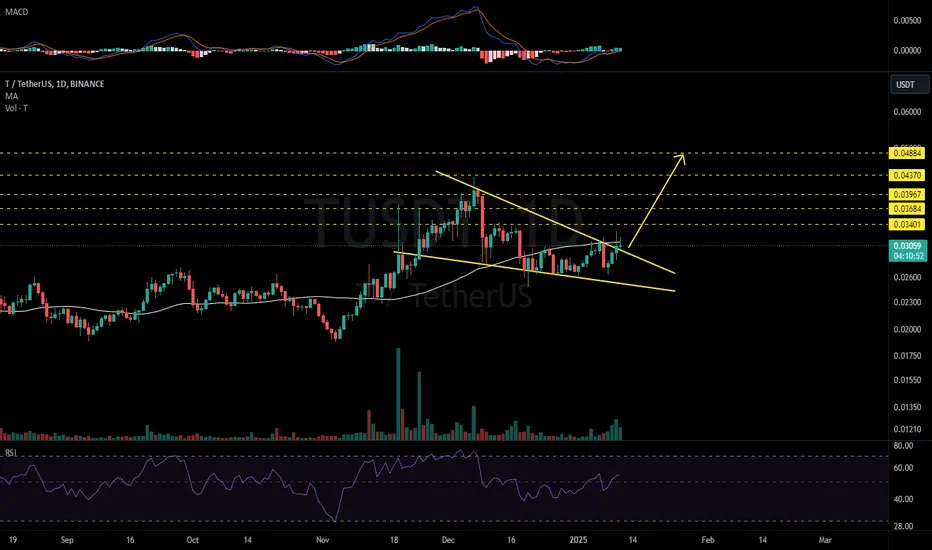
#T — Massive Falling Wedge Breakout on Weekly Chart! T — Massive Falling Wedge Breakout on Weekly Chart! 🚀📈
$T (Threshold) has officially broken out of a multi-year Falling Wedge pattern on the 1W timeframe! Price action has cleared the upper resistance trendline, signaling a major macro trend reversal for the coin.
When multi-month macro wedges break to the upside, the following expansion waves are usually swift and explosive! 🎯
💵 Coin: T (Threshold) / USDT
⌛ Time Frame: 1W (Weekly)
📉 Pattern: Falling Wedge (Macro Multi-Month Structure)
🏦 E
T / TetherUS
No trades
No trades
In-depth trading ideas
TUSDT Squeeze Building at Price Floor With OBV Inflow Quietly StTUSDT at 0.00630 with futures at 29.52M against spot 21.78M — 1.31x Spot Heavy, near parity with slight futures lean. Dollar side 185.99K futures versus 137.21K spot confirms a balanced market, no ghost market flag here. Spot participation is real.
Signal board thin at 22 green out of 112, Moderate BULL 17.17% scoring 1.41x. Ichi leads at 7-6, C>T 7-6, EMA 4-2 — all marginal. Candle 3-0 is the cleanest sub-signal. DD/SS the loudest warning at 1-8, heavy supply side loading. Squeeze elevated 7 b
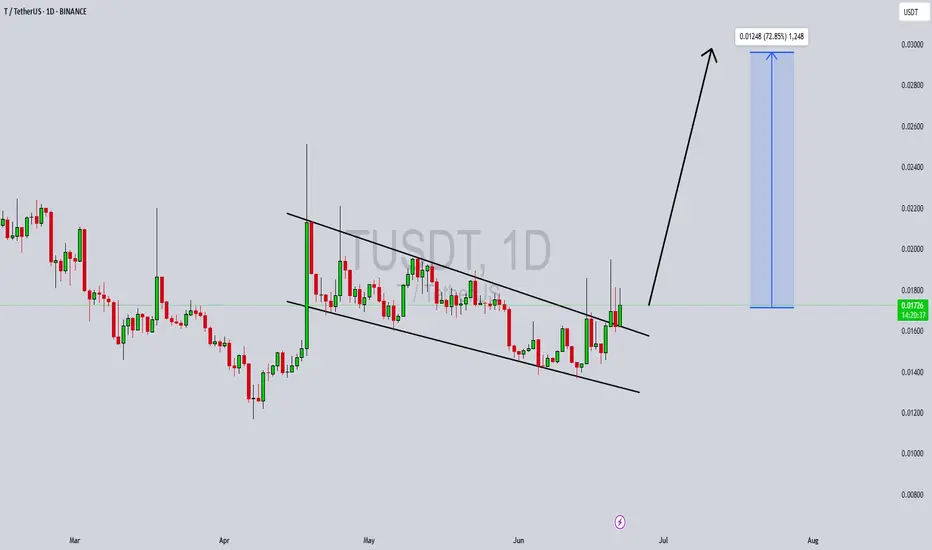
TUSDT Forming Descending Channel TUSDT is currently trading within a clearly defined descending channel pattern, which is a classic bullish reversal signal when identified in the right market context. After a prolonged period of correction, the price is now consolidating within the lower boundary of the channel, signaling that a potential breakout could be near. Historically, descending channels often precede strong bullish reversals, especially when accompanied by rising volume and increased investor interest—which we’re now s
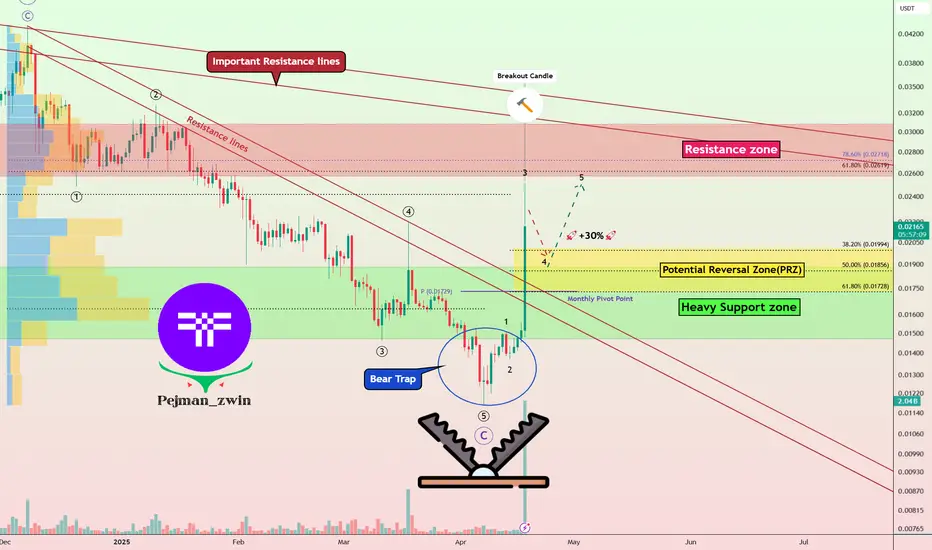
Threshold Network(T) Analysis: From Bear Trap to Bullish TrendAs long as Bitcoin ( BINANCE:BTCUSDT ) and Ethereum ( BINANCE:ETHUSDT ) are in a range, it is a good opportunity to take advantage of the movement of other tokens and take a look at their charts.
Today, I want to analyze the Threshold( BINANCE:TUSDT ) project for you, which has increased by +70% .
What Is the Threshold Network?
Threshold Network is a decentralized protocol that combines cryptography and privacy to power secure, permissionless applications. It enables users to pro
#T (SPOT) entry (0.026- 0.032) T.(0.13600) SL(0.02579)BINANCE:TUSDT
entry range (0.026- 0.032)
Targets ( .034 - .045 - .048 - .059 - 0.065 - 0.095 - 0.1149 - 0.136 )
SL .4H close below (0.02579)
______________________________________________________________
Golden Advices.
********************
* collect the coin slowly in the entry range.
* Please calculate your losses before the entry.
* Do not enter any trade you find it not suitable for you.
* No FOMO - No Rush , it is a long journey.
Useful Tags.
****************
My total posts
ww
Is the threshold coin ready for intergalactic flight?Dear Traders,
I would like to bring your attention to a promising opportunity, the NYSE:T coin. As you may have observed, the triangle breakout occurred successfully last week, followed by a positive retest. Currently, we are witnessing a significant increase in daily trading volume and a favorable chart pattern. Based on these indicators, I anticipate a substantial upward movement in the near future. However, it is crucial to exercise patience and discipline in order to capitalize on this po
T price analysis. Fix profit at this targetsWhere more than ok to fix profit GATEIO:TUSDT
Possible Targets and explanation idea
➡️IAP model still relevant since Feb 2022. Invalidation drop under listing price
➡️Long time like you can see accumulation around the best block to buy 0.78/0.86 lvl
➡️2 times we tested 0.5 level like resistance. Main targets its a 27 block 1.3b m cap
➡️And sweep ath 2.12 b market cap. Globally we can form just one big range
➡️And in a next bear market after Ath sweep we will fall under listing price
➡️Money
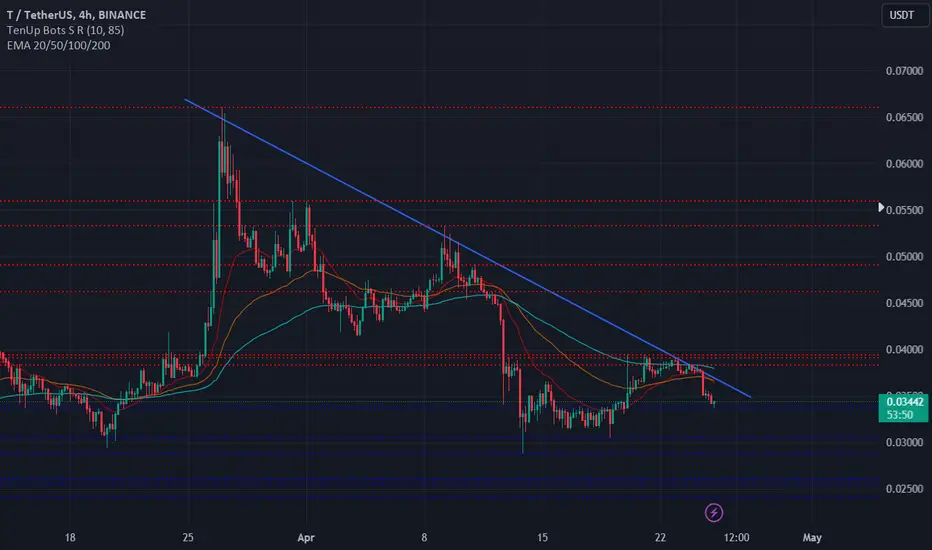
T/USDT PLAN T/USDT appears promising for a potential bullish advancement. The price is currently surpassing the trendline resistance on the 6-hour time frame. A successful breakout could indicate a forthcoming bullish move of around 50-80% in the coming days. Please note that this is not financial advice; always conduct your own research (DYOR).
TUSDT Technical Analysis in 3-Day TimeframeHello everyone, I’m Cryptorphic.
For the past seven years, I’ve been sharing insightful charts and analysis.
Follow me for:
~ Unbiased analyses on trending altcoins.
~ Identifying altcoins with 10x-50x potential.
~ Futures trade setups.
~ Daily updates on Bitcoin and Ethereum.
~ High time frame (HTF) market bottom and top calls.
~ Short-term market movements.
~ Charts supported by critical fundamentals.
Now, let’s dive into this chart analysis:
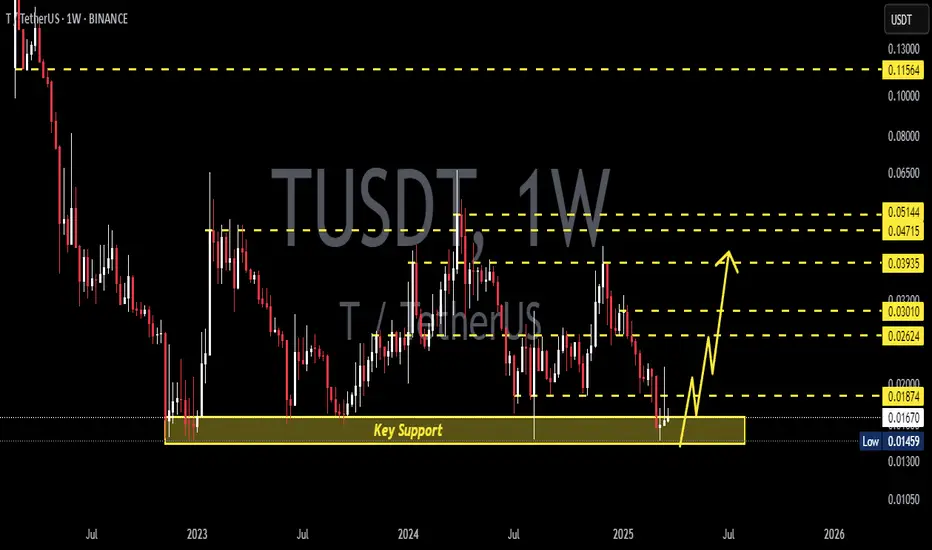
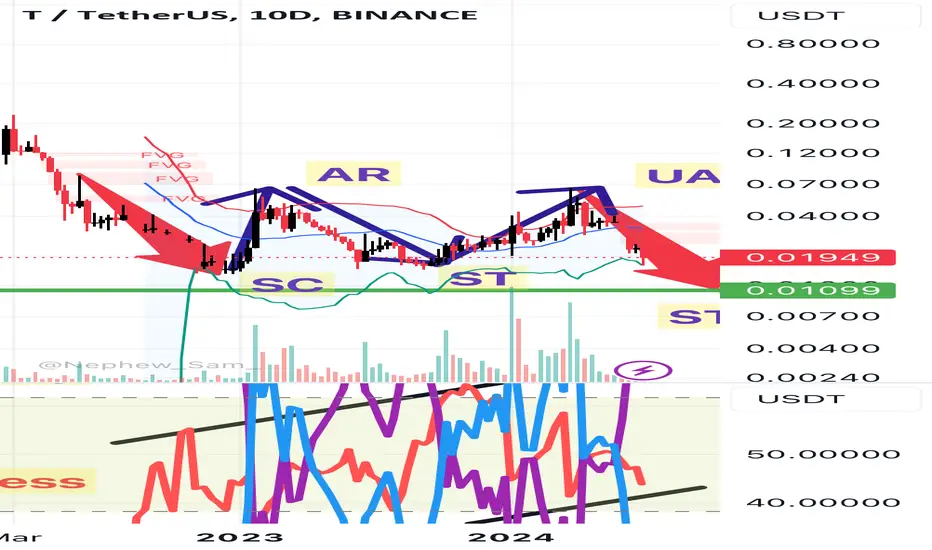
TUSDT is in a downtrend and has currently reach
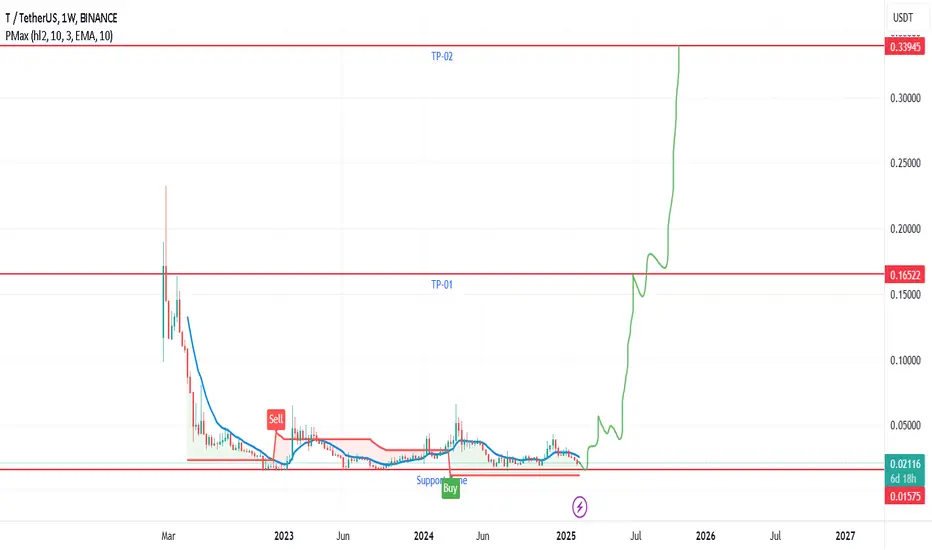
T/USDT THE NEXT LIQUIDY TOKENT has formed a huge accumulation of liquidity, it is impressive how much the bots can manipulate by correlating with btc, just press quick sales in a short time in the book to settle the part purchased, both spot and futures, causing the institutional orders below to be filled and they take advantage of a increase of more than 700% while many think it is impossible, be aware of these short-term manipulations they can do anything while no one can look, an embryonic currency with little liquidity