Guys, $TUT has pushed straight into a major resistance box arounGuys, $TUT has pushed straight into a major resistance box around $0.05–$0.08 after this massive pump.
This box is the key. Breaking and holding above it would turn the setup bullish. But personally, I think price is more likely to spend some time trading inside this zone before eventually losing it.
If the box breaks down → a deeper correction can follow.
For now, I’m watching the $0.08 rejection closely. After a +67% move, chasing here is risky.
In-depth trading ideas
TUT SPARKS SHORT SQUEEZE$TUT Tutorial's price surged massively in 24 hours to after Aster DEX listed TUT perpetuals with 5x leverage on 6 August 2026. The move triggered a classic short squeeze. Technical indicators show the token is deeply overbought. This is bullish for TUT in the short term as it demonstrates strong speculative demand and exchange support. However, it's neutral to bearish for sustainability because the overbought condition and high whale concentration (top 5 wallets control 86.60% of supply) create significant price risk if leverage-driven momentum fades. The official TUT account noted the token had climbed around 53% over the prior month. The thread framed this technical strength as a byproduct of building a "decentralised education platform" that turns content into knowledge and rewards educators on BNB Chain. This is bullish for TUT's long-term narrative because it shifts focus from pure meme speculation to a utility-driven story centered on Web3 education and onboarding. The community-led messaging aims to convert short-term chart attention into sustained engagement with the platform's products. A weekly report announced several ecosystem developments: TUT became accepted for crypto-backed loans on CoinRabbit, won a grant from Four meme, partnered with Unstoppable Domains to launch .learn Web3 domains, and saw its TUT/USDC pair listed on 2themoon with 0% fees. This is bullish for TUT's fundamental utility as each partnership expands its use cases—from DeFi collateral and domain identity to improved liquidity access. These integrations strengthen the token's role within its niche and support the project's educational mission beyond mere trading. TUT's trajectory is currently defined by a volatile mix of speculative trading and genuine ecosystem development. The key question is whether the project's educational utility can sustain value once the leverage-fueled buzz subsides.
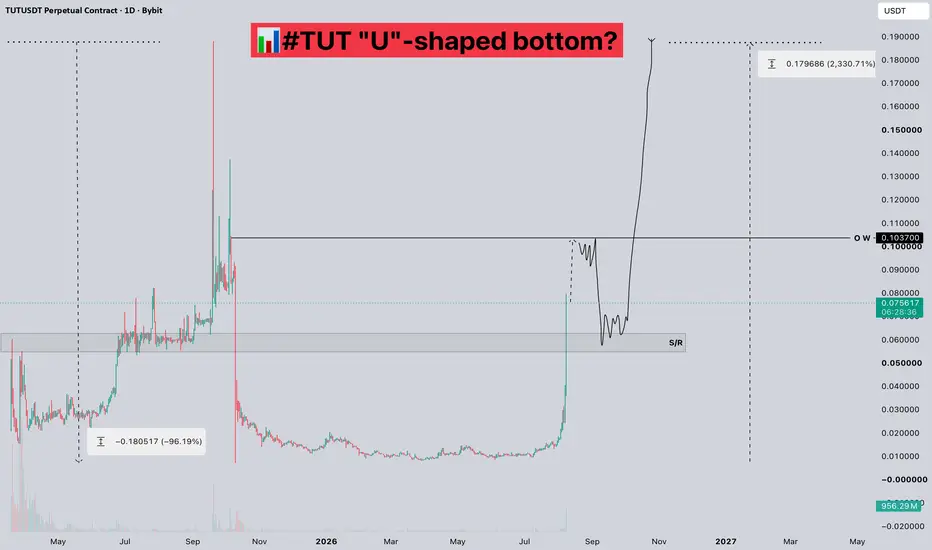
#TUT "U"-shaped bottom?📊#TUT "U"-shaped bottom?
🧠 From a chart perspective, we seem to be forming a U-shaped bottom, with extremely high market activity and trading volume. Therefore, a 1000% increase is possible, in my opinion.
➡️ Also, isn't the name of this coin interesting?
🤜Follow me, and I'll guide you through market changes. Remember to like💖 and share💬
BYBIT:TUTUSDT.P
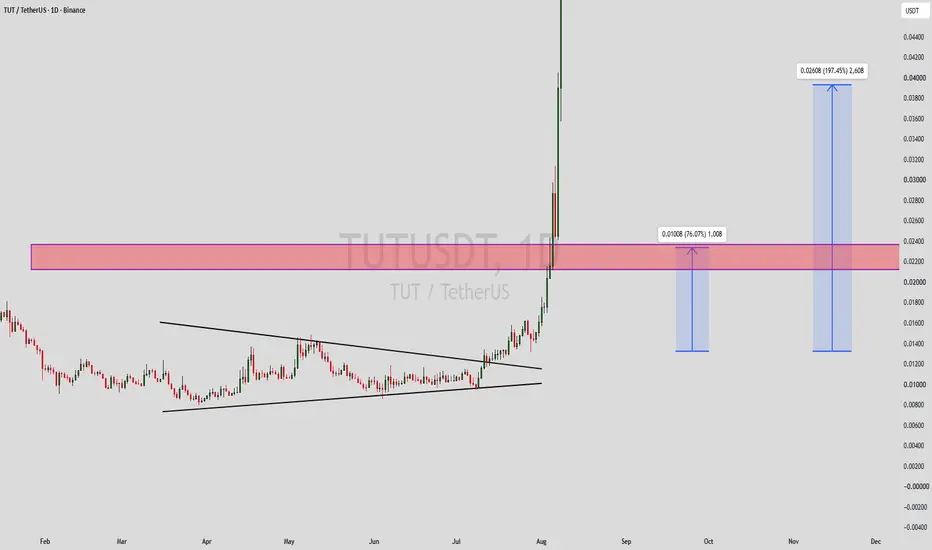
TUTUSDT Forming Ascending ChannelTUTUSDT is forming a clear ascending channel pattern, a classic bullish wave signal that often indicates an upcoming breakout. The price has been moving within a rising range, suggesting that selling pressure is weakening while buyers are beginning to regain control. With consistent volume confirming accumulation at lower levels, the setup hints at a potential bullish breakout soon. The projected move could lead to an impressive gain of around 190% to 200% once the price breaks above the channel resistance.
This ascending channel pattern is typically seen during recovery phases or after corrective movements, and it represents a potential shift in market sentiment from bearish to bullish. Traders closely watching TUTUSDT are noting the strengthening momentum as it approaches a breakout zone. The healthy trading volume adds confidence to this setup, showing that market participants are positioning early in anticipation of continued upside.
Investors’ growing interest in TUTUSDT reflects rising confidence in the project's long-term fundamentals and current technical strength. If the breakout confirms with sustained buying volume, this could mark the start of a fresh bullish leg. Traders might find this a valuable setup for medium-term gains, especially as the ascending channel completes and buying momentum continues to accelerate.
✅ Show your support by hitting the like button and
✅ Leaving a comment below! (What is You opinion about this Coin)
Your feedback and engagement keep me inspired to share more insightful market analysis with you!
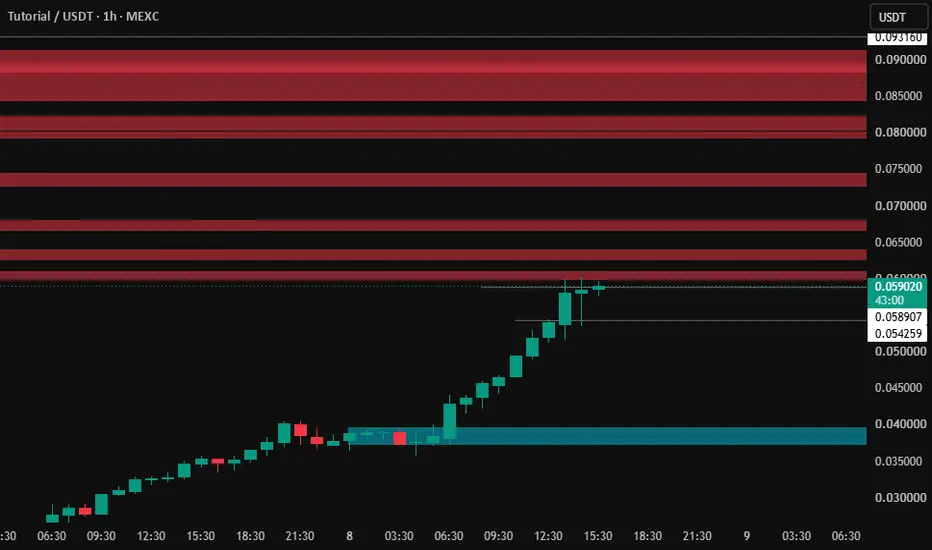
#TUTUSDT 1h#TUTUSDT 1h
$TUT
#TUT could give us a good profit.
To take a short position, we can enter from any of the red zones after getting confirmation.
How?
Price needs to reach the zone without engulfing it.
Then, on the 1-hour timeframe, a bearish candle needs to form and engulf the last bullish candle.
Once that happens, you can enter a short position.
At 1R, move your stop loss to breakeven, and the target is the blue zone.
However, because the bullish rally is strong, this is a risky setup.
We'll keep an eye on it.
TUTUSDT 1D#TUT is currently trading within a symmetrical triangle pattern on the daily chart.
Consider entering this coin only after a solid breakout above both the daily SMA200 and the triangle resistance. If the breakout is confirmed, the following upside targets could come into play:
🎯 $0.01430
🎯 $0.01616
🎯 $0.01802
🎯 $0.02067
🎯 $0.02405
⚠️ Always remember to use a tight stop-loss and maintain proper risk management.
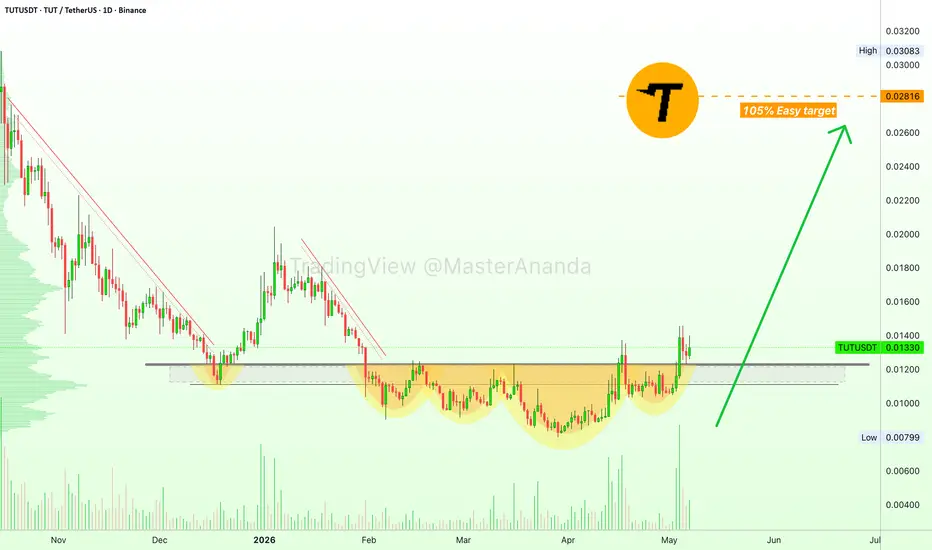
Tutorial (TUT): 100% Easy target & short-term setup —1 paragraphHere we have a dividing line between bears and bulls, the bearish and bullish zone, right around 0.1200. Below this line TUTUSDT wasn't really trending but more like consolidating. Above this line, a change of trend can develop. Notice how trading volume has been rising steadily for the past five months. Notice the size of the green bars vs the red ones. Accumulation has been taking place. Now that the action has recovered above the long-term bottom, we can expect a nice jump. This is a short-term trade setup and we are aiming for a nice and easy 100%. The target can be seen on the chart. This level can hit within several weeks just as it can take only a few days. It depends on when the market force reaches this project. The bulls have the upper-hand.
Namaste.
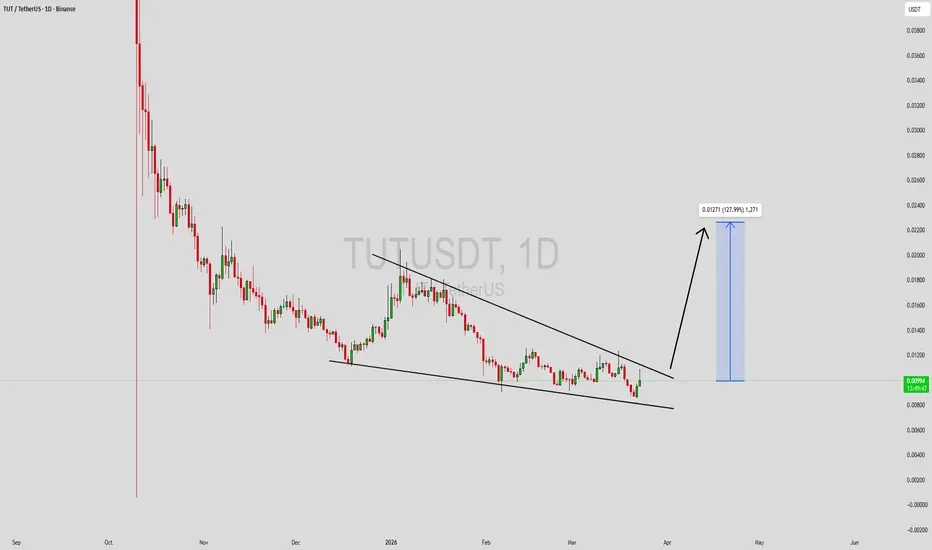
TUTUSDT Forming Falling WedgeTUTUSDT is forming a clear falling wedge pattern, a classic bullish reversal signal that often indicates an upcoming breakout. The price has been consolidating within a narrowing range, suggesting that selling pressure is weakening while buyers are beginning to regain control. With consistent volume confirming accumulation at lower levels, the setup hints at a potential bullish breakout soon. The projected move could lead to an impressive gain of around 290% to 300% once the price breaks above the wedge resistance.
This falling wedge pattern is typically seen at the end of downtrends or corrective phases, and it represents a potential shift in market sentiment from bearish to bullish. Traders closely watching TUTUSDT are noting the strengthening momentum as it nears a breakout zone. The good trading volume adds confidence to this pattern, showing that market participants are positioning early in anticipation of a reversal.
Investors’ growing interest in TUTUSDT reflects rising confidence in the project’s long-term fundamentals and current technical strength. If the breakout confirms with sustained volume, this could mark the start of a fresh bullish leg. Traders might find this a valuable setup for medium-term gains, especially as the wedge pattern completes and buying momentum accelerates.
✅ Show your support by hitting the like button and
✅ Leaving a comment below! (What is your opinion about this Coin?)
Your feedback and engagement keep me inspired to share more insightful market analysis with you!
TUT Buy/Long Signal (4H)The TUT asset is currently trading at a key level and has formed a bullish CHoCH on the chart. Higher lows can also be observed, confirming bullish structure.
Given that the upper pivots have been consumed, if price is able to break through the identified supply zone, it may continue to move toward higher areas/zones.
If a pullback occurs toward the two entry points marked on the chart, we will enter a buy/long position using DCA.
The targets are marked on the chart.
Do not enter the position without capital management and stop setting
Comment if you have any questions
thank you
TUTUSDT 12H#TUT is testing the descending resistance on the 12H timeframe. Entry is recommended only after a confirmed breakout above this resistance. If a valid breakout occurs, the potential upside targets are:
🎯 $0.01485
🎯 $0.01602
🎯 $0.01718
🎯 $0.01883
🎯 $0.02094
⚠️ Always apply tight stop-losses and maintain strict risk management.
Scalp Long – TUT🚀 Scalp Long – TUT
Buying volume is rising sharply as price holds above a strong support zone. Price action suggests a potential move to retest the local high, while RSI has re-entered the buying region — indicating renewed bullish strength.
🎯 Trade Setup:
Take Profit (TP): 0.02201
Stop Loss (SL): 0.01901
Risk/Reward Ratio (RR): 1 : 3.48
A clean long setup supported by increasing volume, strong support defense, and bullish momentum confirmation from RSI.
Climate Change as a Global Trade Disruptor1. Climate Change and Global Trade: The Interconnection
Trade depends on geography, climate, and natural resources. Historically, favorable weather and fertile lands enabled agricultural exports, while stable oceans and rivers facilitated shipping routes. Climate change disrupts all three:
Geography: Rising sea levels threaten coastal cities and ports, where nearly 90% of international trade passes through.
Climate: Heatwaves, floods, and droughts directly impact agricultural yields and energy production.
Natural Resources: Water scarcity and declining biodiversity affect commodity supply.
In short, climate change doesn’t just affect the environment—it directly alters the conditions of trade.
2. Extreme Weather Events and Supply Chain Disruptions
One of the most immediate trade-related consequences of climate change is the increase in extreme weather events. Hurricanes, cyclones, floods, and wildfires damage factories, ports, and transport infrastructure.
Hurricane Katrina (2005): Shut down Gulf Coast oil refineries, sending global oil prices soaring.
Thailand floods (2011): Disrupted automotive and electronics supply chains worldwide.
Australia’s bushfires (2019–2020): Reduced coal exports and disrupted agriculture.
Today’s supply chains are highly interdependent and globalized. A single event in one country can delay production worldwide. For example, flooding in Vietnam affects garment exports to Europe, while droughts in Brazil push up global coffee prices.
Climate-induced supply chain shocks are becoming the new normal. This creates price volatility, inflationary pressures, and higher insurance premiums for shipping and logistics.
3. Agriculture and Food Security in Global Trade
Agriculture is one of the most climate-sensitive sectors and a cornerstone of global trade. Crops like wheat, rice, coffee, and cocoa rely on predictable weather patterns. Climate change threatens this balance in multiple ways:
Droughts in Africa: Reduce maize and sorghum yields, raising import dependency.
Heat stress in India: Threatens rice and wheat production, impacting global food markets.
Coffee production in Brazil & Vietnam: Faces declining suitable land due to rising temperatures.
Food security becomes a trade issue when nations impose export bans to protect domestic supply. During the 2008 food crisis, countries like India and Vietnam restricted rice exports, causing prices to spike globally. Similar patterns may repeat more frequently as climate shocks worsen.
This also affects agribusiness trade patterns. Countries that can adapt (through irrigation, genetic crop engineering, or technology) may dominate future food exports, while vulnerable regions face dependency and trade deficits.
4. Maritime Trade and the Impact on Shipping
Around 80–90% of global trade moves by sea. Climate change is disrupting this backbone in several ways:
Rising Sea Levels: Ports in Bangladesh, Miami, Rotterdam, and Shanghai face flooding risks.
Hurricanes & Cyclones: More frequent storms damage ships and delay cargo.
Melting Arctic Ice: While it opens new shipping routes (e.g., Northern Sea Route), it also creates geopolitical tensions and environmental hazards.
Shallow Water Levels: Droughts in rivers like the Rhine (Europe) and Mississippi (U.S.) reduce shipping capacity.
Insurance and shipping costs rise as companies face unpredictable risks. In turn, these higher costs filter down to consumers through inflation in global trade prices.
5. Energy Trade and Transition
Energy is the engine of trade, but climate change is reshaping both supply and demand.
Fossil Fuel Disruption:
Rising storms affect offshore oil rigs.
Droughts limit water needed for cooling in coal and nuclear plants.
Heatwaves reduce energy efficiency in transportation.
Green Energy Transition:
Demand shifts toward renewable energy technologies (solar panels, wind turbines, EV batteries).
Countries rich in critical minerals (lithium, cobalt, rare earths) gain new trade power.
Nations dependent on fossil fuel exports (like Gulf countries) face future trade risks.
Energy trade is entering a transitional phase, with climate change accelerating the shift toward renewables while simultaneously destabilizing fossil fuel-dependent economies.
6. Climate-Induced Migration and Labor Disruptions
Climate change displaces millions of people due to floods, droughts, and rising seas. According to the World Bank, by 2050, over 200 million people may become climate migrants.
This has direct trade implications:
Labor shortages in agriculture and manufacturing.
Shifting consumer bases as populations relocate.
Trade tensions between host and origin countries.
For example, migration from Central America to the U.S. is partly driven by droughts destroying crops. This alters not just migration policies but also regional trade agreements.
7. Geopolitical Tensions and Trade Wars Linked to Climate
Climate change also fuels geopolitical trade disruptions. Nations with scarce resources (water, arable land, minerals) may restrict exports or engage in conflicts.
Water wars: Between India and Pakistan, or Egypt and Ethiopia, may affect food and trade flows.
Carbon tariffs: The EU’s Carbon Border Adjustment Mechanism (CBAM) imposes costs on imports from high-emission industries, creating new trade barriers.
Resource nationalism: Countries with critical minerals (like Chile for lithium, Congo for cobalt) may restrict exports for domestic benefit, disrupting global supply chains.
Climate change is not just an environmental issue—it’s a geo-economic disruptor reshaping trade alliances and policies.
8. Financial Risks and Trade Insurance
Trade finance and insurance are also feeling the impact:
Rising premiums for ships navigating storm-prone routes.
Higher borrowing costs for exporters in climate-vulnerable regions.
Credit risk as companies in flood-prone areas default on loans.
International banks and insurers are now pricing climate risk into trade deals. This makes it more expensive for vulnerable developing countries to participate in global trade.
9. Adaptation Strategies: Business and Government Responses
Despite the risks, nations and corporations are adapting strategies to reduce disruptions:
Diversification of Supply Chains: Companies are sourcing from multiple regions to reduce climate risks.
Resilient Infrastructure: Investments in flood-resistant ports, smart logistics, and renewable energy.
Trade Policy Reforms: WTO and regional trade blocs are incorporating climate clauses into agreements.
Technological Innovations: AI, blockchain, and IoT for supply chain visibility and risk prediction.
Sustainable Shipping: Investments in low-carbon fuels and energy-efficient vessels.
Adaptation is no longer optional—it is becoming central to trade competitiveness.
10. Future Outlook: Trade in a Climate-Disrupted World
Looking ahead, climate change will continue to reshape trade in profound ways:
Winners and Losers: Climate-resilient nations (Nordics, Canada) may gain trade advantages, while vulnerable regions (South Asia, Sub-Saharan Africa) face disruptions.
Regionalization: To reduce risk, companies may shorten supply chains and rely more on regional trade than global trade.
Climate-Linked Trade Agreements: Carbon border taxes and environmental standards will redefine competitiveness.
Innovation-Driven Trade: Renewable energy technologies, carbon-capture products, and climate-adaptation tools will dominate exports.
In short, climate change will not stop trade, but it will transform it.
Conclusion
Climate change is one of the greatest disruptors global trade has ever faced. Unlike temporary crises—such as financial crashes or pandemics—it is a long-term, structural challenge. It reshapes production, transportation, labor, and even the rules of trade itself. From floods that halt factory production to tariffs on carbon-heavy imports, climate risks ripple through every link of the global supply chain.
The future of trade depends on how quickly nations, businesses, and institutions adapt. Those who build resilience, embrace sustainability, and innovate will thrive. Those who delay will face escalating costs, shrinking markets, and geopolitical vulnerabilities.
Ultimately, climate change is not just an environmental problem—it is a trade problem, an economic problem, and a global governance problem. Recognizing it as a trade disruptor is the first step toward building a system that can withstand its impact.
TUTUSDT Forming Bullish MomentumTUTUSDT is showing strong bullish momentum on the charts, supported by consistent volume that indicates growing interest from traders and investors. The current structure reflects a bullish momentum pattern, which often leads to significant upward price continuation. With the market aligning toward positive sentiment, the pair is gaining attention as a potential breakout candidate with room for further growth.
If this bullish setup plays out, TUTUSDT could be on track to deliver gains in the range of 60% to 70%+. Such momentum-driven moves are typically fueled by sustained demand and accumulation, suggesting that investors are positioning themselves early ahead of a possible rally. The volume profile also supports this narrative, showing that the market activity behind the price movement is healthy and reliable.
Market watchers are keeping a close eye on this setup as momentum-driven breakouts tend to accelerate quickly once resistance levels are broken. With investors showing confidence and taking interest in this project, the probability of a strong upside continuation looks favorable. Short to mid-term traders may find this a compelling opportunity as the technical indicators continue to align.
In summary, TUTUSDT is building momentum within a bullish structure that could soon propel it toward higher price levels. The combination of healthy volume, strong investor sentiment, and technical confirmation points toward the potential for a powerful upward move.
✅ Show your support by hitting the like button and
✅ Leaving a comment below! (What is You opinion about this Coin)
Your feedback and engagement keep me inspired to share more insightful market analysis with you!
TUTUSDT Forming Bullish MomentumTUTUSDT is showing strong bullish momentum on the charts, supported by consistent volume that indicates growing interest from traders and investors. The current structure reflects a bullish momentum pattern, which often leads to significant upward price continuation. With the market aligning toward positive sentiment, the pair is gaining attention as a potential breakout candidate with room for further growth.
If this bullish setup plays out, TUTUSDT could be on track to deliver gains in the range of 60% to 70%+. Such momentum-driven moves are typically fueled by sustained demand and accumulation, suggesting that investors are positioning themselves early ahead of a possible rally. The volume profile also supports this narrative, showing that the market activity behind the price movement is healthy and reliable.
Market watchers are keeping a close eye on this setup as momentum-driven breakouts tend to accelerate quickly once resistance levels are broken. With investors showing confidence and taking interest in this project, the probability of a strong upside continuation looks favorable. Short to mid-term traders may find this a compelling opportunity as the technical indicators continue to align.
In summary, TUTUSDT is building momentum within a bullish structure that could soon propel it toward higher price levels. The combination of healthy volume, strong investor sentiment, and technical confirmation points toward the potential for a powerful upward move.
✅ Show your support by hitting the like button and
✅ Leaving a comment below! (What is You opinion about this Coin)
Your feedback and engagement keep me inspired to share more insightful market analysis with you!
TUT Coin Tutorial Token Price News Today - Price PredictionTUT has recently surged from the 0.0585 support zone, breaking through mid-range resistance at 0.0650 and testing the upper resistance near 0.0755. Price has shown strong bullish momentum, but the sharp rejection wick at the top suggests sellers are defending the 0.0755 barrier. This aligns with the historical supply zone seen in late July.
As long as price remains capped below 0.0755, there is risk of a downside retracement back into the 0.0650 zone. If buyers reclaim and sustain above 0.0755, however, momentum could extend toward new highs.
📊 Key Levels
Support 1: 0.0650 (mid-level support)
Support 2: 0.0585 (major base support)
Resistance: 0.0755 (major cap zone)
Trading Scenarios
📉 Bearish Setup
Sell trigger: Rejection at 0.0755
Sell zone: 0.0735 – 0.0755
Target: 0.0650 support
Invalidation: Break and close above 0.0765
📈 Bullish Setup
Buy trigger: Break and hold above 0.0755
Buy zone: Retest of 0.0750–0.0760 as support
Target: 0.0820–0.0850 extension
Invalidation: Drop back below 0.0730
Summary
Momentum is bullish short-term, but 0.0755 is a key decision level.
A rejection favors a move back to 0.0650.
A breakout above 0.0755 opens path to higher highs.
👉 Follow me for More Real Time Opportunities.
Share your Thoughts if you have any?
TUTUSDT Forming Bullish ContinuationTUTUSDT is currently showing a strong bullish Continuation pattern, signaling the potential for a major upward continuation in price action. The recent structure highlights consistent higher lows and stronger pushes to the upside, reflecting solid demand from buyers. The market has been supported by good trading volume, which adds strength to the current bullish outlook. This setup is often a precursor to explosive moves, especially when investor sentiment is aligned with technical signals.
If the momentum continues, TUTUSDT could potentially deliver gains in the range of 60% to 70%+. This type of pattern typically attracts breakout traders and mid-term investors who are looking for significant returns. As the price consolidates with bullish bias, any decisive breakout could act as a catalyst for rapid price acceleration.
Investors are already showing interest in this project, which further supports the case for continued upside. With both technical momentum and investor confidence building up, TUTUSDT could be positioned for strong growth in the coming sessions. Traders should keep a close watch on volume spikes and key resistance levels as potential signals for entry and continuation.
✅ Show your support by hitting the like button and
✅ Leaving a comment below! (What is You opinion about this Coin)
Your feedback and engagement keep me inspired to share more insightful market analysis with you!
Altcoins Market Bullish Continuation, Supporting SignalsTUTUSDT (Tutorial) has been leading the altcoins market. This pair tends to move ahead of the rest of the altcoins.
Here I am seeing a breakout from a sideways trading range, something similar to May.
Let's say TUTUSDT starts to move forward and this is day one. Why now? Because the market is ready. It starts to move forward and prints a bullish wave similar to June, we know the rest of the market will follow.
The fact that this chart shows perfect sideways action followed by bullish breakouts means that the people behind it are in the know. They know about the 2025 bull market, they know about the altcoins and they aren't about to sell when everything is set to grow.
So there you have it. This signal supports an altcoins market bullish continuation, what I've been saying in the past few days. It is still early, but the retrace already reached its end.
We are going up.
Namaste.
TUT At Edge ! Breakdown Loading...TUTUSDT | 4H Technical Outlook
The price action on TUTUSDT is currently shaping up into a classic rising wedge formation on the 4-hour timeframe, a pattern that historically carries a bearish bias, especially after an extended upside move like the one we’ve seen recently.
We’ve observed multiple rejections from the upper trendline near the 0.065–0.066 region, suggesting that bullish momentum is starting to fade. Despite the higher highs and higher lows, the upper boundary of the wedge is flattening, a typical sign of buyer exhaustion. Sellers are slowly stepping in, and the imbalance is beginning to tilt.
There’s a possibility of one last fakeout move, a minor sweep of the highs around 0.0655–0.0660 — designed to trap breakout traders. If that move is followed by a strong rejection and a close back inside the wedge, it would increase the probability of a breakdown scenario playing out.
The key level to watch is 0.0590 the lower boundary of the wedge. A decisive breakdown below this level, especially with volume confirmation, would likely trigger a sharper correction.
Downside targets if breakdown confirms
First target: 0.0522 (previous minor demand zone)
Second target: 0.0480 (structural support)
Extended targets: 0.0440 and 0.0400 (swing supports from the previous rally base)
However, if bulls manage to push price above the 0.0660 zone and hold it with strength, this rising wedge setup will be invalidated and may turn into a continuation move to the upside.
Setup is leaning bearish. Rising wedge + signs of exhaustion + trapped longs potential. Waiting for confirmation of the breakdown before entering. No need to front-run. Let the market confirm its direction.
Stay alert, manage risk tightly, and avoid chasing the first fakeout.