FTSE 100 โ 4H | Watching for a bullish moveFTSE 100 is sitting around 10 6xx - 10,70x and, for me, this is an interesting area to watch.
Price has been moving inside the descending structure for some time, but the latest reaction from the 10,540โ10,650 area is worth paying attention to.
This zone lines up with previous support and the lower part of the structure, so Iโm watching to see whether buyers can actually regain control from here.
The first level I want to see reclaimed is 10,729. If price manages to hold above it, I think the next important area is around 10,940โ11,015. A clean break through that zone could open the way toward 11,209, then 11,444, with 11,609 being the larger target shown on the chart.
Iโm not expecting price to move straight up. There could easily be some pullbacks along the way, especially around 10,940 and 11,015.
On the downside, 10,540โ10,600 is the area I don't want to see lost. A decisive 4H break below 10,395 would invalidate this bullish setup for me.
So, for now, I'm looking for confirmation rather than chasing the move:
10,540โ10,650 โ 10,729 โ 10,940/11,015 โ 11,209 โ 11,444 โ 11,609
Let's see how price reacts at each level.
#FTSE100 #UK100 #Trading #TechnicalAnalysis
UK 100 Index
No trades
No trades
In-depth trading ideas
๏ปฟSigns of a potential reversal?UK100 has rejected the pivot, which has been identified as an overlap resistance that aligns with the 38.2% Fibonacci retracement and could potentially drop towards the 1st support, which is also an overlap support.
Pivot: 10,700.87
1st Support: 10,590.35
1st Resistance: 10,788.32
Disclaimer:
The opinions given above constitute general market commentary and do not constitute the opinion or advice of IC Markets or any form of personal or investment advice.
Any opinions, news, research, analyses, prices, other information, or links to third-party sites contained on this website are provided on an "as-is" basis, are intended to be informative only, and are not advice, a recommendation, research, a record of our trading prices, an offer of, or solicitation for, a transaction in any financial instrument and thus should not be treated as such. The information provided does not involve any specific investment objectives, financial situation, or needs of any specific person who may receive it. Please be aware that past performance is not a reliable indicator of future performance and/or results. Past performance or forward-looking scenarios based upon the reasonable beliefs of the third-party provider are not a guarantee of future performance. Actual results may differ materially from those anticipated in forward-looking or past performance statements. IC Markets makes no representation or warranty and assumes no liability as to the accuracy or completeness of the information provided, nor any loss arising from any investment based on a recommendation, forecast, or any information supplied by any third party.
Could a Support Breakdown Trigger a Deeper Correction?FTSE 100 | Could a Support Breakdown Trigger a Deeper Correction? ๐โ ๏ธ
Hello everyone and welcome back to all my TradingView followers! ๐๐
I hope you're all doing well and, as always, trading with discipline and proper risk management.
Today Iโm looking at the FTSE 100 on the Daily timeframe, where price is currently approaching a very important technical decision point amid increasing global macroeconomic and geopolitical risks.
๐ Fundamental View | Global Markets Under Pressure
Global markets have recently shifted back toward a more Risk-Off environment.
Higher oil prices, renewed geopolitical tensions, rising bond yields and growing inflation concerns are creating a challenging backdrop for global equities.
The FTSE 100 also came under pressure today, falling around 0.6% toward 10,634, as higher oil prices increased inflation concerns and pushed bond yields higher.
๐ข๏ธ Strait of Hormuz Risk
One of the biggest risks for global markets right now is the potential escalation of military tensions around the Strait of Hormuz.
According to today's reports, commercial shipping through Hormuz has fallen dramatically, with only four commodity vessels transiting the waterway on Monday versus an estimated pre-war average of around 125 daily transits. Traffic through Bab el-Mandeb has also declined.
If military tensions escalate again and shipping disruptions intensify, the market could face the following chain reaction:
Geopolitical Escalation โ Higher Oil โ Higher Inflation โ Higher Yields โ Lower Risk Appetite ๐
That could create additional pressure on global equities.
The FTSE 100 does have relatively high exposure to energy and commodity companies, which can provide some protection when oil prices rise. However, if higher energy prices translate into persistent inflation and tighter monetary policy, that support could become less effective.
๐ Technical Analysis | FTSE 100 Daily
Technically, the current structure is very interesting. ๐
Price is currently trading around 10,650, right near the key support area.
๐ก First Support:
10,574
This level is currently very important.
Below it, the next major support zone is:
๐ก 10,166 โ 10,002
This area could become the next potential downside target if the current support fails.
๐ป Bearish Scenario
Price has already weakened below the rising trendline that supported the previous bullish structure.
If:
10,574 โ breaks
and the daily candle confirms the breakdown below this level, the probability of a deeper correction increases significantly. ๐
The next potential targets would be:
๐ฏ 10,166
followed by:
๐ฏ 10,002
So the potential bearish path would be:
10,574 โ 10,166 โ 10,002
If geopolitical tensions intensify further and global risk appetite deteriorates, even lower support levels could eventually become relevant.
๐ Bullish Scenario
The bullish scenario is not invalidated yet.
The major resistance on the chart is around:
๐ด 10,887
If buyers defend the current support, reclaim the rising trendline and eventually break above 10,887, the current bearish structure could be invalidated.
In that case:
Breakout โ Retest โ Confirmation
would provide a much stronger setup for bullish continuation. ๐ข๐
For now, I would rather wait for confirmation than try to predict the next major move.
๐ง Final View
In my opinion, the FTSE 100 is currently sitting at a very important decision point.
The market is dealing with:
๐ข๏ธ Higher oil prices
โ๏ธ Renewed Middle East military risks
๐ข Disruption around strategic shipping routes
๐ Higher bond yields
๐ฅ Inflation concerns
๐ Lower global risk appetite
Recent reports also show that escalating regional tensions and disruptions to energy routes are weighing on investor sentiment.
At the same time, the FTSE 100 has not yet confirmed a decisive breakdown below 10,574.
Therefore, this is the key level I am watching:
๐ด Break and daily confirmation below 10,574 โ Higher probability of a correction toward 10,166 and 10,002.
๐ข Support holds โ Potential recovery toward 10,887.
If geopolitical risks intensify and oil prices surge again, the probability of a deeper correction should not be underestimated. โ ๏ธ
For now, I consider the support breakdown more important than trying to predict the direction in advance.
๐ณ๏ธ What is your view?
Where do you think the FTSE 100 is heading next? ๐ค
๐ข Bullish: Support holds and price moves back toward 10,887.
๐ด Bearish: 10,574 breaks and the index moves toward 10,166โ10,002.
๐ก Neutral: More consolidation before the next major move.
What's your view? Share it in the comments! ๐๐ฌ
โ ๏ธ Disclaimer |
This analysis is for educational and informational purposes only and does not constitute financial or investment advice. Financial markets involve significant risk. Always conduct your own research and use proper risk management before making any investment decision.
๐ท๏ธ Tags
#FTSE100 #UK100 #UKStocks #FTSE #LondonStockExchange #UKMarkets #GlobalMarkets #StockMarket #Equities #RiskOff #Geopolitics #MiddleEast #Hormuz #Oil #CrudeOil #Brent #Inflation #InterestRates #BondYields #BoE #FederalReserve #TechnicalAnalysis #FundamentalAnalysis #TradingView #MarketAnalysis #RiskManagement #Bearish #Bullish
Bullish rebound in play?UK100 has bounced off the pivot, which has been identified as an overlap support, and could potentially rise towards the pullback resistance.
Pivot: 10,589.16
1st Support: 10,452.55
1st Resistance: 10,710.25
Disclaimer:
The opinions given above constitute general market commentary and do not constitute the opinion or advice of IC Markets or any form of personal or investment advice.
Any opinions, news, research, analyses, prices, other information, or links to third-party sites contained on this website are provided on an "as-is" basis, are intended to be informative only, and are not advice, a recommendation, research, a record of our trading prices, an offer of, or solicitation for, a transaction in any financial instrument and thus should not be treated as such. The information provided does not involve any specific investment objectives, financial situation, or needs of any specific person who may receive it. Please be aware that past performance is not a reliable indicator of future performance and/or results. Past performance or forward-looking scenarios based upon the reasonable beliefs of the third-party provider are not a guarantee of future performance. Actual results may differ materially from those anticipated in forward-looking or past performance statements. IC Markets makes no representation or warranty and assumes no liability as to the accuracy or completeness of the information provided, nor any loss arising from any investment based on a recommendation, forecast, or any information supplied by any third party.
FTSE100 sideways consolidation support at 10,660Markets are likely to focus on US economic data, central-bank comments and inflation signals from Japan and China.
US: The Dallas Fed manufacturing report will give a fresh reading on the health of the US manufacturing sector. A stronger result could support the dollar and Treasury yields, while a weak figure could increase expectations for lower rates.
Central Banks: Fedโs Barkin is likely to attract attention for comments on inflation and future interest rates. ECB President Lagarde and Pereira could provide clues on the European rate outlook. BoEโs Ramsden may influence expectations for UK rates.
Japan: The BoJ meeting minutes and services PPI will be watched for signs of continued inflation pressure. Stronger price data could support expectations of further BoJ policy tightening and potentially help the yen.
China: Industrial profits will provide an update on the strength of Chinese companies and the wider economy. The result could also affect commodity and risk sentiment.
Earnings: Jefferies results and management comments will provide some insight into financial-market conditions and corporate demand.
Trading View: The main market driver remains the interest-rate outlook. Strong US data or hawkish Fed comments could support the dollar and push yields higher. Weaker data or softer central-bank comments could have the opposite effect and provide support for equities and other risk assets.
Conclusion: Expect markets to remain sensitive to interest-rate expectations, with the dollar, bond yields and equity markets likely to react to the combination of US data and central-bank guidance.
Key Support and Resistance Levels
Resistance Level 1: 10,800
Resistance Level 2: 10,860
Resistance Level 3: 10,950
Support Level 1: 10,660
Support Level 2: 10,575
Support Level 3: 10,515
The information provided does not constitute investment advice nor take into account the individual financial circumstances or objectives of any investor. Any information that may be provided relating to past performance is not a reliable indicator of future results or performance. To the extent permitted by law, in no event shall Trade Nation (or any affiliate or employee) have any liability for any loss arising from the use of the information provided. Any person acting on the information does so entirely at their own risk. Any information which could be construed as โinvestment researchโ has not been prepared in accordance with legal requirements designed to promote the independence of investment research and as such is considered to be a marketing communication.
Financial Spread Bets and CFDs are complex instruments and come with a high risk of losing money rapidly due to leverage. 73.7% of retail investor accounts lose money when trading CFDs with this provider. You should consider whether you understand how CFDs work and whether you can afford to take the high risk of losing your money.
UK100 โ Sell/Short Trade PlanBias: Short on rejection from the descending trendline / resistance zone.
Entry condition
Price rallies into 10,775โ10,835 resistance/supply zone.
Do not short immediately.
Wait for either:
bearish divergence on 15M, or
a clear bearish reversal/candlestick pattern on 15M/5M.
Enter after the lower-timeframe reversal is confirmed.
Stop Loss
10,860 โ above the resistance zone and recent swing high.
Targets
TP1: 10,625 โ first support / Fibonacci area.
TP2: 10,445 โ major downside target / projected D-leg area.
UK100 โ Bearish SetupUK100 is showing a weakening price structure, with recent market behavior pointing toward renewed downside potential. Selling momentum remains visible across the broader formation, while the upside is struggling to establish sustained strength.
The current setup favors a bearish continuation, with the analysis focused on the developing structure rather than short-term fluctuations. If sellers retain control, the index can extend lower as the downside sequence develops.
From a technical perspective, the key elements are the prevailing momentum, structural direction, and price reaction across important levels. These factors currently keep the selling bias active.
Market: UK100
Bias: Bearish ๐
Approach: Sell
Outlook: Further downside potential
The structure remains tilted toward the downside, keeping sellers in focus. ๐ฏ
UK100 Short Setup โ Bearish RSI Divergence at Local ResistanceUK100 is showing a potential short setup on the 1H chart.
Price has pushed into the 10,720โ10,745 resistance area while forming a higher high, but RSI is showing a lower high, creating bearish divergence.
The broader move into this area also follows a strong recovery from the recent low, so Iโm watching for momentum to weaken around resistance.
Trade idea:
Entry area: ~10,724
Stop loss: ~10,745
Target: ~10,676
Confirmation: rejection from resistance + bearish RSI divergence
Invalidation: clean break and hold above the resistance zone
This is a technical setup Iโm monitoring, not a certainty. Iโll be looking for price confirmation rather than relying on divergence alone.
FTSEโs Energy Strength Masks a Weaker PictureThe FTSE 100 has come under pressure over the past couple of weeks, but the headline index only tells part of the story. Strength in heavyweight energy stocks has provided an important cushion while weakness has spread across much of the wider market.
That makes the recent deterioration in the FTSE's short-term structure worth watching. With UK employment and inflation data due ahead of Thursday's Bank of England decision, this week should provide a useful test of whether the wider market can start to rebound.
Short-term structure starts to weaken
The change on the daily chart is subtle but increasingly difficult to ignore. After forming another lower swing high beneath the summer peak, the FTSE slipped below the rising trendline from the March low, the 50-day moving average and an area that had previously provided support.
None of those developments needs to be treated as a reversal signal in isolation. Together, though, they suggest the sequence of higher lows that carried the index through much of the summer has been interrupted.
FTSE 100 Daily Candle Chart
Past performance is not a reliable indicator of future results
The longer-term picture remains firmer. The 200-day moving average continues to rise beneath the market, so for now the weakness is better viewed as deterioration in the shorter-term structure rather than a broader change in trend.
What would repair the picture?
The four-hour chart gives us a clearer framework. Buyers responded once the sell-off reached the lower part of the recent range, but price is now moving back towards an area that previously provided support.
Reclaiming that area and beginning to hold above it would make the recent weakness less significant. Beyond there, the Anchored VWAP from the July high provides another useful reference for judging whether the shorter-term character of the market is improving.
FTSE 100 Four-Hour Candle Chart
Past performance is not a reliable indicator of future results
If the recovery struggles around former support and starts to weaken again, the lower highs visible on the daily chart become harder to dismiss.
A stronger index than market
The one-week heatmap helps explain why the headline FTSE has held up as well as it has. BP and Shell have been among the stronger large-cap performers as oil prices have risen, providing meaningful support to the index because of their size.
Away from energy, the picture is much weaker. Pressure has spread across several areas of the market, including healthcare, industrials and mining, with a number of heavyweight constituents also moving lower.
FTSE 100 One-Week Heatmap
Past performance is not a reliable indicator of future results
There is an awkward twist to that energy strength. The same rise in oil supporting BP and Shell is also adding to the inflation concerns that have pushed expectations for future UK interest-rate rises higher.
A hold from the Bank of England on Thursday remains widely expected, making the voting split and the Bank's assessment of the inflation backdrop particularly important. Employment and inflation data beforehand should add another layer to that debate.
Rather than trying to predict the reaction, there are two things worth watching. If the FTSE can recover the short-term structure it has recently lost while strength begins to spread beyond energy, the recent weakness becomes easier to dismiss. If the index struggles and its resilience continues to depend heavily on a handful of oil majors, the weaker picture beneath the surface deserves more attention.
Disclaimer: This is for information and learning purposes only. The information provided does not constitute investment advice nor take into account the individual financial circumstances or objectives of any investor. Any information that may be provided relating to past performance is not a reliable indicator of future results or performance. Social media channels are not relevant for UK residents.
Spread bets and CFDs are complex instruments and come with a high risk of losing money rapidly due to leverage. 89% of retail investor accounts lose money when trading spread bets and CFDs with this provider. You should consider whether you understand how spread bets and CFDs work and whether you can afford to take the high risk of losing your money.
FTSE 100 Mega Channel Up topped and targets 1M MA50.FTSE 100 (UK100) has made a Double Top almost at the top of its 17-year Channel Up, which started at the bottom of the 2008 U.S. Housing Crisis. The first High of that Double Top was in February and delivered March's strong red candle and as you can see, Double Top formations within this 17-year pattern have initiated strong technical Bearish Leg corrections.
The use of the Sine Waves makes the picture even clearer as they point out almost exactly every major Cycle Top since the 2008 Housing Crisis (5 such Cycle including that). And we are on one of them.
At the same time, the index also hit the top of the 6-year Channel Up that started shortly after the COVID crash bottom. Every correction (Bear Cycle/ Bearish Leg) within this pattern hit the 1M MA50 (blue trend-line) and rebounded. With the exception of the COVID flash crash which even broke below its 1M MA200 (orange trend-line), every other Bear Cycle since June 2012, hit the 1M MA100 (green trend-line) and rebounded.
In addition, all corrections reached the 0.382 (blue) Fibonacci retracement level (with the exception of the October 2022 Low).
As a result, we are expecting FTSE to close the year with a strong technical Bearish Leg, hitting at least its 1M MA50 around 9200 (even by Q1 2027), which would be marginally above the 0.382 (blue) Fib and also make contact with the bottom of the COVID Channel Up as well as the 0.5 Fibonacci retracement level of the post 2008 Channel Up.
---
** Please LIKE ๐, FOLLOW โ
, SHARE ๐ and COMMENT โ if you enjoy this idea! Also share your ideas and charts in the comments section below! This is best way to keep it relevant, support us, keep the content here free and allow the idea to reach as many people as possible. **
---
๐ธ๐ธ๐ธ๐ธ๐ธ๐ธ
๐ ๐ ๐ ๐ ๐ ๐
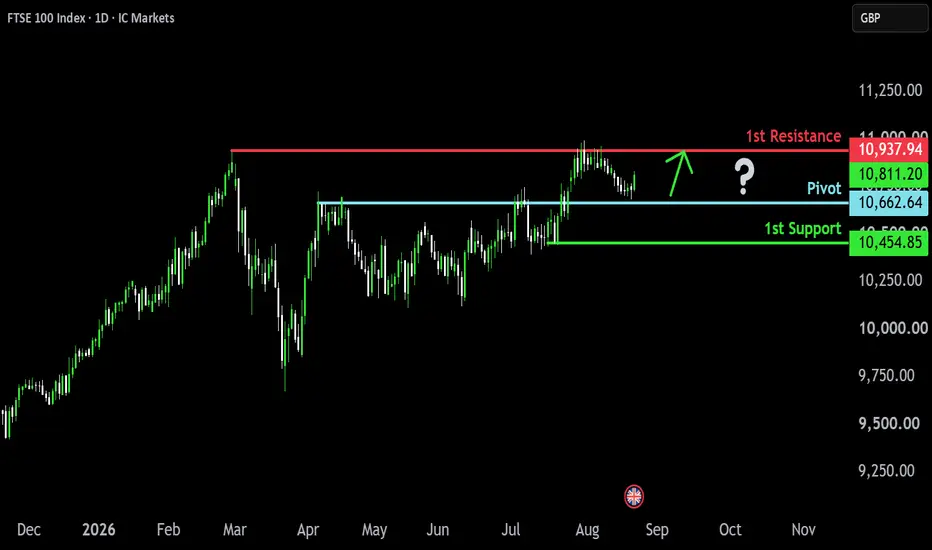
Bullish bounce in play?UK100 has bounced off the pivot, which is a pullback support and could potentially rise toward the pullback resistance.
Pivot: 10,662.94
1st Support: 10,454.85
1st Resistance: 10.937.94
Disclaimer:
The opinions given above constitute general market commentary and do not constitute the opinion or advice of IC Markets or any form of personal or investment advice.
Any opinions, news, research, analyses, prices, other information, or links to third-party sites contained on this website are provided on an "as-is" basis, are intended to be informative only, and are not advice, a recommendation, research, a record of our trading prices, an offer of, or solicitation for, a transaction in any financial instrument and thus should not be treated as such. The information provided does not involve any specific investment objectives, financial situation, or needs of any specific person who may receive it. Please be aware that past performance is not a reliable indicator of future performance and/or results. Past performance or forward-looking scenarios based upon the reasonable beliefs of the third-party provider are not a guarantee of future performance. Actual results may differ materially from those anticipated in forward-looking or past performance statements. IC Markets makes no representation or warranty and assumes no liability as to the accuracy or completeness of the information provided, nor any loss arising from any investment based on a recommendation, forecast, or any information supplied by any third party
US Labor Day|10800 10787 support | 10859 10895 10920 resistanceIt's been a patchy start to the week with tech leading Asian shares higher, while European and Wall Street futures barely budge. Semiconductor โmakers' stocks drove the Nikkei up 2% or so, while South Korea's Kospi climbed around โ3% to 6,900.
We start the week with a mixed but increasingly inflation-sensitive backdrop. Friday's US payroll report was considerably stronger than expected. That pushed Treasury yields higher, increased expectations of a September Fed hike and knocked the S&P 500 down 0.38%, with the Nasdaq losing 0.29%.
But equities aren't collapsing. Asian technology shares are actually rallying this morning because investors are also interpreting the strong jobs report as evidence that the US economy remains healthy. The next major test is now US inflation data later this week, which could decide whether the Fed actually raises rates.
The bigger immediate concern is oil. Brent has climbed to around $97.07 after further US-Iran attacks on vessels in and around the Strait of Hormuz. On the flip side the higher price helps the FTSE100 owing to BP and Shell....
Initially we have a bullish 2h chart with the 10800 looking like it may hold any initial test, with the Hull MA here along with the 30m 200ema. The price is just below the 10823 daily pivot (and in fact the key level from last week) so the bulls will be keen to get the price price back above that if they can.
If the bears were to break 10800 today then 10780 is the green 2h coral, but the daily support level at 10689 does come back into play as well. Might be a big ask to slide that low given oil's strength so 10787 S1 and possibly 10751 S2 are more likely to hold any tests.
I am thinking that we will get an attempt at a bull Monday, at least initially, and then profit taking and a dip later on - with the US closed today for Labor day then the FTSE100 may well be more subdued anyway,
If the bulls do fight back then a rise towards to 10860 R1 level looks likely, and a possible test of the 10922 daily level - if 10895 R2 were to break. These 3 levels are the main ones I am looking at for resistance and shorts. A rise and dip would play out well today and fit the charts well.
UK100 ยท 1HThe asset has reached our area of interest. During the move higher, a key imbalance was formed, which in my view still requires a rebalance.
After a reaction from the current area, I expect a reversal and further bearish delivery toward the lower external expansion.
Partial profit taking: 75% around the 1.0 level, with the remaining position targeting the 1.414 POI.
Scenario: POI โ Reversal โ Rebalance โ External Expansion.
More bearishness with 10830 now resistanceThe key development overnight is the global bond sell-off accelerating. The US 10-year Treasury yield has pushed to around 4.78%, its highest since early 2025, while German and French yields have reached roughly 15-year highs. At the same time, renewed US-Iran tensions have driven Brent above $91, adding another inflationary problem.
The FTSE100 reopens after Mondayโs bank holiday and must absorb two sessions of higher oil, rising global yields and renewed geopolitical risk. That said, we may well see a rise and dip as the new month money flows in this morning, before the bears regain control later for a bear Tuesday. We dropped off Fridays 10830 resistance area well and we now also have the red 2h coral here so I still like this area for a short this morning.
The bulls will be looking to defend the recent low at 10750 and also to try and hold above the pivotal 10825 level but we may not see that till later this week. Initially they have resistance at the daily pivot at 10785 so will need to break this first thing. If they fail then a drop back towards S1 at 10743 and the 10731 daly support level looks good for a long.
If the bulls were to break above the 10830 level then Friday's high 10851 and then the 10866 and 10894 resistance levels come into play - worth keeping an eye on all of these for a reaction and possible shorts.
Whilst the shorter time frames are bearish, the daily still looks positive and now we are moving out of the slow summer trading period we may well see the FTSE100 resume its bullishness. I still think we will see a test of 11000 this year....
FTSE 100 Index Wave Analysis โ 25 August 2026
โ FTSE 100 reversed from support zone
โ Likely to rise to resistance level 10950.00
FTSE 100 Index recently reversed from the support zone between the support level 10750.00 (former resistance from April and July), lower daily Bollinger Band and the 38.2% Fibonacci correction of the upward impulse from July.
The upward reversal from this support zone started the active minor impulse wave v.
Given the clear daily uptrend, FTSE 100 Index can be expected to rise further to the next resistance level 10950.00 โ which has been reversing the price from February.
Buy the dip with 10830 to breakThe charts have improved quite noticeably from last week. Friday produced a strong bullish daily candle, taking the FTSE back above the short-term moving averages, and the overnight market is holding most of that gain around 10,810.
Friday's cash FTSE closed at 10,816.6, +0.6%, helped particularly by commodity-linked stocks and miners.
There is a complication this morning: the broader global tone is fairly risk-off. Asian equities have fallen and oil is lower as markets assess Iran-related sanctions and elevated bond yields.
That leaves me with a bullish intraday bias, but I would buy a pullback rather than chase the opening price.
For me, 10,789 is the line in the sand this morning. Friday's move was strong enough that I don't particularly want to fight it while we're above the pivot.
So my highest-conviction setup is not buying 10,810 at the open. I'd much rather see an opening shakeout towards 10,785โ795, let weaker longs get flushed out, and then buy the recovery if 10,789 holds.
If that happens, 10,830 followed by 10,852 are my preferred upside objectives. If 10,789 breaks and subsequently acts as resistance, I'd abandon the long thesis and switch to looking for 10,760/748.
In short: buy the dip above 10,789; buy the breakout above 10,830; turn bearish on a confirmed loss of 10,789.
UK100 Bullish Map โ 10,950 First, 11,050 Final Targetโโโโโโโโโโโโโโโโโโโโโโโโโโโโโโโโโโโโโโโโโโโโโโโโโโโโโโโโโโโโโโโโโโโโ
๐ฌ๐ง๐ฐ UK100 / FTSE 100 โ INDEX CFD BULLISH HEIST PLAN ๐ฐ๐ฌ๐ง
โโโโโโโโโโโโโโโโโโโโโโโโโโโโโโโโโโโโโโโโโโโโโโโโโโโโโโโโโโโโโโโโโโโโ
๐ฏ Asset : UK100 / FTSE 100 (FTSE: UKX) โ Index CFD
๐
Date : Friday, 21 August 2026
โฐ Time Ref : London Time (BST / UTC+1)
๐ Trade Type : Day Trade & Swing Trade
๐ My Bias : BULLISH
โโโโโโโโโโโโโโโโโโโโโโโโโโโโโโโโโโโโโโโโโโโโโโโโโโโโโโโโโโโโโโโโโโโโ
๐ฆ WELCOME TO THE VAULT โ THIEF OG'S, LET'S RIDE! ๐ฆ
โโโโโโโโโโโโโโโโโโโโโโโโโโโโโโโโโโโโโโโโโโโโโโโโโโโโโโโโโโโโโโโโโโโโ
Ladies & Gentleman โ Thief OG's โ Welcome back to another
calculated heist operation! ๐จ
Today's target is one of Europe's most iconic index vaults โ
the UK100 / FTSE 100 (Footsie), home of 100 of London's
most powerful blue-chip corporations. My analysis points to
a bullish setup with room to push higher before the police
force steps in at our key resistance zones.
The Footsie has been climbing carefully this week, supported
by a risk-on tone driven by mining stocks rallying hard on
the back of surging gold and silver prices. We're locking
on to this momentum with a clean, disciplined heist plan.
๐ My market bias on this asset: BULLISH
๐ Possible scenario: Price pushes higher from current levels
toward our tiered target zones before overbought conditions
and institutional resistance create a reversal risk.
๐ Areas I am watching: The 10,950 resistance level (historical
rejection zone), plus the 11,050 final vault target โ both
carry significant police force activity (strong supply).
Let's get in, grab the bag, and get out clean. ๐ฏ
โโโโโโโโโโโโโโโโโโโโโโโโโโโโโโโโโโโโโโโโโโโโโโโโโโโโโโโโโโโโโโโโโโโโ
๐ก LIVE MARKET SNAPSHOT โ 21 AUGUST 2026 (London Time)
โโโโโโโโโโโโโโโโโโโโโโโโโโโโโโโโโโโโโโโโโโโโโโโโโโโโโโโโโโโโโโโโโโโโ
๐ฌ๐ง UK100 / FTSE 100 โค ~10,772 pts (โฒ +0.20% on the day)
FTSE 100 Thursday Close : 10,748.16 pts
Today's Intraday High : 10,786.55 pts
Today's Intraday Low : 10,740.55 pts
๐ Market Context: Mining stocks and commodity-linked equities are
leading gains today. Gold surging above $4,587/oz is the key
catalyst lifting London-listed miners, with banking stocks also
providing broader support. Weak UK retail sales (-0.5% in July)
cap any aggressive upside conviction.
โโโโโโโโโโโโโโโโโโโโโโโโโโโโโโโโโโโโโโโโโโโโโโโโโโโโโโโโโโโโโโโโโโโโ
๐ฏ THE HEIST PLAN โ ENTRY, TARGETS & STOP LOSS
โโโโโโโโโโโโโโโโโโโโโโโโโโโโโโโโโโโโโโโโโโโโโโโโโโโโโโโโโโโโโโโโโโโโ
๐ ENTRY โ OPEN THE VAULT DOOR:
YOU CAN ENTER THE MARKET AT ANY LEVEL ๐
(Thief OG's, this is a flexible entry strategy โ do not wait
for a perfect single candle. Scale in at your comfort level.
Use your own discretion and risk management as always.)
โโโโโโโโโโโโโโโโโโโโโโโโโโโโโโโโโโโโโโโโโโโโโโโโโโโโโโโโโโโโโโโโโโโโ
๐ฏ DAY TRADER TARGET 1 โ First Cash Register:
@ 10,950 pts
(This is a strong resistance level noted on the FTSE 100
wave analysis โ the Footsie already reversed sharply from
this exact zone on 6 August 2026. Day traders โ bank profits
here. Don't be greedy. Grab the bag and run.)
๐ FINAL / SWING TRADER TARGET โ The Main Vault:
@ 11,050 pts
(This is the BIG vault. The police force โ heavy
institutional supply, overbought signals, reversal traps โ
all converge around this area. Swing traders, this is your
exit zone. Kindly escape with your profits clean and sharp.)
โโโโโโโโโโโโโโโโโโโโโโโโโโโโโโโโโโโโโโโโโโโโโโโโโโโโโโโโโโโโโโโโโโโโ
๐ NOTE โ TARGET DISCLAIMER:
Dear Ladies & Gentleman (Thief OG's), I am not recommended to
set only my TP. Its your own choice โ you can make money then
take money at your own risk.
โโโโโโโโโโโโโโโโโโโโโโโโโโโโโโโโโโโโโโโโโโโโโโโโโโโโโโโโโโโโโโโโโโโโ
๐จ THIEF SL โ THE ESCAPE HATCH:
This is Thief SL @ 10,650 pts
(Placed below key structural support to protect the heist crew
from an unexpected police ambush โ a sharp reversal driven by
macro shock, BoE surprise, or geopolitical escalation.)
โโโโโโโโโโโโโโโโโโโโโโโโโโโโโโโโโโโโโโโโโโโโโโโโโโโโโโโโโโโโโโโโโโโโ
๐ NOTE โ STOP LOSS DISCLAIMER:
Dear Ladies & Gentleman (Thief OG's), I am not recommended to
set only my SL. Its your own choice โ you can make money then
take money at your own risk.
โโโโโโโโโโโโโโโโโโโโโโโโโโโโโโโโโโโโโโโโโโโโโโโโโโโโโโโโโโโโโโโโโโโโ
๐ CORRELATED ASSETS TO WATCH ๐
โโโโโโโโโโโโโโโโโโโโโโโโโโโโโโโโโโโโโโโโโโโโโโโโโโโโโโโโโโโโโโโโโโโโ
Educational breakdown โ these instruments move in relationship
with the UK100. Keep them on your radar for confirmation signals.
โโโโโโโโโโโโโโโโโโโโโโโโโโโโโโโโโโโโโโโโโโโโโโโโโโโโโโโโโโโโโโโโโโโโ
๐ 1. GER40 / DAX 40 (Germany Index CFD)
Price: ~25,983 USD (Thursday Close) / ~26,158 USD (Session)
Correlation: POSITIVE โ
Key Point: The DAX and FTSE 100 are Europe's two heavyweight
indices and tend to move in the same direction. When DAX
rallies on risk-on sentiment, FTSE 100 usually follows. If
DAX starts to weaken or break its support, watch for FTSE
to face similar pressure. Currently, DAX extended losses for
a 4th session due to rising oil and bond yields โ this divergence
from FTSE's small gain today is worth watching. A DAX recovery
would further strengthen the UK100 bullish case.
โโโโโโโโโโโโโโโโโโโโโโโโโโโโโโโโโโโโโโโโโโโโโโโโโโโโโโโโโโโโโโโโโโโโ
๐ 2. GBP/USD (Cable โ British Pound vs US Dollar)
Price: ~1.3641 USD (August 21, 2026 session high: 1.3649)
Correlation: POSITIVE โ
Key Point: A stronger pound is generally supportive of UK
investor confidence and foreign inflows into UK equities.
However, note that many FTSE 100 firms earn revenues in USD
โ so a sharply stronger GBP can sometimes cap index upside
(earnings translated back to GBP become smaller). Currently
GBP/USD is near a 3-month high โ monitor this balance carefully.
If Cable pulls back, multinationals on FTSE 100 could see
a tailwind.
โโโโโโโโโโโโโโโโโโโโโโโโโโโโโโโโโโโโโโโโโโโโโโโโโโโโโโโโโโโโโโโโโโโโ
๐ 3. EUR/GBP (Euro vs British Pound)
Price: ~0.8562 GBP (August 20, 2026)
Correlation: INVERSE / WATCH โ ๏ธ
Key Point: EUR/GBP captures the relative strength battle
between Sterling and the Euro. A falling EUR/GBP (stronger
GBP) reflects UK macro outperformance, which can draw
capital into FTSE 100 names. Conversely, a rising EUR/GBP
(weaker GBP) can indicate UK stress and drag on index
performance. Keep this pair in your peripheral vision โ
it often front-runs BoE policy sentiment shifts.
โโโโโโโโโโโโโโโโโโโโโโโโโโโโโโโโโโโโโโโโโโโโโโโโโโโโโโโโโโโโโโโโโโโโ
๐ 4. XAU/USD (Gold Spot)
Price: ~$4,587.32 USD/oz (August 21, 2026)
Correlation: POSITIVE for FTSE miners โ
Key Point: Gold is on track for its third consecutive weekly
gain, and this is directly boosting London-listed mining
giants on the FTSE 100 โ including Fresnillo, Antofagasta,
Anglo American, and Rio Tinto. These resource stocks carry
significant index weight. As long as gold holds above the
$4,500 zone, expect mining stocks to keep the FTSE 100
supported. A sharp gold reversal would remove a key prop.
โโโโโโโโโโโโโโโโโโโโโโโโโโโโโโโโโโโโโโโโโโโโโโโโโโโโโโโโโโโโโโโโโโโโ
๐ 5. Brent Crude Oil (UKOIL CFD)
Price: ~$93.99 USD/barrel (August 21, 2026)
Correlation: MIXED โ Positive for energy stocks, Negative for
inflation/sentiment โ ๏ธ
Key Point: Elevated Brent crude above $90/bbl provides a lift
to Shell, BP, and UK energy names โ giving the FTSE 100 a
direct boost through its energy-sector heavyweights. But high
oil also fuels CPI inflation (July UK CPI jumped to 2.9%),
raising BoE rate-hike risk, which is a headwind for the broader
index. It's a double-edged sword โ watch how the energy-inflation
balance plays out session by session.
โโโโโโโโโโโโโโโโโโโโโโโโโโโโโโโโโโโโโโโโโโโโโโโโโโโโโโโโโโโโโโโโโโโโ
๐ 6. US30 / Dow Jones Industrial Average
Price: ~52,979 USD (August 21, 2026 session)
Correlation: POSITIVE โ
Key Point: US30 and UK100 share a strong positive global risk
correlation. When Wall Street rallies on risk appetite โ driven
by softer Fed policy expectations or easing geopolitical tension
โ the Footsie tends to catch a similar bid during the European
and early US session overlap. Monitor the NY open carefully;
a strong US30 open typically extends FTSE 100 intraday gains.
โโโโโโโโโโโโโโโโโโโโโโโโโโโโโโโโโโโโโโโโโโโโโโโโโโโโโโโโโโโโโโโโโโโโ
๐ฐ FUNDAMENTALS & ECONOMICS โ WHAT THE MARKET SAYS
โโโโโโโโโโโโโโโโโโโโโโโโโโโโโโโโโโโโโโโโโโโโโโโโโโโโโโโโโโโโโโโโโโโโ
(Educational breakdown โ neutral presentation only.
What the market is actually showing โ no bias for or against
the trade direction.)
โโโโโโโโโโโโโโโโโโโโโโโโโโโโโโโโโโโโโโโโโโโโโโโโโโโโโโโโโโโโโโโโโโโโ
๐๏ธ BANK OF ENGLAND (BoE) โ MONETARY POLICY
Current Bank Rate: 3.75% (Held โ 30 July 2026)
MPC Vote Split: 6 in favour of HOLD, 3 voted for HIKE to 4.0%
Next BoE Decision: Thursday, 17 September 2026
Analysts describe the July decision as a "hawkish hold" โ
dissenters increased from 2 to 3 members, reflecting growing
concern that higher energy prices (driven by the Middle East
conflict) could lead to more persistent inflation. Governor
Andrew Bailey did not signal an imminent hike. A Reuters poll
(conducted 13โ18 August 2026) found approximately 90% of
economists expect rates to stay unchanged at 3.75% through
year-end, though markets have repriced some probability of
a hike given rising energy costs.
๐ข Bullish Factor: Rate hold reduces borrowing cost pressure
on FTSE 100 companies and supports equity valuations.
๐ด Bearish Risk: Growing dissent within the MPC raises the
probability of a future rate hike, which would tighten
financial conditions and weigh on rate-sensitive sectors.
โโโโโโโโโโโโโโโโโโโโโโโโโโโโโโโโโโโโโโโโโโโโโโโโโโโโโโโโโโโโโโโโโโโโ
๐ UK INFLATION DATA โ CPI (Latest Release: 19 August 2026)
CPI July 2026 (YoY): 2.9% (Up from 2.6% in June โ 4-month high)
Core CPI (ex-food & energy): 2.6% (Unchanged from June)
CPIH (incl. housing costs): 3.1% (Up from 2.8% in June)
RPI July 2026: 3.2%
BoE Inflation Target: 2.0%
Key driver: Housing and household services (+4.1%) โ reflecting
the 13% Ofgem energy price cap hike in July. Gas prices surged
14.7% (largest jump since October 2022). Furniture and clothing
prices also rebounded. Transport inflation moderated to 3.6%
from 5.7% in June.
๐ข Bullish View: Core CPI held steady at 2.6% โ suggesting
underlying price pressure has not dramatically escalated,
reducing the urgency for aggressive BoE tightening.
๐ด Bearish Risk: Headline CPI accelerating back toward 3% (and
CPIH already at 3.1%) increases the risk of BoE rate hikes,
which could weigh on FTSE 100 valuations, particularly in
consumer and property sectors.
โโโโโโโโโโโโโโโโโโโโโโโโโโโโโโโโโโโโโโโโโโโโโโโโโโโโโโโโโโโโโโโโโโโโ
๐ UK RETAIL SALES โ JULY 2026 (Released: 21 August 2026)
Monthly change: -0.5% MoM (In line with expectations)
Core Retail Sales (ex-fuel): -0.9% MoM (Missed โ expected -0.5%)
Annual change: +1.6% YoY (Year-on-year still positive)
3-Month change: +1.1% (Three-month trend remains resilient)
The monthly decline is the first since April 2026 โ attributed
to promotions being pulled forward into June, hotter weather
reducing footfall, and higher energy bills squeezing discretionary
spending. JD Sports issued a profit warning this week.
๐ด Bearish Signal: Weak retail data signals consumer spending
pressure from inflation. This dents confidence in UK domestic
demand and could weigh on consumer-focused FTSE 100 names.
๐ข Offset: The 3-month trend (+1.1%) and annual (+1.6%) figures
remain broadly supportive. GfK consumer confidence rose to
a 2-year high of -14 in August from -17 in July.
โโโโโโโโโโโโโโโโโโโโโโโโโโโโโโโโโโโโโโโโโโโโโโโโโโโโโโโโโโโโโโโโโโโโ
๐ผ UK GDP & LABOUR MARKET
Q1 2026 GDP Growth: +0.6% QoQ (Above expectations)
UK Unemployment Rate (Latest): 4.9% (Above forecast of 4.8%)
Payroll Employment Change: -86,000 YoY (Cooling labour market)
Average Earnings Growth (Excl. Bonuses): +3.4% YoY (Resilient)
Public Sector Net Debt: 95.9% of GDP (End June 2026)
๐ข Bullish Case: GDP growth of +0.6% in Q1 beat expectations,
showing the UK economy is holding up better than feared despite
elevated inflation and borrowing costs.
๐ด Bearish Risk: Rising unemployment (4.9%) and falling payrolled
employees signal a softening labour market ahead โ potentially
dampening earnings growth and consumer spending momentum.
โโโโโโโโโโโโโโโโโโโโโโโโโโโโโโโโโโโโโโโโโโโโโโโโโโโโโโโโโโโโโโโโโโโโ
๐ KEY MACRO & GEOPOLITICAL FACTORS
โ Middle East Conflict (US-Iran tension) remains the dominant
macro backdrop โ crude oil elevated above $90/bbl as a direct
result. The US and Iran remain at a diplomatic stalemate.
โ US Treasury announced plans to at least double its long-term
debt buybacks โ this drove US 30-year Treasury yields sharply
lower mid-week, boosting gold and risk assets.
โ Federal Reserve (Fed): July FOMC minutes confirmed some
policymakers argued for rate hikes this year. Markets are
scaling back rate-hike bets after cooler-than-expected US CPI.
โ Dollar Index: Near 3-month lows (~98.58), supporting commodities
(gold, silver) and UK multinational earnings.
โ S&P 500 closed at a new record on 12 August 2026 โ global
risk appetite remains broadly constructive.
โโโโโโโโโโโโโโโโโโโโโโโโโโโโโโโโโโโโโโโโโโโโโโโโโโโโโโโโโโโโโโโโโโโโ
โ ๏ธ RISK FACTORS โ AREAS I AM WATCHING โ ๏ธ
โโโโโโโโโโโโโโโโโโโโโโโโโโโโโโโโโโโโโโโโโโโโโโโโโโโโโโโโโโโโโโโโโโโโ
Risk management is not optional โ it is the entire game.
Here are the key threats to this bullish heist plan:
๐ด BoE Surprise Rate Hike: MPC dissent grew to 3 members at the
July meeting. Any hawkish surprise before 17 September could
send FTSE 100 sharply lower, especially rate-sensitive sectors.
๐ด Oil Price Spike: Brent Crude above $100/bbl would amplify
inflationary pressures, increase BoE hike probability, and
drag on consumer sectors and domestic stocks within FTSE 100.
๐ด Middle East Escalation: A rapid deterioration in the US-Iran
conflict โ particularly disruption to Strait of Hormuz shipping โ
could trigger a global risk-off selloff, pulling all major indices
including UK100 sharply lower.
๐ด GBP Strength Reversal Risk: A significantly stronger pound could
hurt FTSE 100 companies with high USD revenue exposure. The
index has an unusual inverse relationship with GBP at times โ
monitor Cable closely.
๐ด UK Retail Contraction Deepening: If August retail data (due
26 September) shows continued deterioration beyond -0.5%, the
consumer-heavy FTSE 100 names could come under renewed selling.
๐ด Resistance Zone at 10,950: TradingView wave analysts have
flagged 10,950 as a long-term resistance level that already
produced a reversal on 6 August 2026. This is the police
force โ a real technical barrier the bulls must overcome cleanly.
โโโโโโโโโโโโโโโโโโโโโโโโโโโโโโโโโโโโโโโโโโโโโโโโโโโโโโโโโโโโโโโโโโโโ
๐ฌ THIEF TRADER โ STYLE, WISHES & MOTIVATION QUOTES ๐ฌ
โโโโโโโโโโโโโโโโโโโโโโโโโโโโโโโโโโโโโโโโโโโโโโโโโโโโโโโโโโโโโโโโโโโโ
"The best traders don't chase the market โ
they set the trap, wait for price to walk in,
and exit with the bag before anyone notices." ๐ฏ
"Patience is not passive โ it's the most aggressive
trading edge you will ever carry." โ๏ธ
"Every great heist is planned in silence.
Execute with discipline. Celebrate after the vault closes." ๐
"Risk is not your enemy. Undisciplined risk is your enemy.
Know your stop. Know your target. Own your decision." ๐ช
"The market will always give another setup.
The capital you protect today funds the trade that changes
everything tomorrow." ๐
Wishing all my Thief OG's a green, disciplined, and
profitable session! Stay sharp, trade smart, and always
protect the bag above all else. ๐ค
โโโโโโโโโโโโโโโโโโโโโโโโโโโโโโโโโโโโโโโโโโโโโโโโโโโโโโโโโโโโโโโโโโโโ
๐ฅ THIEF OG'S โ LET'S GET THESE LIKES & BOOSTS! ๐ฅ
โโโโโโโโโโโโโโโโโโโโโโโโโโโโโโโโโโโโโโโโโโโโโโโโโโโโโโโโโโโโโโโโโโโโ
If this heist plan added value to your trading session today,
show the crew some love! ๐
๐ FOLLOW THIEF TRADER โ Never miss the next vault operation!
๐ฌ DROP A COMMENT โ Share your thoughts, target hits, or questions!
The more you boost, the more Thief OG's find the vault.
We grow together. We trade together. We win together. ๐ค๐ค
โโโโโโโโโโโโโโโโโโโโโโโโโโโโโโโโโโโโโโโโโโโโโโโโโโโโโโโโโโโโโ
Three Early Signs Resistance Could HoldUnderstanding how to read the battle that takes place around a key resistance zone can make a significant difference to both trade selection and trade management. Sell too early and you risk fading a trend that still has momentum behind it. Wait too long and much of the move may already have unfolded. The challenge isn't identifying where resistance sits; it's recognising when buyers are beginning to lose control.
The FTSE 100's recent test of its all-time highs provides a useful example. Rather than focusing on the eventual move lower, let's look at three subtle changes in price action that suggested resistance was becoming increasingly difficult to overcome before the decline gathered momentum.
1. Failure to close above resistance
The first warning sign often isn't that price fails to trade above resistance. Strong trends frequently push through important levels as buyers test whether the market is willing to accept higher prices.
The more important question is what happens by the close.
When the market repeatedly probes above resistance but finishes the session back beneath it, it suggests that buying enthusiasm is being met by sufficient selling pressure to prevent the breakout from holding. One failed close isn't enough to conclude that resistance will hold, but it should encourage you to pay closer attention to how price behaves during subsequent tests.
FTSE 100 Daily Candle Chart
Past performance is not a reliable indicator of future results
During the FTSE 100's initial test of its all-time highs, buyers briefly traded above resistance but were unable to maintain those gains into the close. Rather than confirming a breakout, the session left behind an early indication that sellers were still prepared to defend the level.
2. Repeated rejection from resistance
Markets rarely give up after a single attempt. When a trend remains healthy, buyers will often return to challenge the same resistance zone multiple times.
What matters is whether each attempt is making genuine progress.
In the FTSE's case, buyers continued revisiting the highs, but each rally quickly stalled around the same area. Instead of seeing strong closes above resistance and an expansion in momentum, price began clustering beneath the highs in a series of relatively small daily candles.
That type of behaviour often reflects hesitation rather than conviction. Buyers are still present, but they are no longer demonstrating the same ability to establish acceptance above resistance.
FTSE 100 Daily Candle Chart
Past performance is not a reliable indicator of future results
By this stage, the evidence had started to build. One failed breakout can be dismissed as noise. Several failed attempts at the same level begin to suggest that resistance is becoming increasingly difficult to overcome.
3. The first break of structure on a lower timeframe
The daily chart tells us that buyers are struggling. The hourly chart helps us identify when that loss of momentum begins to translate into a genuine change in market structure.
One of the earliest signs is the first break of the sequence of higher highs and higher lows that has been supporting the advance. Once price produces its first lower low, buyers are no longer maintaining control of the short-term trend and the probability of resistance continuing to hold begins to increase.
This doesn't confirm that a larger reversal will follow, but it does provide additional evidence that the balance between buyers and sellers is changing.
FTSE 100 Hourly Candle Chart
Past performance is not a reliable indicator of future results
The hourly chart shows the first meaningful break of structure developing after several unsuccessful tests of resistance. While the daily chart was already highlighting weakening buying pressure, the lower timeframe provided a more timely indication that momentum was beginning to shift.
FTSE 100 Hourly Candle Chart
Past performance is not a reliable indicator of future results
The move that followed illustrates why many traders prefer to let the evidence build rather than reacting to the very first rejection. By combining the higher timeframe picture with a lower timeframe change in structure, traders were able to make decisions based on evolving market behaviour rather than trying to predict the exact turning point.
Build the evidence
Resistance rarely announces itself with a single candle. More often, the clues develop gradually as buyers lose momentum and sellers become increasingly willing to defend the same area.
A failure to close above resistance, repeated rejection from the highs and the first lower timeframe break of structure don't guarantee that a reversal will follow. Together, however, they represent a meaningful shift in market behaviour that can help traders assess whether the balance of probability is beginning to favour the sellers.
Disclaimer: This is for information and learning purposes only. The information provided does not constitute investment advice nor take into account the individual financial circumstances or objectives of any investor. Any information that may be provided relating to past performance is not a reliable indicator of future results or performance. Social media channels are not relevant for UK residents.
Spread bets and CFDs are complex instruments and come with a high risk of losing money rapidly due to leverage. 89% of retail investor accounts lose money when trading spread bets and CFDs with this provider. You should consider whether you understand how spread bets and CFDs work and whether you can afford to take the high risk of losing your money.