TWTUSDT 1DKeep a close eye on the #TWT daily chart. The price is on the verge of breaking above the long-term descending resistance trendline and the 50-day SMA. A confirmed breakout above these key resistance levels could trigger a strong bullish move toward the following upside targets:
🎯 $0.3847
🎯 $0.4639
🎯 $0.5443
🎯 $0.6094
🎯 $0.6744
🎯 $0.7670
🎯 $0.8849
⚠️ Always use a tight stop-loss and apply proper risk management.
In-depth trading ideas
TWTUSDT - Descending Trendline, Breakout or Continued Downtrend?🪙 Coin: CRYPTOCAP:TWT #TWT
⏳ Time Frame: 2D
📊 Pattern: Descending Trendline
---
📌 Chart Overview
🔹 TWT is still trading beneath a major descending trendline that has acted as resistance since the previous market peak. This indicates that sellers remain in control of the medium- to long-term market structure.
🔹 The price is currently hovering around a key support zone near $0.32–$0.34, while the primary resistance remains the descending trendline overhead.
🔹 As price approaches both the support level and the end of the trendline, the probability of a strong expansion move increases, either through a breakout or a breakdown.
---
📉 Pattern: Descending Trendline
🔸 A Descending Trendline forms when the market consistently prints Lower Highs, reflecting persistent selling pressure and a dominant bearish trend.
🔸 This pattern is generally considered bearish, but a confirmed breakout accompanied by strong volume can signal the beginning of a trend reversal or a significant relief rally.
🔸 TWT is currently testing the final portion of this trendline, making this a critical area that could determine the next major market direction.
---
🟢 Bullish Scenario (Breakout)
✅ The bullish case becomes stronger if the price can:
🚀 Break and close above the Descending Trendline.
📈 Be supported by a significant increase in trading volume.
🔄 Successfully retest the breakout level, turning previous resistance into new support.
🎯 Key upside resistance targets shown on the chart:
🎯 $0.4200
🎯 $0.4650
🎯 $0.5290
🎯 $0.5690
🎯 $0.6700
🎯 $0.7235
💡 If buying momentum continues to strengthen, TWT could initiate a relief rally toward higher resistance levels after spending several months in a prolonged downtrend.
---
🔴 Bearish Scenario (Rejection)
❌ The bearish outlook remains dominant if:
📉 Price is rejected once again by the Descending Trendline.
⚠️ The key support around $0.32 fails to hold.
📊 Selling volume increases during a breakdown.
🎯 A confirmed loss of support could lead TWT to establish a new Lower Low, confirming that the broader downtrend remains intact and opening the door for further downside.
---
📍 Conclusion
📌 TWT is currently trading in a critical decision zone.
🟢 A confirmed breakout above the Descending Trendline would be the first indication of a potential bullish momentum shift.
🔴 However, another rejection from the trendline combined with a breakdown below support would reinforce the existing bearish trend.
⚠️ Watch for confirmation through candle closes and trading volume, as breakouts without volume often result in false breakouts.
---
#TWT #TrustWalletToken #TWTUSDT #Crypto #Cryptocurrency #TechnicalAnalysis #TradingView #Altcoin #Binance #PriceAction #DescendingTrendline #TrendlineBreakout #Support #Resistance #Bullish #Bearish #CryptoTrading #ChartAnalysis #SwingTrading
#TWT/USDT — Descending Triangle at Demand Zone!
#TWT
The price is moving within a descending channel on the 1-hour timeframe and has reached the lower boundary. It is now poised for a bounce and is expected to retest this boundary.
The Relative Strength Index (RSI) indicates a downward trend, which is likely to continue given the overbought conditions.
There is a key support zone in green at 0. The price has bounced off this zone several times, making it a strong support level.
The price is trending towards the 100-period moving average, which we are approaching. This trend supports an upward move.
Entry Price: 0.3480
Target 1: 0.3546
Target 2: 0.3609
Target 3: 0.3691
Stop Loss: At the resistance zone in green
Remember this simple rule: Money management.
Any questions? Please leave a comment.
Thank you.
TWT WILL RISE AMONG THE FALLEN !Isaiah 43:2 — "When thou passest through the waters, I will be with thee; and through the rivers, they shall not overflow thee: when thou walkest through the fire, thou shalt not be burned."
While the markets burn and the rivers overflow —
TWT shall walk through unscathed.
0.60. Alone. Upright. Among the fallen.
TWTUSDT Forming Bullish MomentumTWTUSDT is forming a clear bullish momentum pattern, a classic bullish wave signal that often indicates an upcoming breakout. The price has been consolidating within a narrowing range, suggesting that selling pressure is weakening while buyers are beginning to regain control. With consistent volume confirming accumulation at lower levels, the setup hints at a potential bullish breakout soon. The projected move could lead to an impressive gain of around 70% to 80% once the price breaks above the wedge resistance.
This bullish momentum pattern is typically seen at the end of downtrends or corrective phases, and it represents a potential shift in market sentiment from bearish to bullish. Traders closely watching TWTUSDT are noting the strengthening momentum as it nears a breakout zone. The strong trading volume adds confidence to this pattern, showing that market participants may already be positioning early in anticipation of a reversal.
Investors’ growing interest in TWTUSDT reflects rising confidence in the project’s long-term fundamentals and current technical strength. If the breakout confirms with sustained volume, this could mark the start of a fresh bullish leg. Traders might find this a valuable setup for medium-term gains, especially as the momentum pattern completes and buying pressure accelerates.
✅ Show your support by hitting the like button and
✅ Leaving a comment below! (What is your opinion about this coin?)
Your feedback and engagement keep me inspired to share more insightful market analysis with you!
TWTUSDT — Massive Breakout Incoming or Just Another Retest?On this TWT/USDT 2D timeframe chart, price is clearly moving within a long-term downtrend structure that has been active since the previous major top. This is confirmed by the strong descending yellow trendline continuously acting as dynamic resistance.
Currently, price is showing early signs of recovery after successfully bouncing from the major support zone around 0.31 – 0.34 USDT and is now approaching a very critical resistance area along with the main descending trendline.
This zone is extremely important because it may determine whether TWT is preparing for a true trend reversal or simply another temporary bounce before continuing its bearish trend.
---
📌 Market Structure & Pattern
🔻 Descending Resistance / Downtrend Structure
The yellow trendline represents the medium-term bearish structure that remains valid for now.
As long as price stays below this trendline, the market is technically still under bearish pressure.
However, several positive signals are starting to appear:
📈 Formation of higher lows
💪 Recovery momentum is increasing
🟢 Bullish candles are becoming more dominant near the bottom area
These signals indicate a possible early-stage reversal attempt.
---
🔥 Key Levels to Watch
🟢 Major Support Zones
0.4800 – 0.5150 → Nearest demand zone and short-term support area.
0.4200 – 0.3400 → Major historical support and previous bottom zone.
---
🔴 Important Resistance Zones
0.5285 → Initial resistance and minor breakout confirmation zone.
0.5685 → Strong bullish confirmation resistance.
0.6691 – 0.7235 → Next bullish targets if breakout succeeds.
0.8250 – 0.9570 → Major supply zone and medium-term swing target.
---
🚀 Bullish Scenario
✅ Bullish Confirmation
If price manages to:
Break above the descending yellow trendline 📈
Close strongly above 0.5285
Hold the breakout as new support
Then the bullish continuation toward:
🎯 0.5685
🎯 0.6691
🎯 0.7235
🚀 Even 0.8250 – 0.9570
becomes increasingly likely.
This would indicate:
📊 The downtrend is weakening
🐂 Buyers are regaining market control
🔥 A potential trend reversal is developing
A breakout supported by strong volume would significantly strengthen the bullish outlook.
---
⚠️ Bearish Scenario
❌ Bearish Rejection
If price fails to break the trendline and gets rejected from the current resistance area:
Then the market could potentially:
📉 Drop back toward 0.4800
🔻 Retest 0.4200 – 0.3400
especially if the overall crypto market weakens.
In that scenario, TWT may continue forming a bearish lower high structure, keeping the long-term downtrend intact.
---
🧠 Conclusion
TWT is currently sitting at a major decision point. The overall downtrend structure is still valid, but recovery momentum is becoming increasingly noticeable. ⚡
📌 A confirmed breakout above the descending trendline would become the main signal for a potential trend reversal.
As long as price remains below key resistance levels, traders should stay cautious of fake breakouts or sharp rejections. ⚠️
However, if bulls successfully confirm the breakout, TWT could enter a medium-term reversal phase with very attractive upside potential. 🚀🔥
#TWT #TWTUSDT #TrustWallet #Crypto #Cryptocurrency #Bitcoin #Altcoin #TradingView #CryptoTrading #TechnicalAnalysis #Bullish #Bearish #Breakout #Trendline #SupportResistance #Trader #Binance #Altseason #ChartAnalysis #CryptoMarket 🚀📈
TWT/USDT 15m: AI Utility Drivers, Macro ShiftsHello traders. Today we are looking at the 15-minute chart for Trust Wallet Token (TWT/USDT). To secure high-probability trades, we must combine the overarching macroeconomic data of May 2026, the latest fundamental catalysts specific to the Trust Wallet ecosystem, and strict, rule-based execution at our key order block zones.
1. The Macro & Fundamental Drivers (May 2026)
The current market environment requires extreme intraday agility.
• The Macro Context:
Broader crypto liquidity is currently navigating a complex phase. While economic growth remains steady, U.S. inflation has proven stickier than anticipated, leading central banks to maintain higher rates for longer than the market initially priced in. In this environment, capital flows strictly toward utility and yield, heavily punishing assets without strong narratives.
• TWT Fundamentals (AI Utility Catalyst):
TWT is currently benefiting from a major shift in utility. The launch of the Trust Wallet Agent Kit (TWAK) has introduced AI-powered agents capable of executing automated on-chain strategies directly from the wallet. Combined with rising staking APYs, TWT is transitioning from a basic governance token into a high-utility asset. This is the core driver behind its current intraday strength.
2. Technical Breakdown: Liquidity Sweeps and Resistance Boxes
The 15m chart shows highly structured algorithmic behavior.
• Liquidity Sweep (Green Demand Zone ~ $0.4820):
The sharp dip into this zone represents a classic liquidity sweep. Price was driven lower to trigger stop-losses, fill institutional buy orders, and immediately reverse upward. This is a textbook “liquidity grab and expansion” structure.
• First Resistance (~$0.4920 - $0.4950):
Immediate intraday supply zone. The first ceiling where sellers may step in.
• Last Resistance (~$0.4950 - $0.4987):
Final structural barrier. A clean break here is required to unlock continuation toward $0.50+ liquidity.
3. The Execution Plan: Strict Grey Box Rules
We trade reactions, not predictions.
• Trading Resistance (Seller Absorption):
As price enters resistance zones, we monitor for absorption. If aggressive buying fails to push price higher and we see "sellers with result" (rejection wicks or footprint resistance), we prepare for downside reaction or consolidation.
• Break & Retest (Primary Bullish Setup):
If price breaks above resistance with strong momentum, we do NOT chase the breakout.
We wait for the retest:
Price breaks resistance
Price pulls back into the broken grey box
We observe buyer absorption (long lower wicks, strong defense)
“Buyers with result” confirm support → we execute long toward next liquidity target
• No Confirmation, No Trade:
If price enters zones and moves through without wicks, absorption, or structural reaction, there is no setup. We stay flat.
Summary
TWT is being driven by strong AI utility expansion and improved staking economics, but intraday price action remains purely structural and liquidity-driven. We respect the sweep at lows, but we only engage when the market confirms a clean break and retest with absorption at the grey resistance zones.
Disclaimer
This analysis is for educational purposes only and reflects a rule-based trading framework. Always use proper risk management and independent judgment.
TWT/USDT — Capitulation to 2021 Lows: Weak Hands or Opportunity?Price has broken all supports and dropped almost without bounces to 2021 lows.
Weekly RSI has printed a new ATL.
For TWT, sharp dumps on FUD and explosive upside without clear catalysts are both typical.
📌 Fundamentals:
— CEO change at Trust Wallet
— investor disappointment in the token
— roadmap delays
— team focus shifted to other projects
— MetaMask token delays weakening the wallet narrative
📊 Chart:
Price has reached a key demand zone where significant volume was previously accumulated and where the last major rally started.
However, last time it took around 10 weeks to form a reversal.
The fractal (in blue) suggests a potential recovery closer to mid-summer.
In a broader bear market, no project is incentivized to defend price levels aggressively.
Still, for TWT, preventing such a deep drawdown would likely have required relatively limited effort.
I’ll be watching the reaction during the next market bounce:
if the move is weak — allocation to TWT will be reduced.
TWT - long It is very possible that BTC will fall below 60K if this does happen expect that all ALT's will go down and TWT as well. In this case the 0.30-0.35 will be tested which is the last big vol. support. That would be the biggest buy opportunity in my honor opinion. Im trying to prepare at least 20K USD here when there will be a panic. After that we will enter the new trend and it will be uptrend. Im expecting that TWT will be at least for 5$-8$ in upcomming years. Crypto is not the same as it was before. Its not about "alt season will not come" its just a matter when and how big it will be...
TWT/USDT — Breakdown Below Support: Range Trading OnlyThe chart shows that the market maker change didn’t help.
Which is not surprising given an unfocused project team that has failed to deliver on its promises.
Price dropped from $1.70 to $0.50 and has now consolidated below the key support block.
Until price at least reclaims that block — ideally holds above it — there’s no reason to expect meaningful performance, let alone a move toward ATHs.
As long as price stays below support, the only viable approach is range trading:
— scale in using a grid,
— sell into bounces.
The only remaining hope is a MetaMask token launch catalyst, which could push TWT’s market maker (CZ) to finally deliver the expected move.
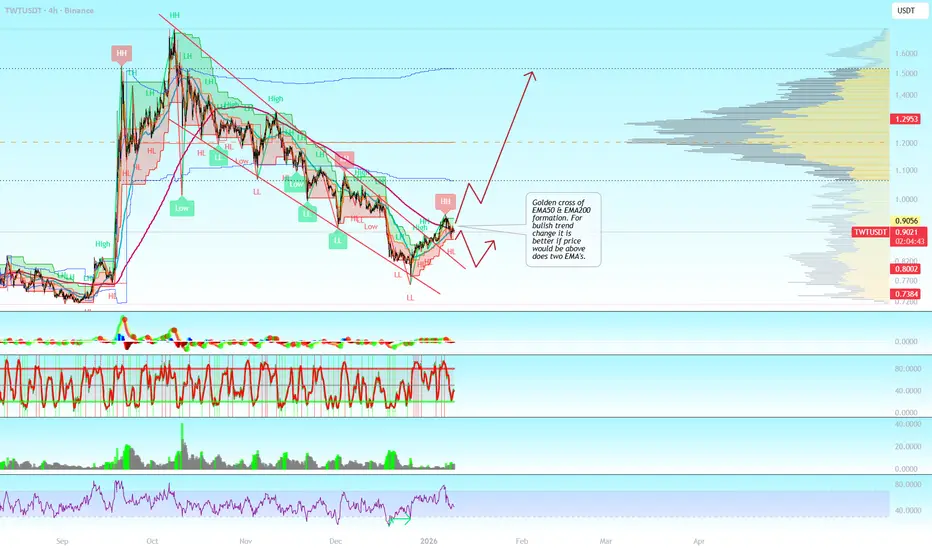
TWT - smart money buysTWTUSDT – 4H Technical Outlook
Price is attempting a trend reversal after a prolonged downtrend. We can observe a break of the descending structure, followed by a higher low and a first higher high, which suggests a potential change in market structure.
EMA50 is crossing above EMA200 on the 4H timeframe, forming an early Golden Cross. However, this signal should be treated as a trend transition rather than a confirmed bullish trend, especially since EMA200 is still relatively flat.
For stronger bullish confirmation, price should hold above both EMA50 and EMA200 and ideally reclaim them as dynamic support. A consolidation or pullback toward the EMAs would be healthy and could form a higher low before continuation.
RSI is recovering from oversold conditions and shows improving momentum, but there is still room for expansion.
As long as price holds above the recent higher low, the bullish scenario remains valid. A breakdown below this level would invalidate the setup and suggest continuation of the broader range or downtrend.
This is a conditional bullish setup, not a guaranteed trend reversal.
#TWT/USDT Ready to go higher#TWT
The price is moving in a descending channel on the 1-hour timeframe. It has reached the lower boundary and is heading towards breaking above it, with a retest of the upper boundary expected.
We have a downtrend on the RSI indicator, which has reached near the lower boundary, and an upward rebound is expected.
There is a key support zone in green at 0.8680. The price has bounced from this level multiple times and is expected to bounce again.
We have a trend towards consolidation above the 100-period moving average, as we are moving close to it, which supports the upward movement.
Entry price: 0.8807
First target: 0.8893
Second target: 0.8992
Third target: 0.9092
Stop loss: Below the support zone in green.
Don't forget a simple thing: capital management.
For inquiries, please leave a comment.
Thank you.
TWT Analysis (4H)The price has made deep drops, and it appears that market makers have collected sufficient liquidity to change the trend.
After the drops, the price ranged at the bottom for a period, which seems to have been sufficient as an accumulation phase for an upward move on the hourly timeframe. Market makers also appear to have filled their orders.
The mid-term bearish trendline has been broken. The bearish C wave appears to be a diametric and has already ended. A proper pullback to the broken trendline has not yet occurred. A pullback is expected soon, after which the price is expected to enter the C wave.
We have marked two entry points on the chart where positions should be entered using a DCA approach. Targets have been specified on the chart.
A daily candle close below the invalidation level will invalidate this analysis.
Trading is not hard or complicated if you have a professional coach.
If you have a coin or altcoin you want analyzed, first hit the like button and then comment its name so I can review it for you.
This is not a trade setup, as it has no precise stop-loss, stop, or target. I do not publish my trade setups here.
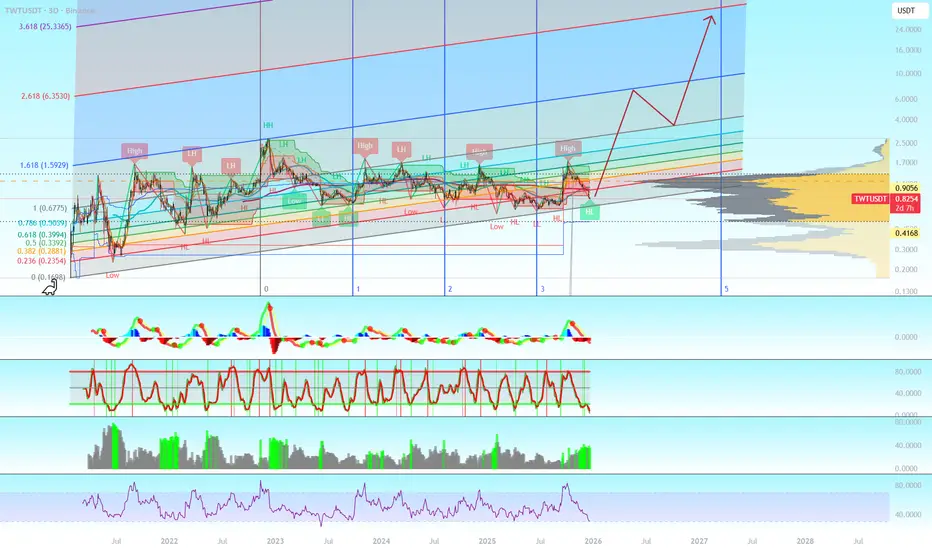
TWT - LONG !📊 TWTUSDT – Technical & Cyclical Analysis (3D, Binance)
The TWTUSDT 3D chart shows a long-term bullish structure that started after the capitulation low in 2022. This level marks the origin of the current market cycle and serves as the anchor for both Fibonacci Time Zones and the Fibonacci Channel, which price has respected throughout the entire structure so far.
🔹 Trend Structure & Fibonacci Channel
For more than three years, price has been moving inside an ascending Fibonacci Channel, repeatedly reacting to key levels such as 0.382, 0.5, 0.618, and the channel median. Despite prolonged consolidation phases and multiple local LH/HL formations, there has been no structural breakdown of the channel, indicating that the market remains in a long-term accumulation phase rather than a distribution phase.
Currently, price is trading in the lower half of the channel, overlapping with a high-volume area (POC), which further supports the idea of accumulation rather than trend failure.
🔻 Bearish Scenario – Long Liquidity Sweep, Not the End of the Project
A potential move below $0.70:
does not invalidate the long-term cycle
does not mean the project has failed
does not break the time-cycle structure
Instead, such a move would likely represent an aggressive long liquidation / liquidity sweep, clearing over-leveraged positions.
In this scenario, a deep wick toward $0.60, and even $0.50 in an extreme case, remains technically possible.
As long as this move is fast and followed by a reclaim, it should be interpreted as:
final market cleansing within accumulation,
not the beginning of a long-term bearish trend.
Only sustained acceptance below the lower Fibonacci Channel would materially change this outlook.
⏱️ Time Cycle Context – Fibonacci Time Zones
From a cyclical perspective:
0 (2022) – capitulation & cycle reset
1–2 – initial expansion and distribution
3 – prolonged range / time accumulation
Current phase: between 3 and 5
This is the phase where:
price stagnates,
sentiment weakens,
conviction fades,
and patience is tested.
Historically, this zone often precedes large directional moves driven by time rather than price.
🔺 Bullish Scenario – Exit From a 3-Year Accumulation Range
TWT has strong fundamental utility within the Trust Wallet ecosystem, which increases the probability that this extended accumulation phase is meaningful.
If price:
reclaims the channel median,
breaks above the consolidation highs,
and volume confirms the move,
the market may transition into a new impulsive phase.
🎯 Bullish Targets (as marked on the chart):
~$1.00 – psychological level & local equilibrium
~$1.60 – 1.618 Fibonacci Channel extension
~$2.50–3.00 – upper trend channel expansion
~$6.30 – 2.618 Fibonacci Channel extension (full-cycle / altseason scenario)
Higher targets should be treated as cyclical potential, not short-term expectations.
🧠 Summary
A drop below $0.70 does not invalidate the structure
A wick toward $0.50 could represent final liquidity cleansing
The market remains in advanced time-based accumulation
A breakout from a 3-year range may result in outsized moves relative to recent price action
Price answers “how much.”
Time answers “when.”
The biggest moves begin when belief is at its lowest.
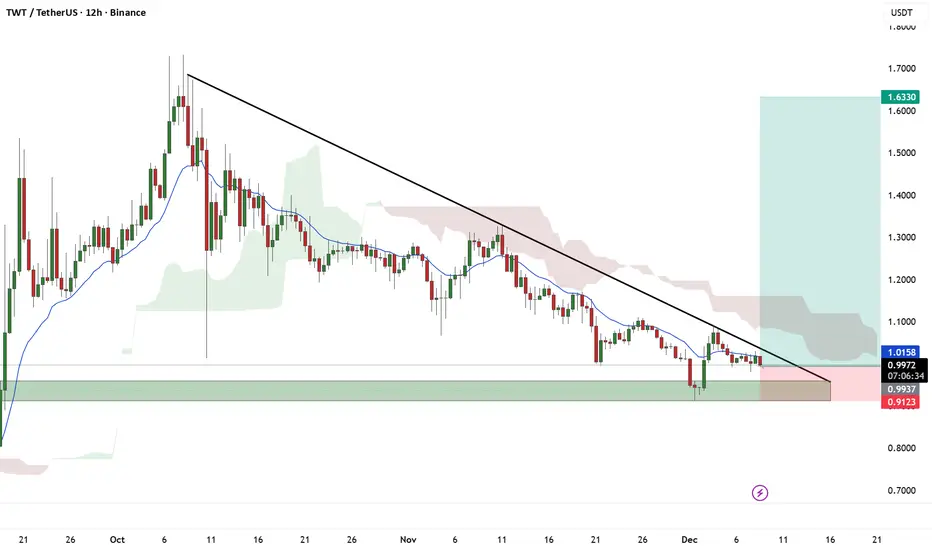
$TWT/USDT ANALYSISTWT/USDT on the 12-hour chart is still moving in a clear downtrend because price is trading below the descending trendline and also below the EMA, showing sellers are still controlling the market. Price is sitting inside a strong support demand zone around 0.95–1.00, and this zone has reacted before which means buyers are trying to defend it, but until the price breaks and closes above the trendline and 1.02–1.03 area with strength, upside continuation is not confirmed. If price keeps failing at the trendline it can stay weak and continue sideways or even push down toward the lower support area around 0.91, but if buyers manage to break out cleanly above resistance, then recovery toward higher levels becomes possible. Right now the structure is bearish but sitting on support where reaction can happen, so the next move depends on whether price breaks up from the trendline or gets rejected again.
TWT - the strongest project in crypto space!Hi guys, please read below:
Possible Regulatory Role of TWT in Binance’s Future Strategy
One of the most overlooked fundamental drivers behind Trust Wallet Token (TWT) is its potential strategic role in Binance’s regulatory adaptation. As global regulations continue to restrict what centralized exchanges (CEX) are allowed to offer, Binance is gradually shifting certain functionalities toward decentralized, non-custodial platforms. This is exactly where Trust Wallet and TWT may become significantly more important.
Binance, as a centralized entity, cannot freely operate or expand in areas such as:
permissionless DeFi access,
prediction markets and on-chain betting,
cross-chain swaps without KYC,
non-custodial staking,
decentralized identity and gas-abstraction mechanisms.
All of these features are difficult or impossible to deploy within a regulated CEX framework.
However, they can be deployed inside a decentralized wallet ecosystem, where regulatory burdens are considerably lighter.
This opens the door for Binance to leverage Trust Wallet as its “Web3 arm”, a parallel ecosystem that operates outside the legal constraints of the exchange itself. In such a scenario:
🔹 Trust Wallet becomes the decentralized gateway for all features Binance cannot offer directly.
🔹 TWT becomes the natural governance and utility token of that ecosystem.
🔹 Any growth in Trust Wallet’s importance directly increases the value proposition of TWT.
The more Binance relies on Trust Wallet to implement features blocked by regulation, the more TWT gains:
increased utility,
higher demand,
reduced circulating supply (if staking or governance locks appear),
stronger user adoption,
expansion into prediction markets and cross-chain DeFi,
and ultimately a re-rating of the token’s market value.
In other words:
Regulatory pressure on Binance could become an unexpected long-term catalyst for TWT.
If Trust Wallet evolves into Binance’s primary decentralized infrastructure, TWT is positioned to benefit massively.
This narrative gives TWT a fundamentally bullish outlook that can amplify any technical breakout, especially if the market begins to price in the possibility of TWT becoming Binance’s official Web3 governance asset.
Regards,
TWTUSDT 12H#TWT is moving inside a falling wedge pattern on the 12H timeframe. Both RSI and MACD indicate the possibility of bullish momentum building up. Keep an eye on it. If price breaks above the wedge resistance and the 12H SMA50, the potential upside targets are:
🎯 $1.2319
🎯 $1.3753
🎯 $1.4913
🎯 $1.6072
🎯 $1.7723
⚠️ Always remember to protect your capital with a proper stop-loss and disciplined risk management.
TWT/USDT Analysis 🚀 TWT/USDT Analysis 🚀
📊 Weekly Timeframe | Heikin Ashi Candles
A potential breakout is forming on TWT/USDT! 🔥 The price is breaking out of a descending channel, showing bullish momentum. If this movement sustains, the next target to watch is $1.7099.
💡 Key Highlights:
Pattern: Descending channel breakout.
Resistance: $1.7099 (potential target).
Support: Current channel structure indicates a retest around $1.22.
📈 A bullish confirmation will be stronger if the price retests the breakout zone and maintains momentum above $1.27. Traders should also watch for volume spikes and key candlestick formations for further confirmation! 🧐
Let’s keep an eye on this one. Risk management is key! 📉💼
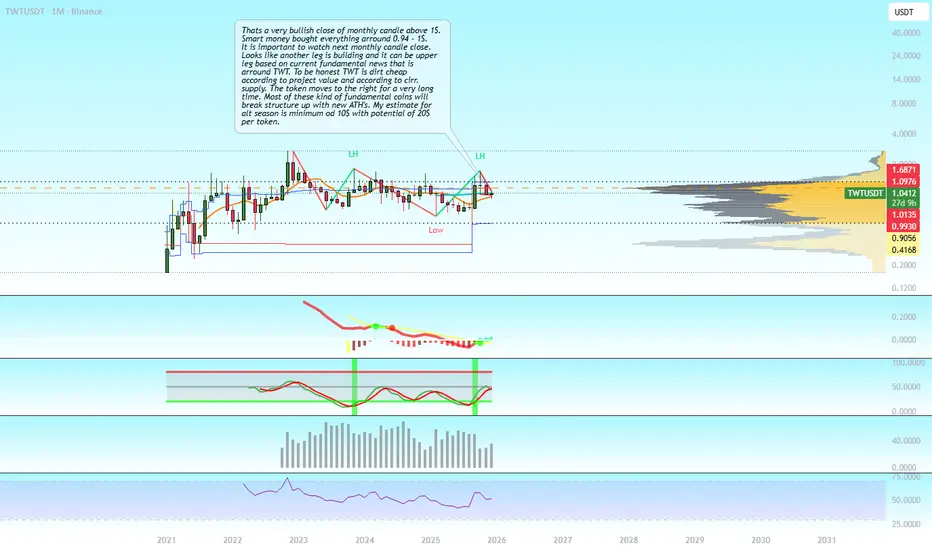
TWTthe chart shows that after a strong decline from previous highs, TWT entered a long consolidation phase. For several months, the price has been moving between appeoximately 0,7 and 1,5 USDT without a clear long time trend. Currently the price ius around 123USDT, slightly above the middle of the consolidation rang.
TWT - LONGTWT has real use. Im expecting that the token price will grow in near future. We are comming to the end of consolidation. This is not pump and dump project. It reminds early BNB or LINK. Same behaviour. Smart money always buys the dip. It can easily go to 10$ and even further because it has small cirr. supply. 20$ for a real use with PERPS is not something unexpected after so many months of consolidation. I hold my 30K $ position here. I expect to make 300k $ on this trade. Regards.
#TWT/USDT — Descending Triangle at Demand Zone!#TWT
The price is moving within a descending channel on the 1-hour frame, adhering well to it, and is heading for a strong breakout and retest.
We have a bearish trend on the RSI indicator that is about to be broken and retested, which supports the upward breakout.
There is a major support area in green at 1.21, representing a strong support point.
We are heading for consolidation above the 100 moving average.
Entry price: 1.25.
First target: 1.27.
Second target: 1.30.
Third target: 1.34.
Don't forget a simple matter: capital management.
When you reach the first target, save some money and then change your stop-loss order to an entry order.
For inquiries, please leave a comment.
Thank you.