UAI Breaks Out of Consolidation With Bullish MomentumUAI has shown a strong recovery move after holding the rising support structure and breaking above the descending resistance trendline. The breakout has pushed price back into a major supply zone, where the next direction will likely be decided.
A successful reclaim above the 0.399 - 0.450 resistance area could open the way toward the next target around 0.634. However, rejection from this zone may trigger a retest of the breakout area before the next move.
Key levels:
🟢 Support: 0.399 →0.299 → 0.234
🔴 Resistance: 0.450 → 0.634
📈 Bullish scenario: Holding above the breakout zone could continue the recovery toward higher targets.
📉 Bearish scenario: Failure to break the supply zone may lead to a pullback toward previous support levels.
In-depth trading ideas
UAIUSDT Forming Bullish MomentumUAIUSDT is forming a clear bullish momentum pattern, a classic bullish wave signal that often indicates an upcoming breakout. The price has been consolidating within a narrowing range, suggesting that selling pressure is weakening while buyers are beginning to regain control. With consistent volume confirming accumulation at lower levels, the setup hints at a potential bullish breakout soon. The projected move could lead to an impressive gain of around 60% to 70% once the price breaks above the wedge resistance.
This bullish momentum pattern is typically seen at the end of downtrends or corrective phases, and it represents a potential shift in market sentiment from bearish to bullish. Traders closely watching UAIUSDT are noting the strengthening momentum as it nears a breakout zone. The healthy trading volume adds confidence to this pattern, showing that market participants are positioning early in anticipation of a reversal.
Investors' growing interest in UAIUSDT reflects rising confidence in the project's long-term fundamentals and current technical strength. If the breakout confirms with sustained buying volume, this could mark the start of a fresh bullish leg. Traders might find this a valuable setup for medium-term gains, especially as the momentum pattern completes and buying pressure continues to accelerate.
✅ Show your support by hitting the like button and
✅ Leaving a comment below! (What is You opinion about this Coin)
Your feedback and engagement keep me inspired to share more insightful market analysis with you!
$UAI is pulling back into a key support area after rejecting hig$UAI is pulling back into a key support area after rejecting higher prices, but the overall structure is still constructive. As long as this zone holds, I think it's only a matter of time before buyers step back in and make another attempt at the breakout. As long as it holds above the $0.31 to $0.33 zone, I expect the next leg higher to begin, with much higher prices ahead if buyers keep defending this level. 🚀
UAIProverbs 16:18 — “Pride goeth before destruction, and an haughty spirit before a fall.”
UAI hath climbed into the high places, yet every throne raised without foundation awaiteth its judgment.
Within this band, the proud shall be weighed and found wanting. The Chart hath marked the path downward, and no false strength shall overturn its decree.
There shall the fall be completed. There shall pride return unto the dust.
The judgment is written. The descent awaiteth only its appointed hour.
UAI FOLLOWING AI NARRATIVEA market report highlighted UnifAI Network ($UAI ) as a standout performer, gaining 23.77% over 30 days to trade around $0.338 while major cryptocurrencies like Bitcoin moved sideways. The article noted that UAI's price remained near its monthly high, suggesting limited selling pressure, and framed the rally as part of a broader capital rotation into the AI crypto sector during a cautious market. This is bullish for UAI because it underscores its position within a high-conviction narrative attracting investor interest. The sustained price strength near highs could indicate accumulation rather than speculative pump-and-dump activity, though the sector's fate remains tied to overall crypto sentiment. An educational piece analyzed UAI's tokenomics, emphasizing its fixed total supply of 1 billion tokens, similar to Bitcoin's scarcity model. It explained that vesting schedules can reduce immediate selling pressure but warned that large future unlocks could impact the price. The article concluded that long-term value depends on technological adoption, partnerships, and competitive positioning within the AI infrastructure space. This is neutral for UAI, providing a balanced framework for evaluation. The fixed supply is a fundamental bullish lever if demand grows, but it also highlights execution risk—the project must deliver real utility and user growth to justify its fully diluted valuation. Market data showed UAI's price rocketing 19.4% to approximately $0.3390 on June 15. The move was flagged as statistically significant, being about 5.1 times larger than the token's average daily volatility over the prior 60 sessions. Despite the surge, UAI remained 44.3% below its all-time high of $0.6091. This is a bullish short-term signal, reflecting a powerful influx of buying pressure. Such an outsized move often attracts momentum traders, but it also increases the risk of a sharp pullback if volume fails to support the new price level, making subsequent consolidation key to watch. UnifAI Network is currently benefiting from a potent mix of sector-specific tailwinds and technical momentum, though its long-term trajectory depends on translating hype into sustainable platform adoption. Will the project's infrastructure developments keep pace with the rising market expectations?
UAIUSDT.P: long setup from daily resistance at 0.4078Yesterday's drop following the rally was completely bought back today. This is the first strong argument in favor of the buyer. Next, the reaction to the level is notable: usually, after a strong pump and a false breakout, an BINANCE:UAIUSDT.P goes into a correction or provides a logical bounce. But here it's the opposite — we are not falling; instead, we are moving sideways right under the level.
On the lower timeframe, the price has been holding beautifully for the last few hours, forming a pre-breakout base. Additionally, we are seeing a contraction in volatility, which is a classic signal before an impulse.
Considering all these factors, I conclude that a strong buyer is sitting here, and the probability of a breakout is high.
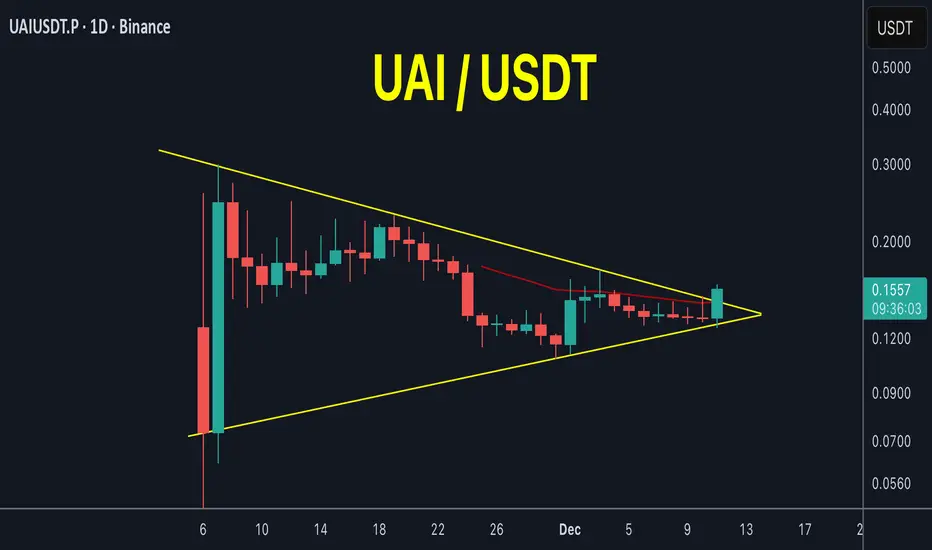
UAIUSDT Symmetrical Triangle 📝 Detail (TA Based):UAI is trading at 0.336 USDT, consolidating inside a symmetrical triangle. Price action is tightening between higher lows and lower highs, signaling a decisive move ahead. This pattern often acts as a continuation setup, and since the prior trend was bullish, probability favors an upside breakout if buyers step in.
⚡ Key Points for Post:
Symmetrical triangle forming on daily chart
Consolidation phase nearing completion
Breakout potential: bullish bias if resistance breaks
Time to Buy UAIusdtHello Traders!
UAIusdt is now at retest zone and i am expecting a pump soon. This pairs is a fast moving pair and has alot of volatilty so it will not take time to touch our target.
Also there are many more bullish trend confirmations in this pair.
We are buying UAIusdt from 0.3
Stoploss 0.288(-4%)
Target 0.34(+13.3%)
My goal is to be recognized as one of the highest win-rate traders in the TradingView community. :)
Trade Analysis Based on
> Fibonacci Tool (A1000x Way) – Custom Fibonacci approach for precise market analysis
> Candlestick Patterns – Strong price action confirmation through key candle formations
> A1000x Breakout Strategy – Identifying and trading high-probability breakout setups
> HH, HL & LH, LL Strategy – Market structure analysis for clear trend direction
> Swing Points – Tracking key highs and lows for accurate price movement insight
> A1000x Stoploss Strategy – Strategic stoploss placement for effective risk control
> A1000x Target Strategy – Structured target setting based on price action
We trade using carefully developed strategies and disciplined market analysis, always seeking the best possible accuracy while remembering that ultimate success comes only by the will of Allah.
In some trades, you may notice a relatively larger stop loss or a risk-to-reward ratio that may appear unusual at first glance. However, every trade is taken with proper planning and calculated analysis, not random entries.
Before entering any position, we perform detailed calculations and market evaluation. Based on this analysis, we carefully determine our stop loss and target levels.
I personally apply one of my specialized stop-loss and target strategies, designed to place the stop loss at a logical market level where price is less likely to reach before moving toward the intended target — InshaAllah.
Trading always involves risk, but with discipline, patience, and proper strategy, we aim for consistent and responsible decision-making.
Feel free to share your thoughts, leave a comment, or contact me.
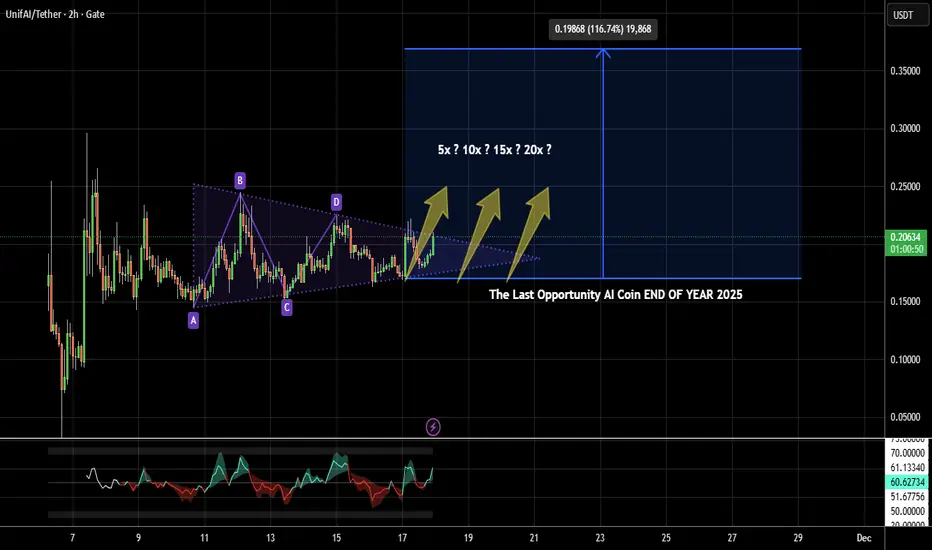
UAI/USDT – Symmetrical Triangle, Breakout or Rejection?UAI/USDT on the 1D timeframe is currently forming a clear Symmetrical Triangle pattern, characterized by a descending resistance trendline 📉 and a rising support trendline 📈 that continue to compress price volatility toward the apex.
This pattern suggests that the market is in a consolidation phase following a significant move and is preparing to determine its next major trend direction. ⚡
Technically, the price is now trading very close to the intersection of both trendlines, increasing the probability of a breakout in the near future. Momentum and volume will be key factors in confirming the next directional move. 🎯
━━━━━━━━━━━━━━━━━━━━
📊 Pattern Structure: Symmetrical Triangle
A Symmetrical Triangle forms when:
🔹 Lower highs continue to develop beneath a descending resistance line.
🔹 Higher lows continue to form above an ascending support line.
🔹 The trading range becomes increasingly narrow as price approaches the apex.
🔹 This reflects a temporary balance between buyers 🐂 and sellers 🐻 while accumulation takes place.
Since this is considered a neutral pattern ⚖️, the breakout direction will determine the market's next dominant trend.
━━━━━━━━━━━━━━━━━━━━
🟢 Bullish Scenario
A bullish breakout will be confirmed if price manages to:
✅ Break out and close strongly above the triangle resistance.
✅ Successfully reclaim the horizontal resistance zone around $0.3765.
✅ Turn previous resistance into new support.
🎯 Potential upside targets:
🥇 Target 1: $0.3765
🥈 Target 2: $0.5924 (Major Resistance)
🥉 Target 3: $0.80 – $1.00 if momentum and breakout volume remain strong.
🚀 Breakouts from Symmetrical Triangle formations often lead to explosive moves because volatility has been compressed for an extended period.
📈 As long as price remains above the breakout level, the probability of a continuation rally toward previous highs increases significantly.
━━━━━━━━━━━━━━━━━━━━
🔴 Bearish Scenario
A bearish outcome may occur if:
❌ Price fails to break above resistance.
❌ The ascending support trendline is broken with a strong daily candle close.
❌ Selling pressure increases below key support levels.
🎯 Potential downside targets:
🔻 First Support: $0.2700
🔻 Second Support: $0.2100
🔻 Major Support: $0.1500
📉 A breakdown from this pattern could trigger accelerated distribution as many long positions may begin exiting the market.
⚠️ As long as price remains inside the triangle, traders should be cautious of both fake breakouts and fake breakdowns.
━━━━━━━━━━━━━━━━━━━━
🔍 Conclusion
UAI/USDT is currently approaching a critical decision point. The Symmetrical Triangle structure indicates that volatility is being compressed before the next major market move. 💥
💡 The $0.3765 level remains the key resistance that bulls must overcome to open the path toward $0.5924 and potentially the $1.00 region.
🚀 If a breakout is confirmed with strong volume, the probability of a significant bullish expansion will increase substantially.
⚠️ However, until a confirmed breakout occurs, traders should remain cautious of possible rejections and downside moves toward lower support levels.
📌 Wait for a valid breakout or breakdown confirmation before making trading decisions.
━━━━━━━━━━━━━━━━━━━━
#UAI #UAIUSDT #Crypto 🚀 #Cryptocurrency #Altcoins #Binance #TechnicalAnalysis 📊 #TradingView #SymmetricalTriangle #TriangleBreakout #BullishBreakout 🐂 #CryptoTrading #PriceAction #SupportAndResistance #ChartPattern #AltcoinSeason #BreakoutTrading #USDT #Trading #CryptoMarket 💹
UAI Acceptance Above Value? — Continuation or Local Exhaustion?UAI is transitioning from a slow accumulation phase into expansion. After reclaiming prior range highs, price is now holding above value with increasing participation.
HTF Context:
Higher timeframe shows a clear shift from compression → expansion. Price broke out of a multi-month base and is now holding above that prior range, signaling acceptance rather than rejection.
EMAs are beginning to fan out, confirming a transition into a trending phase.
LTF Structure:
On the lower timeframe, we’re seeing a clean sequence of higher highs and higher lows, with price consistently respecting the 10/20 EMA.
Recent pullbacks are shallow and controlled — no aggressive rejection, which suggests participants are still supporting price on dips.
Volume expanded on the move up and is now stabilizing, pointing to healthy continuation behavior rather than immediate exhaustion.
Cycle Position:
Currently sitting it at the Crossback (1st flag continuation) after the initial expansion leg.
Market has already completed the impulsive move and is now deciding between continuation vs short-term distribution.
Scenarios:
🟢 Continuation:
If price continues to show acceptance above this reclaimed range, and LTF holds EMA structure with compression forming near highs → likely continuation into higher levels.
Key tell: tightening + declining volatility before expansion.
🔴 Failure:
If price loses this range and shows rejection back into prior value, especially with increasing downside momentum → signals failed breakout and potential rotation back into the range.
Execution Mindset:
Not chasing extension. Watching for compression near highs or clean pullbacks into EMA support with continued acceptance.
The edge comes from entering during contraction before expansion, not after the move.
Closing Line:
This is no longer a reversal play — it’s a continuation environment. The only question is whether participants can maintain control above this range.
Disclaimer:
Not a signal. Just how I’m reading structure and participation.
UAIUSDT — Strong Bull Tag on a Bear Cascade ....With Leverage Declining and Squeeze Just Starting to Build
Futures running Fut Lean at 20.97M dollar flow versus spot 1.17M — that is a significant dollar imbalance with futures 17x the spot dollar value. Unit volume shows 248.38K futures against 1.17M spot units, so spot is more active by count but futures dominate by dollar weight. This ratio flags leveraged positioning driving price rather than spot accumulation, which matters when reading the bull signal stack against a bear cascade backdrop.
Signal board at 32 green to 20 red out of 112 — mild bull lean. Strong BULL 31.88% at 1.94x with clarity 46% — directional but low conviction. EMA 5:1 near-clean, Candle 10:4, C>T 8:5, Ichi TK 6:6 dead even, DD/SS 2:1 manageable. Pat Tot 2:1, Star 2:1. Bear Cascade running 4 bars at 4.2% move — the cascade and the bull tag are running simultaneously, which signals the market is mid-transition not committed either direction. Squeeze building at 1 bar, BW 65.38% normal, momentum bear rising — early squeeze formation just initiated.
Spot Z -0.25 steady, Fut Z -0.49 steady, combined -0.49 steady — futures selling harder than spot across the board. The 1-to-5 Spot Z range flat at -0.25 to -0.25 to 0 with a falling tag — volume completely stalled with no directional push. Spot momentum contracting at 492.4% wide. Bull:Bear Z -0.27 to -0.44 neutral leaning bear. OBV Z 0.31 drifting lower — inflow present but decelerating, not building.
Leverage at 17.91x declining, percentile 29.5% lower — the deleveraging is constructive. AT Max was 59.37x just 27 bars ago collapsing to current 17.91x — significant flush in very recent memory. Price at 32.4% lower range. Prem 0.13% contango mild at 0.4 sigma with yield 139% APY bear — contango with a bear yield is an unusual combination flagging indecision in the funding market. Retrace -54.8% deep with bounce only 22.1% partial — price has given back most of the prior move.
The honest read: UAI sits at lower range with leverage freshly flushed from 59x to 17x in 27 bars, squeeze just starting to build, and price at 32.4% floor — structurally the setup has reversal ingredients. The friction is futures running 17x spot dollar flow, all Z scores negative and stalled, bear cascade still active 4 bars in, and OBV drifting rather than building. The bull tag reflects signal board math but not volume conviction. Watch the squeeze direction when it fires — if spot volume accelerates on the break, the -54.8% retrace base becomes meaningful support for a recovery. Until then the bear cascade has priority.
Is That Crypto Pump Real? Data Says No. Here's Why.
Stop Losing Money to Fake Volume. Find Real Moves Now.
Trade the REAL Crypto Volume. Stop Getting Faked Out.
UAIUSDT: Strong Bear Recovers Without ConvictionUAI on Bitget is producing a recovery signal inside a structurally broken market. Spot at 0.38295 with futures at 0.38279 — a near-neutral -0.04% backwardation, Z at -0.5, Yield at -46% APY 0.5σ Bull. Funding mildly favors longs but nothing statistically significant. S/F Vol at 2.84M spot versus 86.99M futures, S/F S at 1.09M versus 33.31M — Spot:Fut reads Normal, ratio elevated toward futures but within acceptable range. The 98.1% bounce at 2.5x Recov classification after a -39.6% retrace is the headline number, but Recov classification rather than BO means the market is recovering losses, not breaking out into new territory.
Signal count is 14 green to 41 red out of 112 — 68.9% bearish dominance. Strong BEAR at 37.76% edge at 2.21x. C>T arrows mixed with no directional sweep. EMA stack 2:4 net bearish. Candle 3:11 near-complete bearish sweep across timeframes. Engulf 1:3 bearish. Ichi TK 6:5 slightly bear dominant. SS/DD 2:0 is the one clean structural bull signal. Spread at 37.8% Strong confirms wide committed candle bodies. Squeeze at None with Mom Bull↓ — no squeeze setup active, momentum is upward but decelerating. BW at 115.29% Blowoff — bandwidth is in full expansion Blowoff territory, meaning the volatility event is already in progress and historically approaching exhaustion rather than continuation. MeanZ at 0.2σ Norm confirms price is near its statistical mean.
Spot Z -0.25 Steady, Fut Z -0.38 Steady, F+S Z -0.4 Steady. All three volume readings below average but stable — quiet participation during the recovery move. SpotZ 1:5 reads -0.25 vs -0.24 with combined -0.01 Falling — essentially flat, no acceleration in either direction. This is a volume-neutral recovery, not a volume-confirmed reversal. Bull:Bear Z -0.33 vs -0.17 Neutral — neither buyers nor sellers dominating at the volume level. S.Mom 284.9% Con↑ Normal — spot momentum is contracting upward, a deceleration signal during the bounce. Mkt Normal — market quality clean with no manipulation distortion in the volume feed itself.
Leverage at 30.58x V.High, Percentile at 51.1% Mid. AT Max was 59.37x at only 8 bars ago — an extremely recent leverage peak that has partially collapsed. Eight bars ago this instrument was running near its all-time leverage maximum, and in 8 bars it has dropped to 30.58x. That rapid leverage flush pattern combined with a 98.1% bounce is consistent with a short squeeze recovery event rather than organic accumulation. Price % reads n/a with Hi/Lo n/a — insufficient historical range data. StdDev at 0.202% Volat Volat confirms elevated realized volatility consistent with the Blowoff bandwidth reading.
OBV Z 0.63 Outflow with Normal divergence is the structural warning — despite the 98.1% bounce, OBV is still in outflow territory. Sellers remain structurally dominant at the volume level even as price recovers. Pat Tot 1:6 and Star 1:4 are heavily bearish on pattern signals — reversal patterns skew strongly toward continuation of the prior downtrend. Harami 0:0 inactive. No whale signal. Liquidation cleared. Sqz Div Normal. The absence of any squeeze setup combined with Blowoff bandwidth means the volatility expansion has no coiling mechanism behind it — it is burning freely rather than compressing for a directional resolution.
The honest read: UAIUSDT is a dead-cat bounce candidate, not a reversal. The 98.1% Recov after -39.6% retrace looks impressive in isolation, but every structural signal contradicts follow-through — OBV Outflow, Candle 3:11, Pat Tot 1:6 net bearish, BW Blowoff approaching exhaustion, and an AT Max leverage event just 8 bars ago that partially flushed. The SS/DD 2:0 structural bull and the mild funding tailwind are noted but insufficient against the weight of the bear signal stack. Clarity at 49% confirms the market has no directional conviction. This is a recovery inside a downtrend, not the end of it. Wait for OBV to flip positive, pattern signals to rebalance, and leverage to normalize before considering any long thesis. The Recov classification itself carries the answer — until it prints BO, the trend has not changed.
Is That Crypto Pump Real? Data Says No. Here's Why.
Stop Losing Money to Fake Volume. Find Real Moves Now.
Trade the REAL Crypto Volume. Stop Getting Faked Out.
UAI COIN SKYROCKETING BULLISH PATTERN BREAKOUTUAI Coin is showing a strong bullish breakout and momentum is building fast 📈
In this video, we break down:
✅ Key breakout levels
✅ Resistance turned support
✅ Volume confirmation
✅ Next price targets
Is this the beginning of a massive rally? 🚀
Don’t miss this early opportunity — smart money may already be entering!
👉 Watch till the end for full technical analysis and strategy
⚠️ This is not financial advice. Always do your own research (DYOR).
Artificial Intelligence is catching a bidWhile Bitcoin naps, the AI coin narrative is waking up and choosing violence. We are seeing tokens like $UAI showing significant strength.
The chart for $UAI is forming a textbook higher low structure. After a period of chopping around, it has broken above local resistance and is trading near $0.27.
When you see a chart pattern like this, it usually means buyers are stepping in earlier and earlier.
They are not waiting for the price to drop back to the low to buy. They are impatient. That impatience is what drives prices higher.
If this momentum continues, $UAI could be leading the charge for the next wave of AI sector hype.
BINANCE:UAIUSDT.P
UAI/USDT – SPOT SETUP!Hey Traders!
If you’re finding value in this analysis, smash that 👍 and hit Follow for high-accuracy trade setups that actually deliver!
Structure: Ascending channel + breakout attempt
🔹 Buy Zone:
➡️ 0.205 – 0.215
🎯 Targets:
• Target 1: 0.25
• Target 2: 0.32
• Target 3: 0.45
• Target 4: 0.65+
🛑 Stop Loss (Spot):
❌ 0.18 (Daily close basis)
🔍 Why this setup looks strong:
• Price holding above rising support
• Compression inside ascending channel
• Breakout momentum building
• High upside with controlled risk
⚠️ Note:
Buy in parts and avoid FOMO.
Patience always pays in spot trades 💎
Stay disciplined. Stay profitable 💪
UAI Analysis (8H)Before anything else, it’s crucial to understand that this is a highly volatile and high-risk asset. Proper risk management is essential always manage your leverage carefully and protect your capital. Do not enter a position impulsively; wait for proper confirmation signals and a clear trigger before executing any trade. Patience and discipline are key in trading assets like this.
Looking at the chart, from the point where we placed the red arrow, it appears that a UAI correction has begun. This correction seems to take the form of an ABC structure, though it could also develop into a more complex corrective pattern. At the moment, Wave B of this correction looks like it is forming a diagonal, and we are currently in its g wave. This wave may require additional time to complete fully, especially within the red highlighted zone.
It’s important to monitor Wave B carefully. If Wave B ends up being symmetrical, rather than a diagonal, this has major implications. Symmetrical waves have two additional sub-waves compared to diagonals, meaning that Wave B could potentially extend further than initially expected. Traders should remain alert for this possibility and adjust their strategy accordingly.
From the red zone, we can anticipate a potential price rejection toward the specified target levels. This zone represents a critical area where supply/demand dynamics could shift, offering high-probability setups for traders who exercise patience and discipline.
However, it’s important to note that this analysis will be invalidated if a daily candle closes above the designated invalidation level. Such a close would signal that the market is likely breaking out of the current corrective structure, requiring a reassessment of the trade idea.
In summary, maintain strict risk management, watch for confirmations before entering, pay attention to the development of Wave B (diagonal vs. symmetrical), and use the red zone as a key area for potential price action and trade setups. Trading with patience and discipline in these volatile conditions is the only way to protect capital and maximize potential gains.
If you have a coin or altcoin you want analyzed, first hit the like button and then comment its name so I can review it for you.
This is not a trade setup, as it has no precise stop-loss, stop, or target. I do not publish my trade setups here.
UAI/USDT Confirms Breakout — Momentum Shifts Up!#UAI
UAI has successfully broken out from its hourly accumulation base, signaling the end of the consolidation phase. Price has also confirmed a breakout above the bullish flag, while the broader structure shows a clean breakout from the symmetrical triangle.
This confluence of structural breaks strengthens the bullish bias and suggests that upside continuation is a matter of timing, with price having room to expand toward higher targets.
However, caution remains necessary. The bullish scenario is only valid as long as price can sustain above the newly formed demand zone.
A failure to hold this area, followed by a breakdown back below demand, would invalidate the bullish structure and shift momentum back to the downside, opening the door for a deeper pullback.
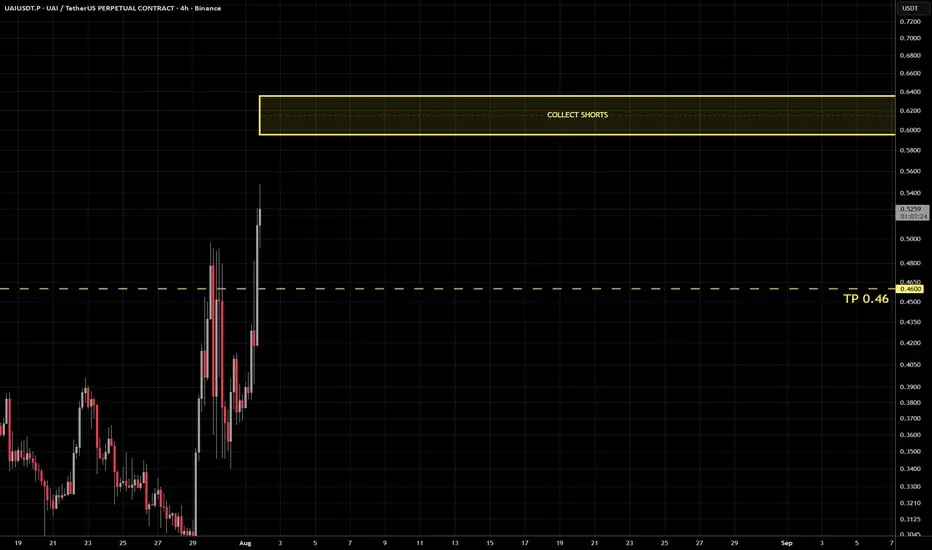
Bear Flag Formed — Expecting Downside A classic bear flag structure has formed after a strong impulsive decline. Price is currently moving inside an ascending corrective channel, which looks like a consolidation rather than a trend reversal. After this minor bounce and compression, I expect a bearish continuation with a breakdown below the lower boundary of the flag.
If the structure plays out as expected, the measured move of the bear flag points to a downside target in the 0.11 – 0.095 area. This zone aligns with prior demand and could act as the next support.
The bearish scenario remains valid as long as price stays below the upper boundary of the flag. A confirmed breakdown with increased volume would strengthen the continuation setup.