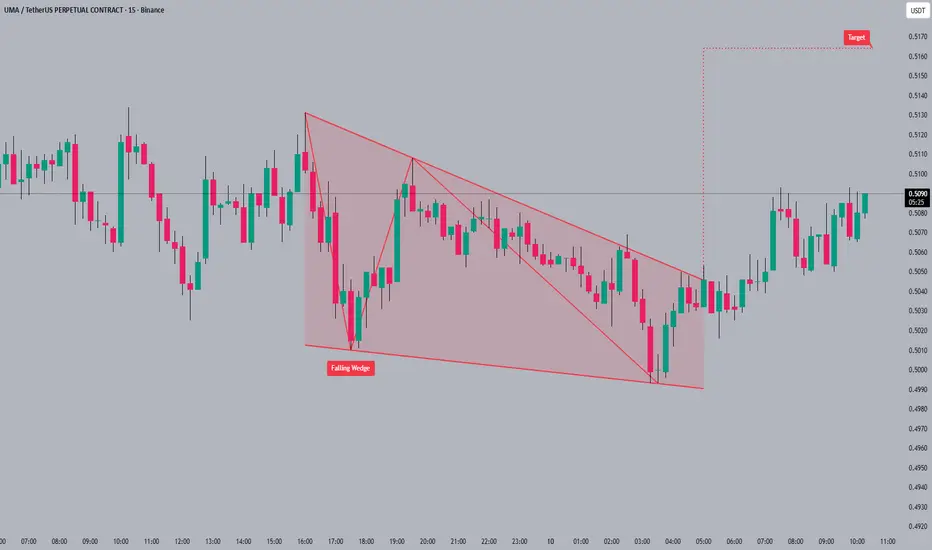
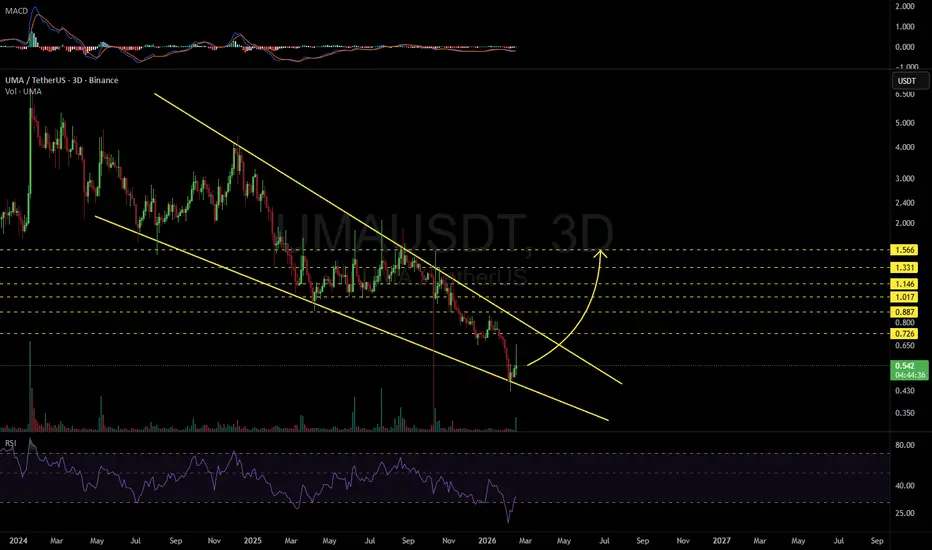
UMAUSDT Forming Falling WedgeUMAUSDT is forming a clear falling wedge pattern, a classic bullish reversal signal that often indicates an upcoming breakout. The price has been consolidating within a narrowing range, suggesting that selling pressure is weakening while buyers are beginning to regain control. With consistent volume confirming accumulation at lower levels, the setup hints at a potential bullish breakout soon. The projected move could lead to an impressive gain of around 70% to 80% once the price breaks above the
In-depth trading ideas
UMAUSDT 1D#UMA has bounced strongly from a support zone on the daily chart and is now approaching a key resistance area formed by the daily EMA100 and descending trend resistance.
If a confirmed breakout above these levels occurs, the following upside targets could come into play:
🎯 $0.530
🎯 $0.579
🎯 $0.628
🎯 $0.697
🎯 $0.786
⚠️ Always remember to use a tight stop-loss and maintain proper risk management.
UMAUSDT Forming Falling WedgeUMAUSDT is forming a clear falling wedge pattern, a classic bullish wave signal that often indicates an upcoming breakout. The price has been consolidating within a narrowing range, suggesting that selling pressure is weakening while buyers are beginning to regain control. With consistent volume confirming accumulation at lower levels, the setup hints at a potential bullish breakout soon. The projected move could lead to an impressive gain of around 90% to 100% once the price breaks above the we
UMA/USDT — Massive Breakout or Continued Downtrend?The UMA/USDT 3D timeframe chart is still under medium- to long-term bearish pressure, but it is starting to show signs of a potential reversal after successfully holding the major support area around 0.37 – 0.42 USDT. 📊
A clear descending resistance trendline (yellow line) has been suppressing price movement since late 2024. This structure forms a Descending Triangle / Descending Resistance Compression pattern, where price continues creating lower highs while building a more stable support base
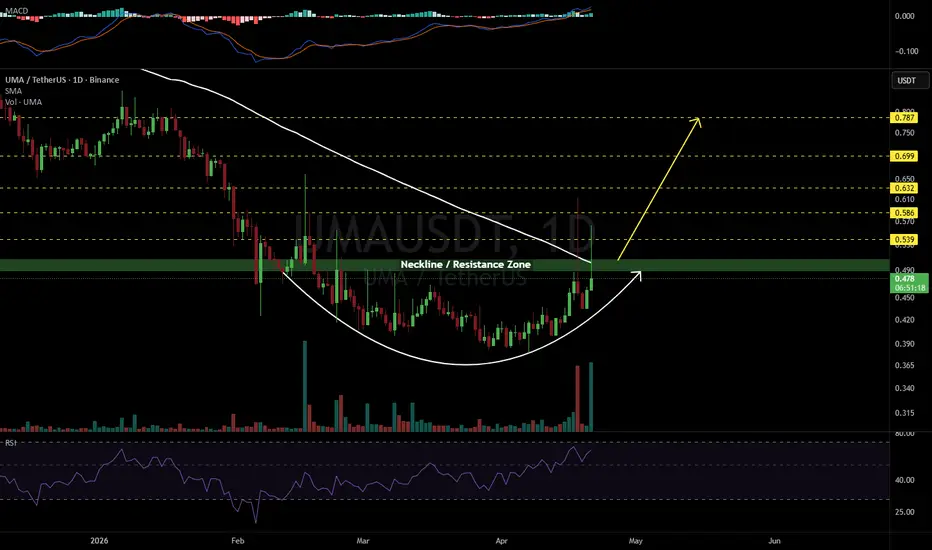
UMAUSDT 1D#UMA has formed a rounding bottom pattern on the daily chart. Volume has spiked. In case of a breakout above the resistance zone, which is the neckline of the pattern and the daily SMA100, the potential upside targets are:
🎯 $0.539
🎯 $0.586
🎯 $0.632
🎯 $0.699
🎯 $0.787
⚠️ Always remember to use a tight stop-loss and maintain proper risk management.
UMAUSDT Forming Bullish MomentumUMAUSDT is forming a clear bullish momentum pattern, a classic bullish reversal signal that often indicates an upcoming breakout. The price has been consolidating within a narrowing range, suggesting that selling pressure is weakening while buyers are beginning to regain control. With consistent volume confirming accumulation at lower levels, the setup hints at a potential bullish breakout soon. The projected move could lead to an impressive gain of around 50% to 60% once the price breaks above
UMA on track to hit $11.1, nice 2,500% profits potentialThere is no place to hide. It is impossible to say that nobody saw it coming because we've been calling it for months. Thousands and thousands of people know, hundreds of thousands, maybe even millions.
Millions of people are aware of what is unfolding now. You know. I know. You know I know and I know you know. We both know and we know that all the others that are reading this now also know, even if some disagree. It has been in the making for months.
UMAUSDT concluded its five months long dou
#UMA/USDT Ready to go up#UMA
The price is moving within a descending channel on the hourly timeframe. It has reached the lower boundary and is heading towards a breakout, with a retest of the upper boundary expected.
The Relative Strength Index (RSI) is showing a downward trend, approaching the lower boundary, and an upward bounce is anticipated.
There is a key support zone in green at 500, and the price has bounced from this level several times. Another bounce is expected.
The RSI is showing a trend towards consol
UMAUSDT Forming Falling WedgeUMAUSDT is forming a clear falling wedge pattern, a classic bullish reversal signal that often indicates an upcoming breakout. The price has been consolidating within a narrowing range, suggesting that selling pressure is weakening while buyers are beginning to regain control. With consistent volume confirming accumulation at lower levels, the setup hints at a potential bullish breakout soon. The projected move could lead to an impressive gain of around 90% to 100% once the price breaks above th
#UMA/USDT#UMA
The price is moving within a descending channel on the 1-hour frame, adhering well to it, and is heading for a strong breakout and retest.
We are seeing a bounce from the lower boundary of the descending channel, which is support at 1.36.
We have a downtrend on the RSI indicator that is about to break and retest, supporting the upward trend.
We are looking for stability above the 100 moving average.
Entry price: 1.39
First target: 1.42
Second target: 1.45
Third target: 1.49
#UMA/USDT#UMA
The price is moving within a descending channel on the 1-hour frame, adhering well to it, and is heading toward a strong breakout and retest.
We are experiencing a rebound from the lower boundary of the descending channel, which is support at 1.36.
We are experiencing a downtrend on the RSI indicator that is about to be broken and retested, supporting the upward trend.
We are heading toward stability above the 100 moving average.
Entry price: 1.41
First target: 1.45
Second target: 1.50
UMAUSDT - THE SHORT TERM bullish expected.Dear Friends,
as i left comments for UMA , i exepect to hit to 0.9 usdt.
it has been already touched the 0.95 USDT and rejected from there, i think there is no room to hit 0.95 or 0.9 again in order to make a double bottom. SO , i expect
1.071
1.087
1.1
1.14
1.154
1.222 after that we'll review the chart in due course.
this is just an idea and for your trade, please investigate more.
my regards,
UMAUSDT Forming Falling WedgeUMAUSDT is showing a falling wedge pattern, which is widely recognized as a bullish reversal indicator in technical analysis. This pattern typically forms during a downtrend when price movements begin to narrow, suggesting that bearish momentum is losing strength and a potential breakout to the upside may be near. The good trading volume observed reinforces this outlook, indicating that accumulation may already be taking place as traders anticipate a strong upward push. If a breakout occurs abov
UMAUSDT 1D#UMA is moving inside a falling wedge pattern on the daily chart. Consider buying here and near the support levels of:
$1.013 and $0.826
In case of a breakout above the wedge resistance and the daily SMA100, the potential targets are:
🎯 $1.352
🎯 $1.518
🎯 $1.684
🎯 $1.920
🎯 $2.220
⚠️ Always remember to use a tight stop-loss and maintain proper risk management.
UMAUSDT Forming Bullish WaveUMAUSDT is currently demonstrating a bullish wave pattern, signaling strong upward momentum and trend continuation. This wave formation suggests that the coin has entered a healthy impulsive phase, where higher highs and higher lows are forming consistently. The recent price action shows accumulation at key support levels, followed by breakout moves that align with this bullish structure, indicating renewed confidence among buyers.
Volume has remained consistently strong, which adds further cre
UMAUSDT — Major Battle at Demand Zone, Waiting for Breakout?🔎 Overview
The weekly chart of UMA/USDT is showing a very interesting setup:
Since 2021, price action has been consistently forming lower highs, capped by a long-term descending trendline (yellow line).
On the other side, buyers continue to defend the strong demand zone at 1.20 – 1.70 (yellow box).
This structure has formed a multi-year descending triangle/base — a strong sign of long-term accumulation and compression.
In short, UMA is now at a crucial decision point: either a breakout tha
UMAUSDT 1D#UMA is moving inside a symmetrical triangle on the daily chart and is on the verge of breaking out above it. Consider buying at the current price and near the support level of $1.422.
If the breakout is confirmed, the potential targets are:
🎯 $1.752
🎯 $2.019
🎯 $2.286
🎯 $2.666
🎯 $3.150
⚠️ As always, use a tight stop-loss and apply proper risk management.
UMA Loading a Big Move – Don’t Miss This Setup!UMA has shown a clear change of character with a bullish break of structure. Price is now retesting the fair value gap (FVG) area, setting up for a possible continuation move upward.
Entry: 1.47
Stoploss: 1.406
Targets:
1.535
1.595
1.691
If buyers defend the FVG zone, UMA could rally toward higher targets with strong momentum.
UMAUSDT Forming Bullish WaveUMAUSDT is currently demonstrating a bullish wave pattern, signaling strong upward momentum and trend continuation. This wave formation suggests that the coin has entered a healthy impulsive phase, where higher highs and higher lows are forming consistently. The recent price action shows accumulation at key support levels, followed by breakout moves that align with this bullish structure, indicating renewed confidence among buyers.
Volume has remained consistently strong, which adds further cre