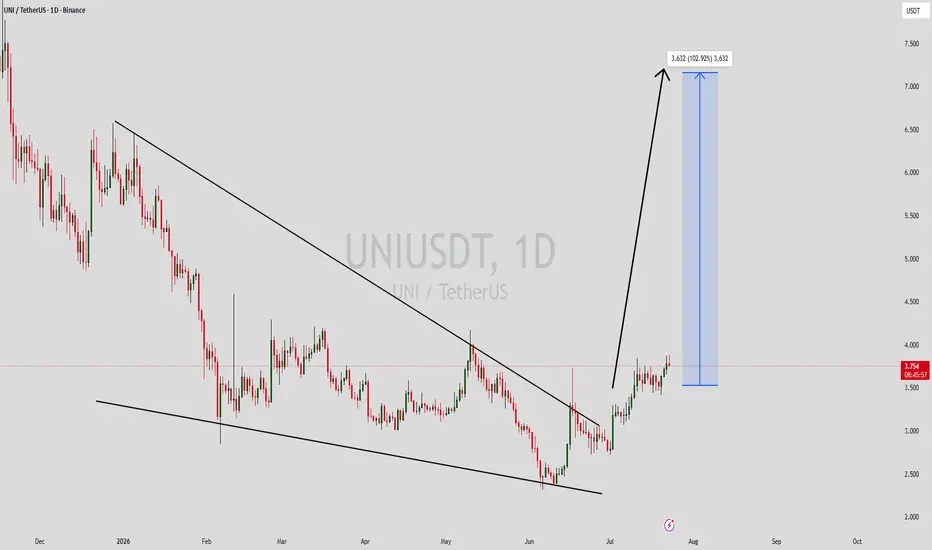
UNIUSDT Forming Falling WedgeUNIUSDT is forming a clear falling wedge pattern, a classic bullish wave signal that often indicates an upcoming breakout. The price has been consolidating within a narrowing range, suggesting that selling pressure is gradually weakening while buyers are beginning to regain control. With consistent
UNI Technical Analysis: Breakout or Reversal?The 4H chart of CRYPTOCAP:UNI isn't just showing price movement; it's showing a battle between buyers who have controlled the trend for weeks and sellers who are trying to defend a major resistance area.
However, the recent breakout above the previous swing highs wasn't just another small bounce;
UNI USDT SHORT SIGNAL#122. UNI/USDT – Trade Setup (SHORT)
📈 Position Type: SHORT
🕒 Timeframe: 1H
📊 Market: Futures
💰 Entry Zone:
3.724
3.808
🛑 Stop-Loss:
3.890
🎯 Take-Profit Targets:
• TP1: 3.628
• TP2: 3.488
• TP3: 3.310
• TP4
⚙️ Leverage:
5 *10
▫️ After TP1, move SL to Entry + 0.2%.
▪️ Exit Plan:
• 5
Uniusdt shortInstructions:
Entry point: yellow
Stop loss: red
Take profit: green
👉Leverage x 5-10-20 for crypto
👉Leverage x 20-50-100 for commodities, stocks, indices, and forex
👉Margin 1-5% max.
Always practice risk and money management.
Invest a maximum of 5% on any trade or across all your trades.
Invest on
UNI BOTTOMED OUT HEREMIL:UNI The fee switch expanded to eight L2s through an executed governance vote, with 98.1% of revenue now reaching holders
Uniswap finally flipped the fee switch in late 2025, burning MIL:UNI from protocol fees, but the impact so far is marginal
MIL:UNI generated $5.6B+ in fees since incept
#UNIUSDT ANALYSIS (1D Timeframe)UNIUSDT is trading inside a rising channel after a strong recovery from its recent lows. Price is currently testing the upper boundary of the channel, where sellers have stepped in, making this a key decision zone.
📍 Current Price: 3.69 USDT
🟢 Key Support: 3.00–3.10 USDT (lower channel support)
🔴
UNI Multi-Year Accumulation Signals a High-Reward OpportunityUniswap (UNI) has once again returned to a long-term demand zone that has consistently acted as a major accumulation area since 2022. After years of range-bound price action, the market is revisiting a region where buyers have repeatedly stepped in, making this one of the most important technical le
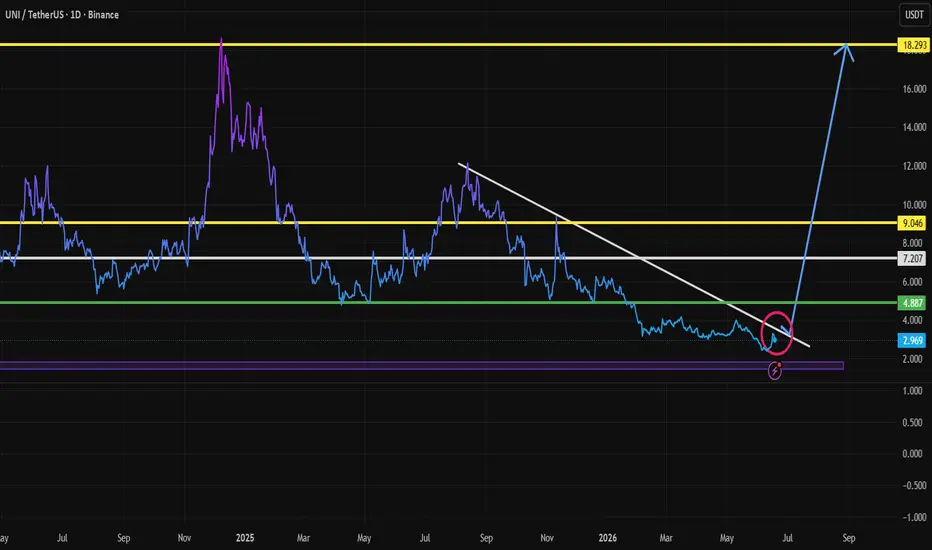
Uni. USDTUniswap has shown strong growth over the past few days.
However, it has failed to break above $3.85. if it manages to break this level, the next target would be $4.85, followed by resistance levels at $7 , $9 and $18, respectively.
The fact that some are predicting a $100 price for Uni doesn't corr
UNI/USDT – Bearish Order Flow Idea 🔴 UNI/USDT – Bearish Order Flow Idea
Market Bias: Bearish
Concept: Market Structure / Order Flow
UNI/USDT
UNI/USDT continues to respect a well-defined bearish market structure, with price consistently forming lower highs and lower lows across the higher timeframes. The recent bullish move appear
$UNIUSDT Update (12H)UNIUSDT Update (12H)
Everyone is looking at the recent pullback, but for me, the bigger picture hasn't changed yet. Price is still trading above the main ascending trendline, and the green demand zone around $3.00–$3.20 remains the key area to watch. As long as this zone holds and buyers step back
See all ideas
Summarizing what the indicators are suggesting.
Oscillators
Neutral
SellBuy
Strong sellStrong buy
Strong sellSellNeutralBuyStrong buy
Oscillators
Neutral
SellBuy
Strong sellStrong buy
Strong sellSellNeutralBuyStrong buy
Summary
Neutral
SellBuy
Strong sellStrong buy
Strong sellSellNeutralBuyStrong buy
Summary
Neutral
SellBuy
Strong sellStrong buy
Strong sellSellNeutralBuyStrong buy
Summary
Neutral
SellBuy
Strong sellStrong buy
Strong sellSellNeutralBuyStrong buy
Moving Averages
Neutral
SellBuy
Strong sellStrong buy
Strong sellSellNeutralBuyStrong buy
Moving Averages
Neutral
SellBuy
Strong sellStrong buy
Strong sellSellNeutralBuyStrong buy
Displays a symbol's price movements over previous years to identify recurring trends.