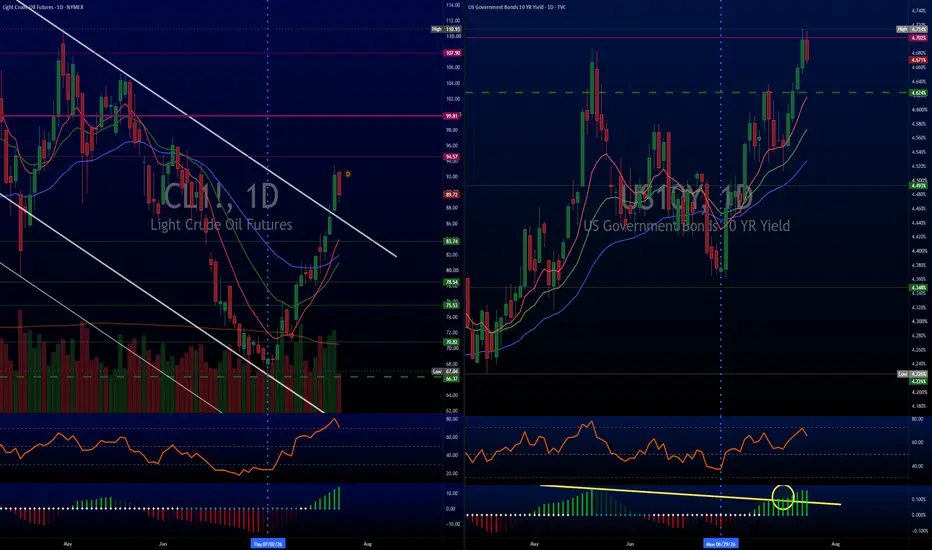
Why Stocks Fall When Rates, Oil, and $DXY DropWhen you see a session where Rates, Oil, and DXY drop together, standard mechanical rules say stocks should rally because financial conditions are easing.
When equities fall anyway, the driver has shifted from monetary tightening to growth fears and earnings execution.
-------
1. Mega Cap Earnings
US Government Bonds 10 YR Yield
No trades
No trades
Compare with US 10Y yield
US10Y: The Macro Breakdown and Big Picture RoadmapThe daily chart shows losing momentum, but zooming out to the weekly and monthly timeframes paints a much bigger picture. Higher timeframes always control the trend, and the larger structure remains heavily slanted to the upside.
Daily Momentum Lag
Daily RSI shows a classic bearish divergence, sign
10Y vs 2Y Yields: Momentum Is Fading at the TopTreasury yields have pushed back toward their summer highs, but the underlying technical momentum tells a very different story. Both the 2 Year and 10 Year yields are showing clear signs of momentum exhaustion.
2 Year:
Price Action
Yields recently pushed up to a new high, topping the May peak.
The
2Y and 10Y Bond Yield Spread: Week of July 27See levels and key areas for this week:
After you click the link, click “Grab this Chart” at the bottom/right of the chart or Load Live Bars on far middle-right.
“Grab this Chart” opens a copy of the chart environment, but it doesn’t automatically save as a permanent layout in your dashboard. Once t
US10Y: Technical Roadmap Above 4.80% Pt 1We’ve already covered the core macroeconomic drivers many times. Now let's map out the technical footprint on the high timeframe.
As TVC:TNX presses into breakout territory, here are the key technical levels to watch:
4.80%:
The immediate line in the sand currently being tested.
5.2% (Cyan Line)
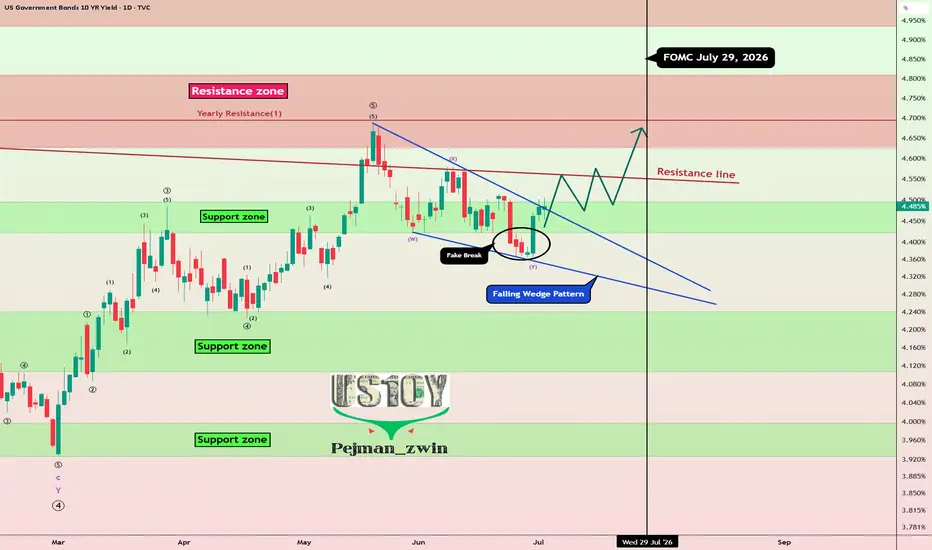
US10Y Fake Break:Is a New Bond Yield Rally About to Shake MarketToday, I want to analyze the U.S. 10-Year Government Bond Yield ( TVC:US10 ), as it is one of the key financial market indices that can show us the broader market direction for various assets like Gold ( OANDA:XAUUSD ), Silver ( OANDA:XAGUSD ), U.S. stock indices (including the S&P 500 ( FOREXCO
Why I'm Watching the US 10-Year Yield So Closely Right NowBack in January and February, I described the US 10-year Treasury yield as being in a constructive—but admittedly rather boring—sideways pattern.
While price action lacked excitement, the technical structure suggested that pressure was quietly building beneath the surface.
Today, that upside press
10Y Weekly Mega Symmetrical Triangle Pt1Macro Compression:
The 10 year yield is nearing the apex of a massive multi year symmetrical triangle/pennant pattern.
Yields are reaching a major inflection point:
Both 10Y and 2Y rates are testing multi month, multi year, structural resistance levels simultaneously.
A clean breakout here would t
US 10Y Treasury Yield Faces Bearish PressureThe US 10-Year Treasury yield is showing signs of weakening as expectations around future monetary policy and easing inflation pressures continue to shape market sentiment. If sellers remain in control, yields could extend lower in the coming sessions. A sustained move to the downside would reinforc
US10YR 1W TIME CYCLESCYCLICAL PATTERN OF 65 - 70 WEEK HIGHS (+-2)
Smaller Pattern of 20 - 26 Week Lower Highs from Major One.
Based on this, Next Highs should be:
Sept 28th - Nov 21st 2026
Aug 16th - Oct 5th 2027 (Major)
Inversely correlated with Stocks/SPX/NDX so a High = a Low for those ones (usually)
See all ideas
A graphical representation of the interest rates on debt for a range of maturities.
Frequently asked questions
The current yield rate is 4.718% — it's increased by 0.40% over the past week.
The current yield of United States 10 Year Government Bonds is 4.718%, whereas at the moment of issuance it was 3.520%, which means 0.00% change. Over the week the yield has increased by 0.40%, the month performance has showed a 5.67% increase, and it has risen by 8.01% over the year.
Maturity date is when a debt comes due and all principal and/or interest must be repaid to creditors. For example, the United States 10 Year Government Bonds maturity date is May 15, 2036.
You can buy United States 10 Year Government Bonds through brokers — choose the one that suits your needs and go ahead. You can also purchase bonds directly from the issuing organization. Closely track the price dynamics and market news before making any decision.
A bond is a debt security issued by a corporation or a government. By buying bonds, investors loan the issuer money in return for an interest rate. By issuing bonds, the state receives funds that can then be injected into the economy, and corporations raise funds for new research or other operational activities. The alphanumeric code of government bonds represents the abbreviated name of the issuing state, as well as its time to maturity. For example, United States 10 Year Government Bonds is the US government bonds with the maturity of 10 years.
Bonds can be of various maturities, e.g. short-term (less than three years), medium-term (four to 10 years), or long-term ones (more than 10 years). So United States 10 Year Government Bonds are medium-term bonds — they have the maturity of 10 years.